Drawing Trend Lines? Simple is Best
Click chart to enlarge.
To draw a trend line in a bull market find the first two major swing lows, then draw a line across them. Extend the line out to the right. Assume the bull market remains intact while price remains above the line. When the line is properly breached, it is an indicator of a potential trend change from bull to bear.
This technique works on all time frames.
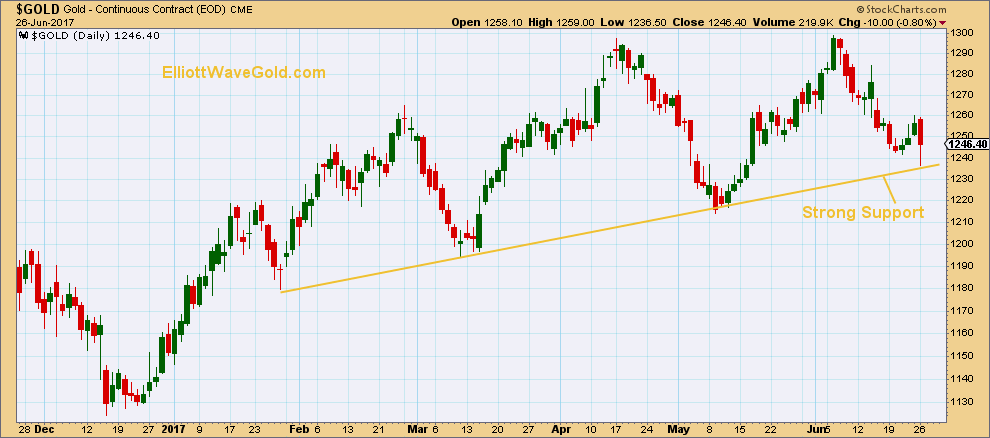
Gold began a series of higher highs and higher lows on the daily chart after the low in December 2016. Within this upwards trend, the first two swing lows are taken as the 27th of January and the 10th of March. This trend line has now been tested eight times, with downwards movement for the last session of the 26th of June being the eighth test.
How Gold behaves at this trend line in the next few days will be a strong indicator. Does the bull run continue or is it over?
This analysis is published @ 03:43 a.m. EST.