August 25, 2022: Copper Elliott Wave and Technical Analysis – Video and Charts
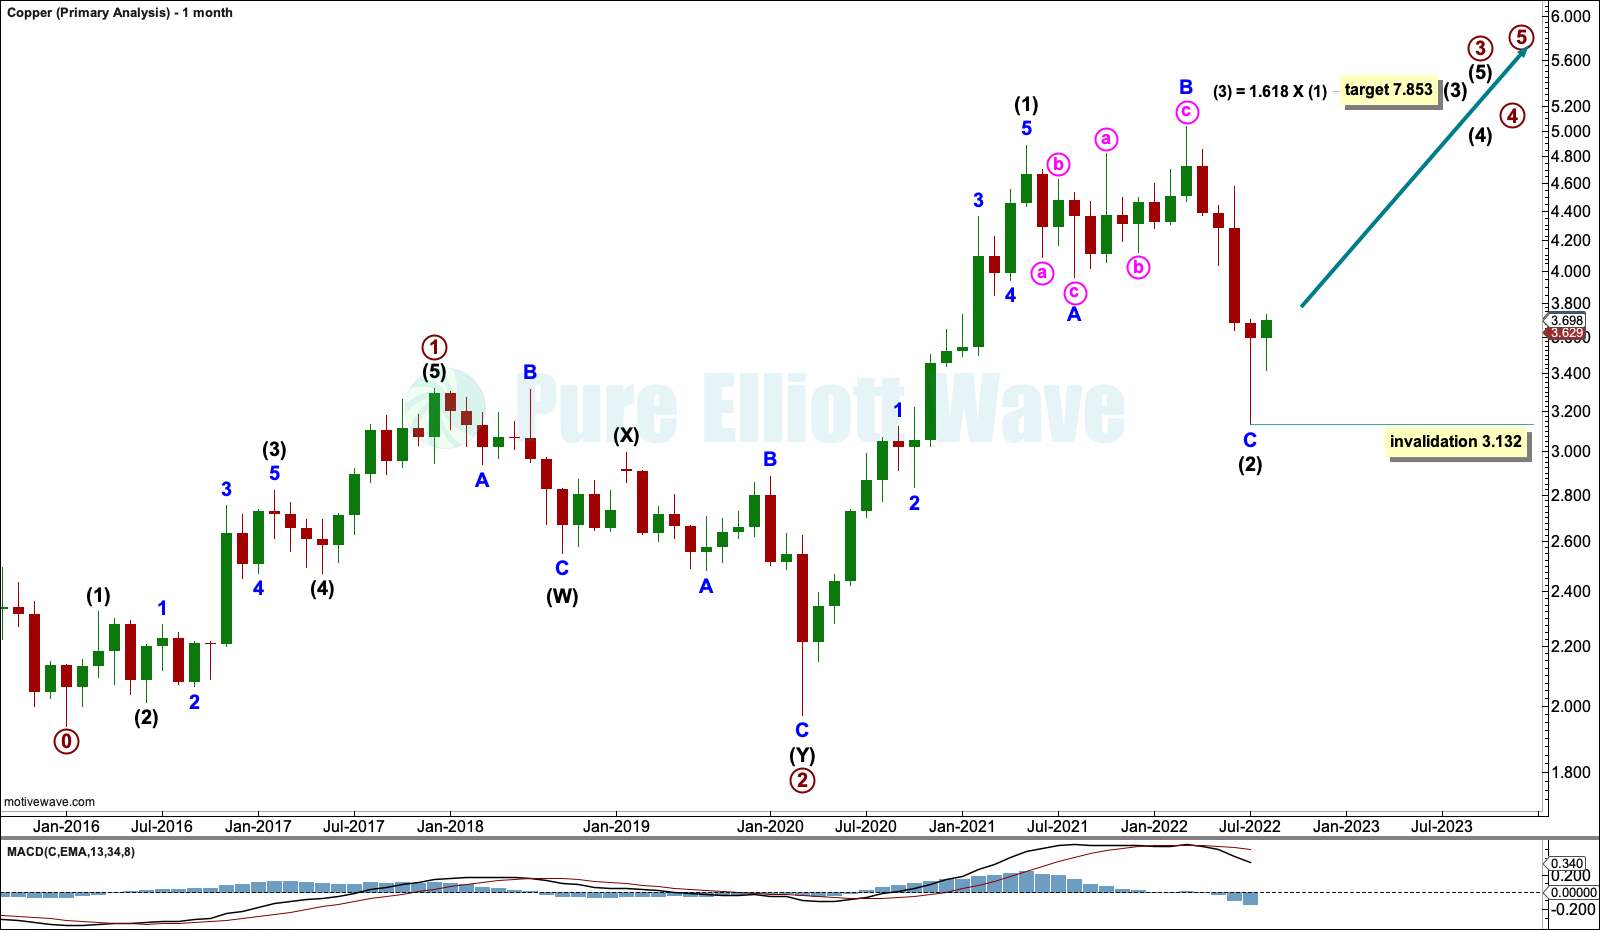
Summary: A sustainable low may have formed for Copper on July 15, 2022, at 3.132.
A target for a third wave up is calculated at 7.853.
MAIN ELLIOTT WAVE COUNT
MONTHLY
This wave count for Copper starts in January 2016. From that low a series of two overlapping first and second waves may be complete, labelled primary waves 1 and 2 and intermediate waves (1) and (2). If this degree of labelling is wrong, then it may be one degree too high.
Within intermediate wave (3), no second wave correction may move beyond its start below 3.132.
Intermediate wave (3) would reach 1.618 the length of intermediate wave (1) at 7.853.
DAILY
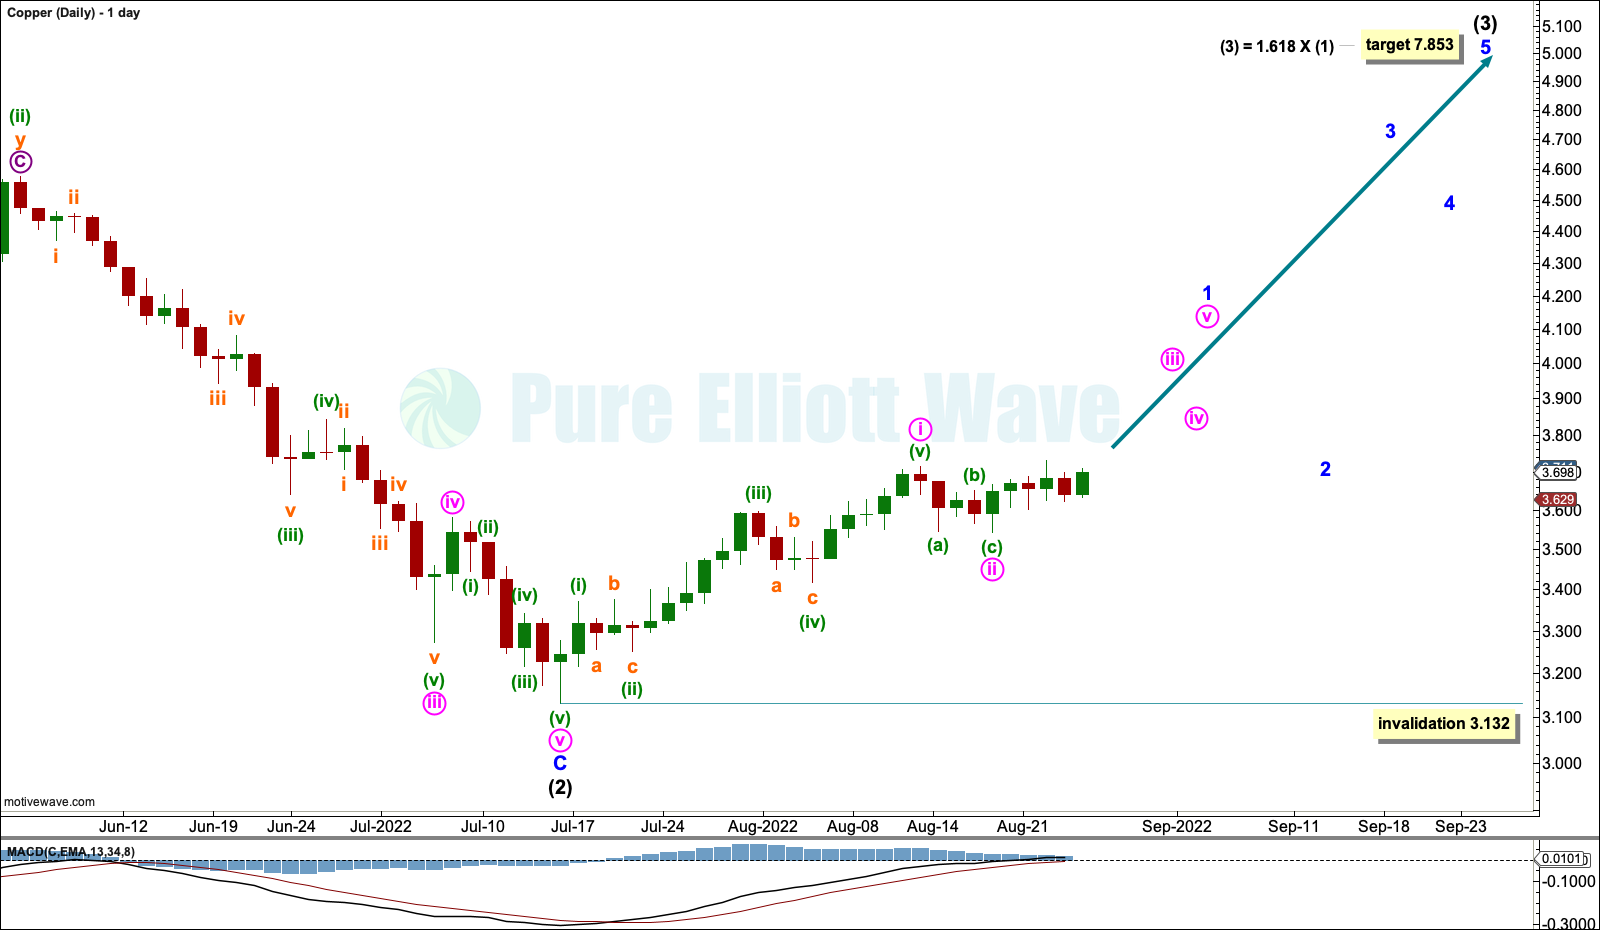
The daily chart focusses on the detail of the start of intermediate wave (3). Intermediate wave (3) may only subdivide as an impulse.
Within the impulse, minor wave 1 may be incomplete. When it arrives, minor wave 2 may not move beyond the start of minor wave 1 below 3.132.
Minute wave i may be complete. Minute wave ii may also be complete, or it may continue sideways or lower.
TECHNICAL ANALYSIS
WEEKLY
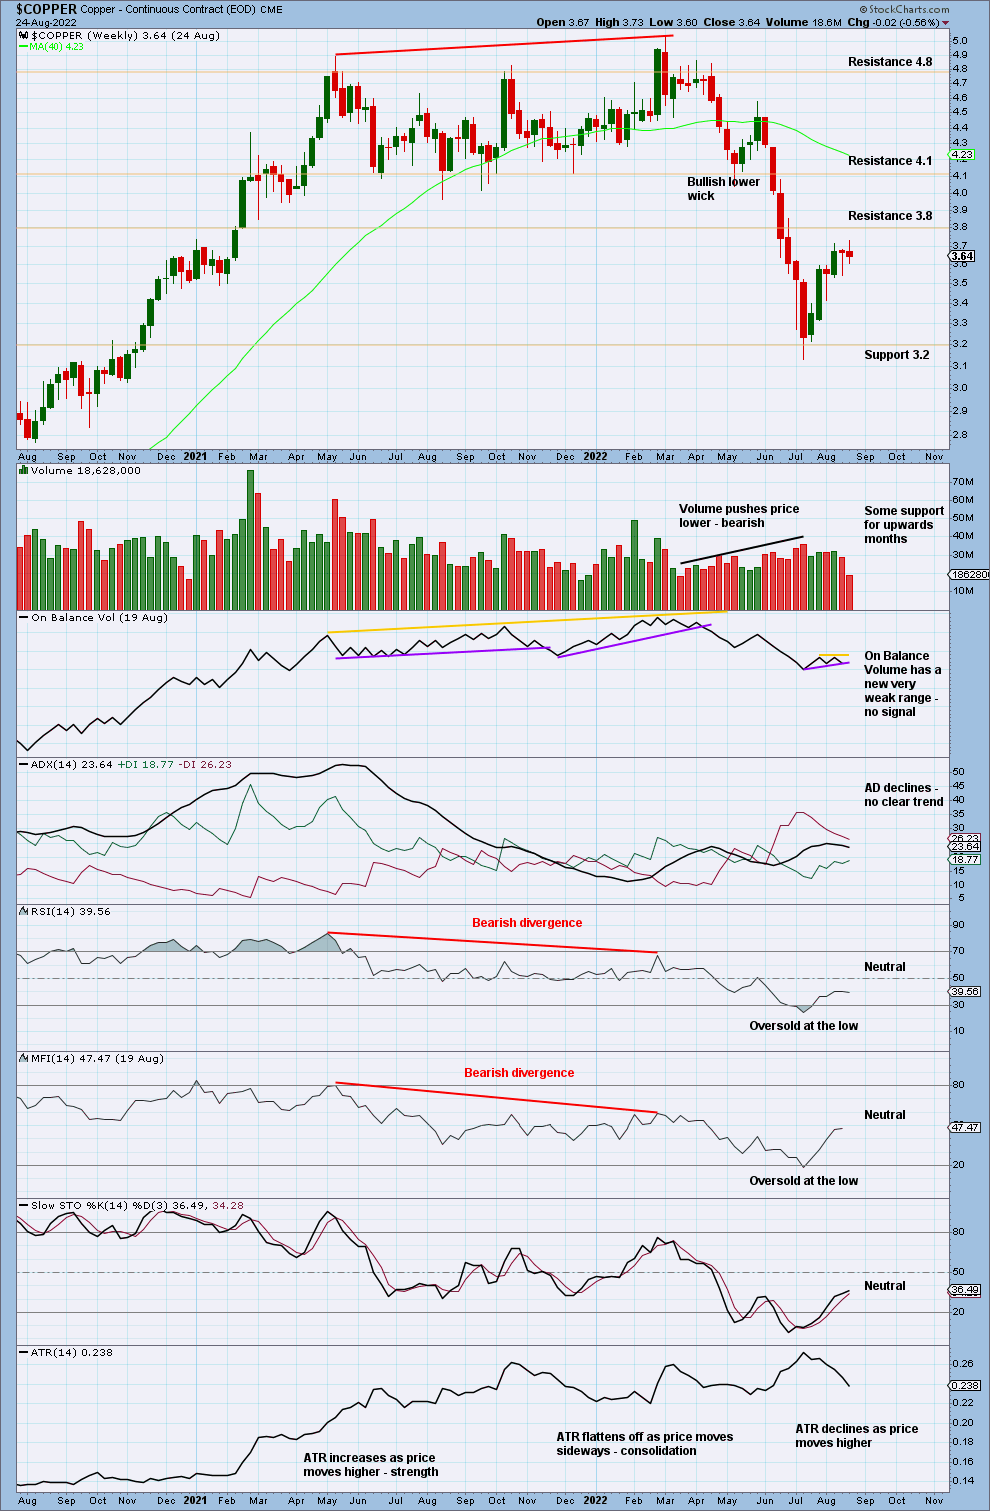
In recent completed weeks there is some support from volume for upwards movement. There is no bullish candlestick pattern at the low. RSI and Money Flow Index both reached oversold at the low. This suggests the low may be sustained, but it may also be possible for another new low to form and exhibit bullish divergence before a low is sustained.
DAILY
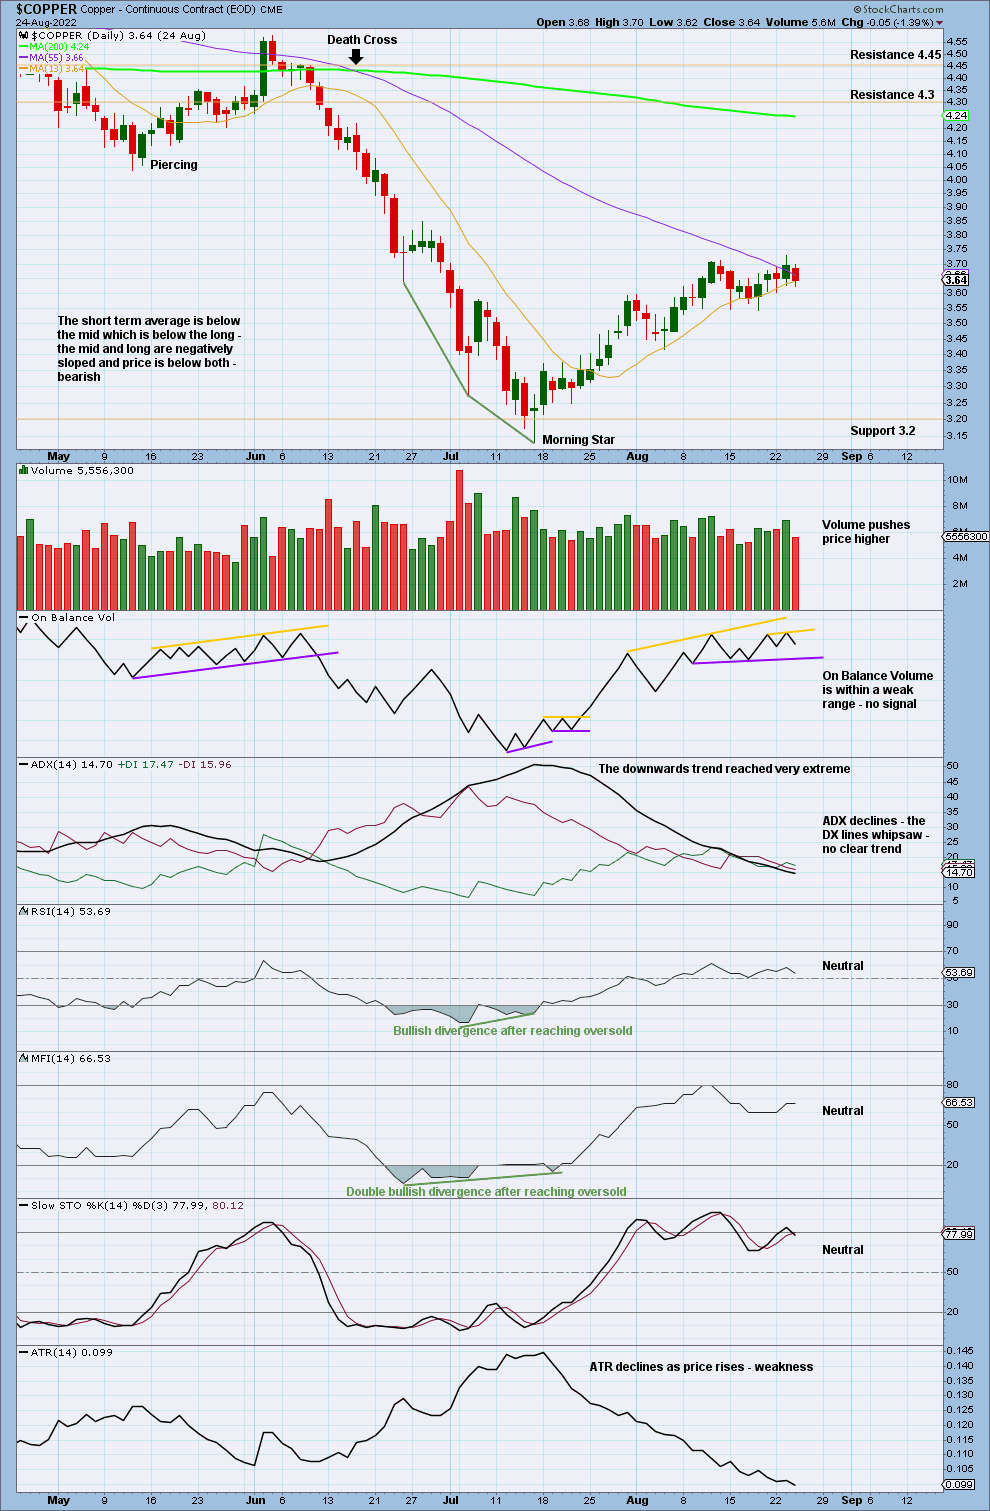
The downwards trend reached very extreme while RSI and Money Flow Index reached oversold then exhibited bullish divergence. In these conditions a bullish candlestick pattern in a Morning Star has formed, it should be given weight. This chart supports the Elliott wave count.
Published @ 06:33 p.m. ET.
—
Careful risk management protects your investments.
Follow my two Golden Rules:
1. Invest only funds you can afford to lose.
2. Have an exit plan for both directions – where or when to take profit, and when to exit a losing investment.


