August 17, 2022: NASDAQ Elliott Wave and Technical Analysis – Charts
It is possible that NASDAQ has found a sustainable low in June 2022 and may have just begun a fifth wave up at cycle degree.
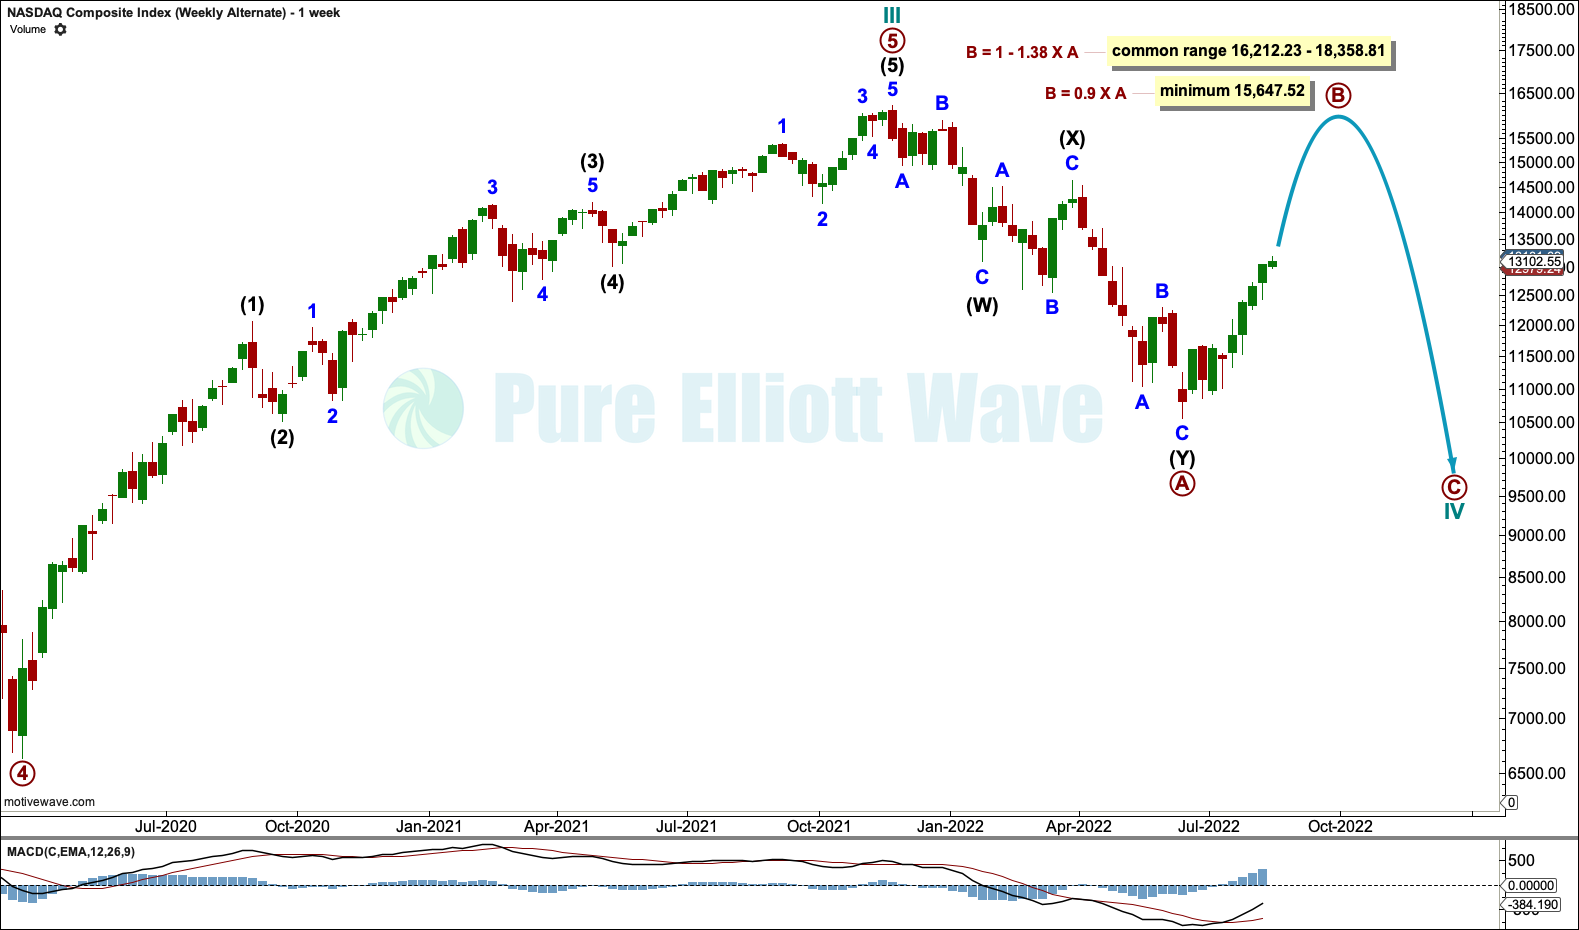
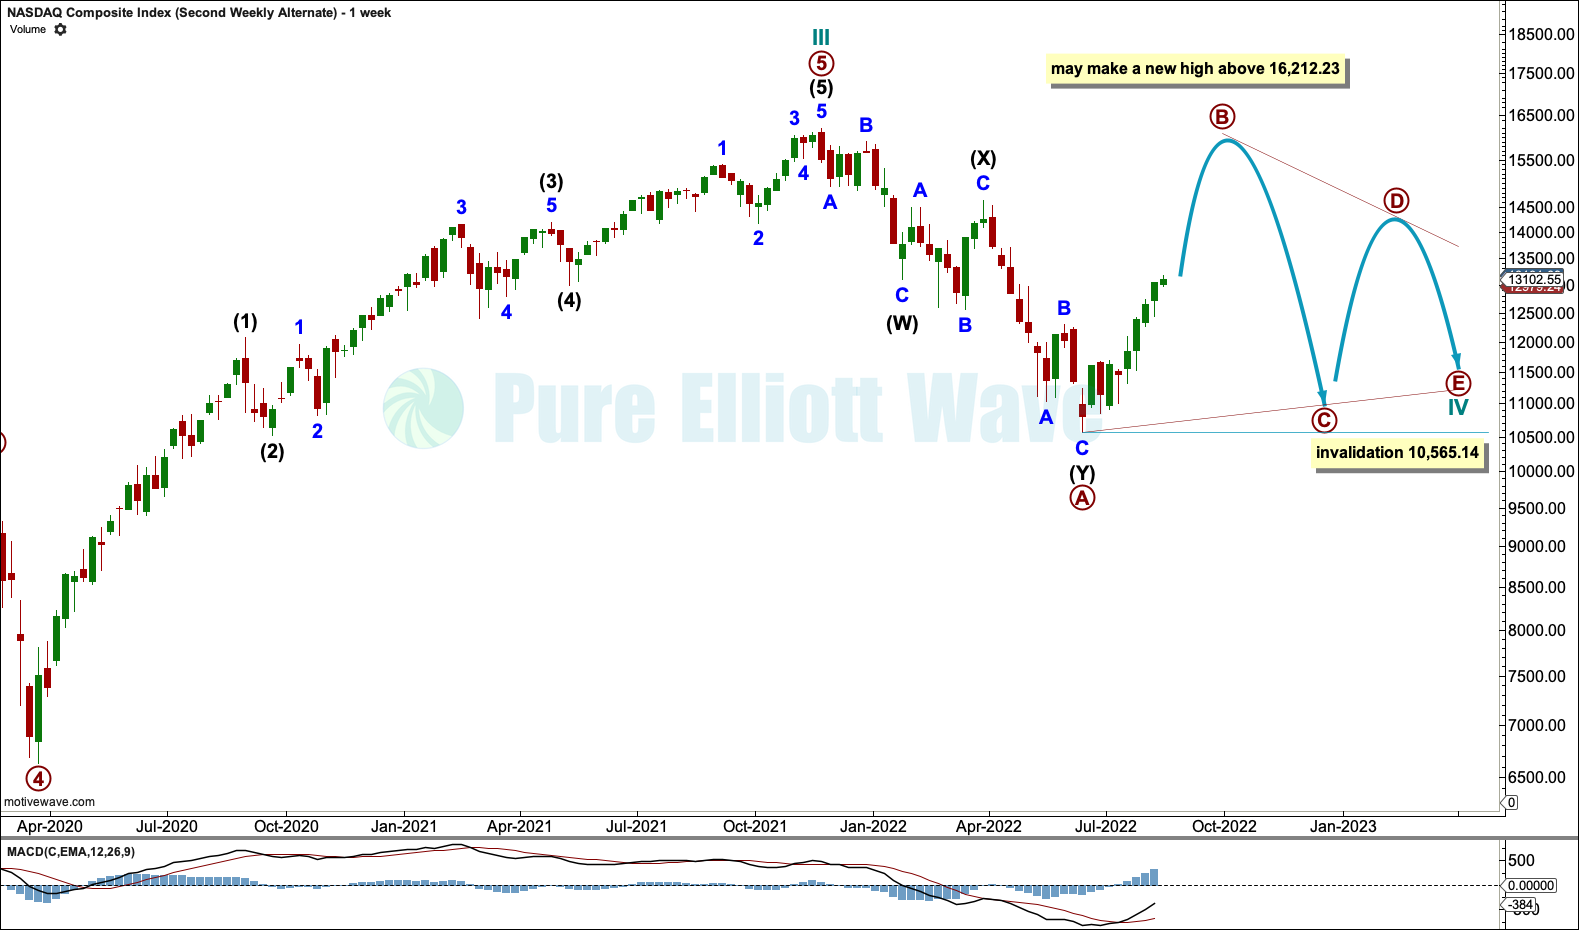
Summary: Two alternates consider the low may not be in and a large consolidation, which may or may not make a slight new low (a flat or triangle), may continue sideways for months yet.
Note that the S&P500 and NASDAQ do not always find highs and lows together. The last all-time high for the S&P500 was on January 4, 2022, whereas the last all-time high for NASDAQ was November 22, 2021.
MAIN ELLIOTT WAVE COUNT
QUARTERLY CHART
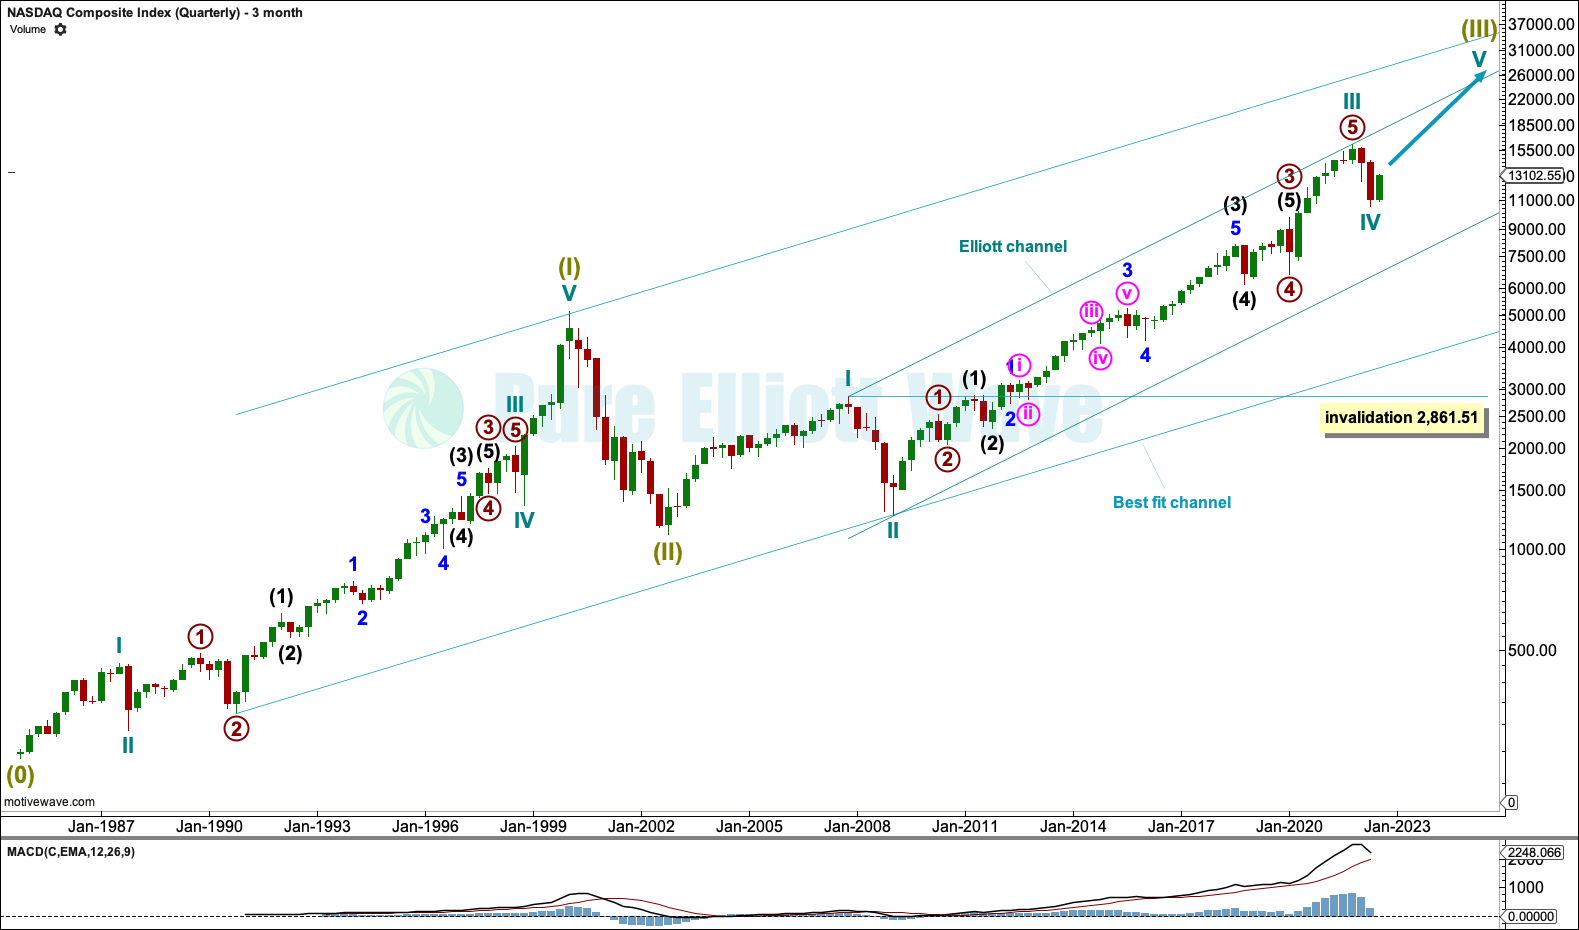
Click chart to enlarge.
MONTHLY CHART
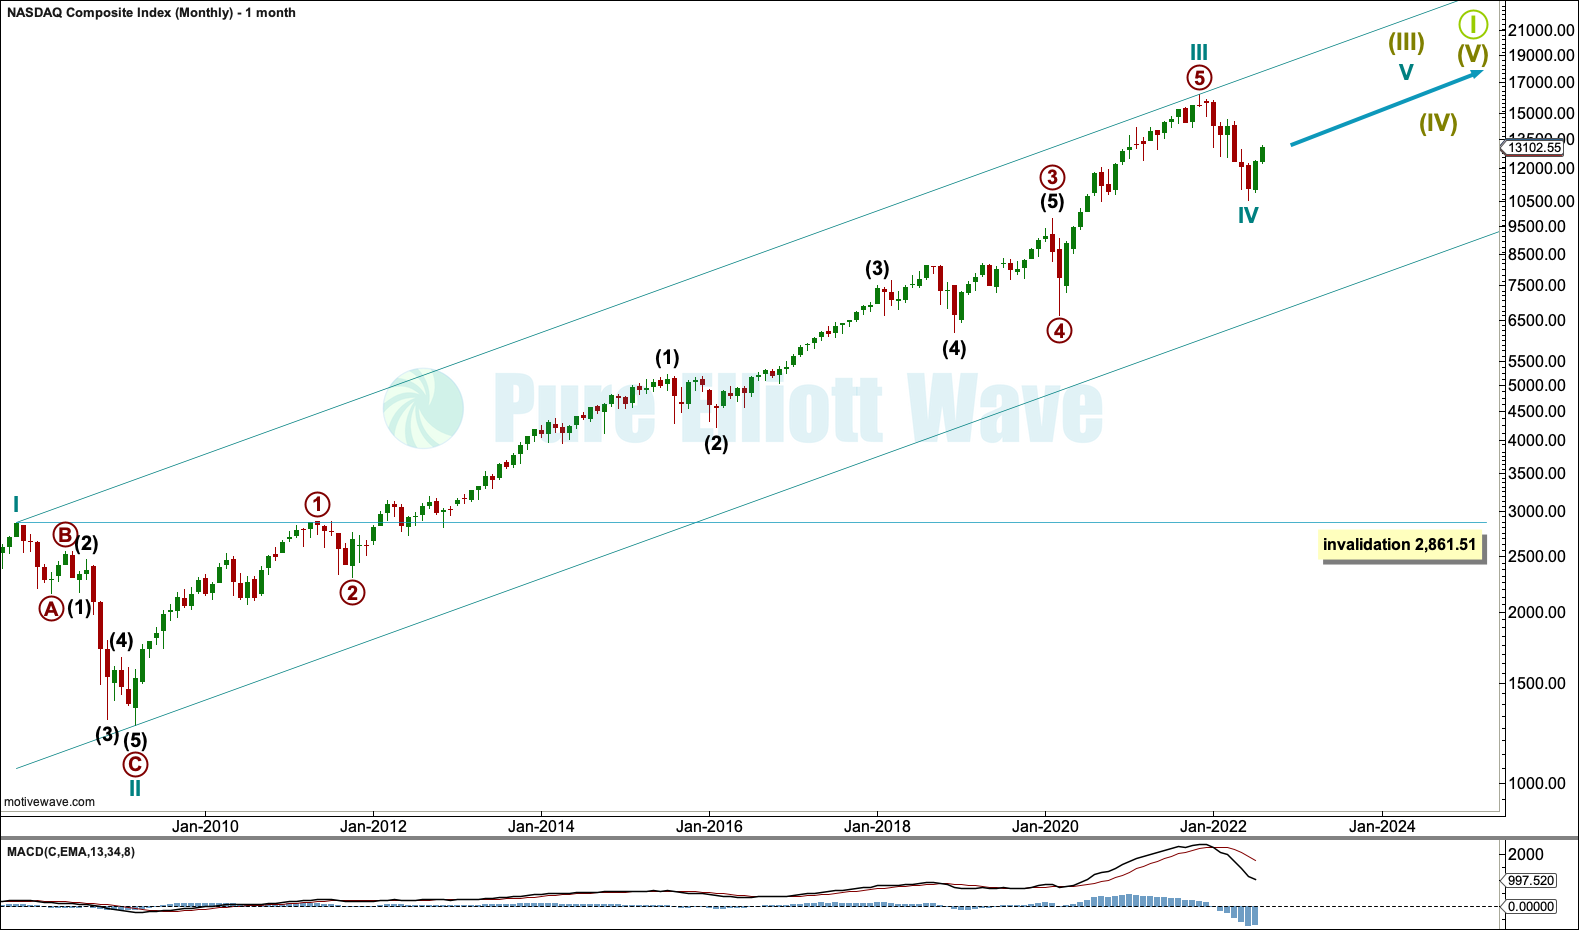
Click chart to enlarge.
WEEKLY CHART
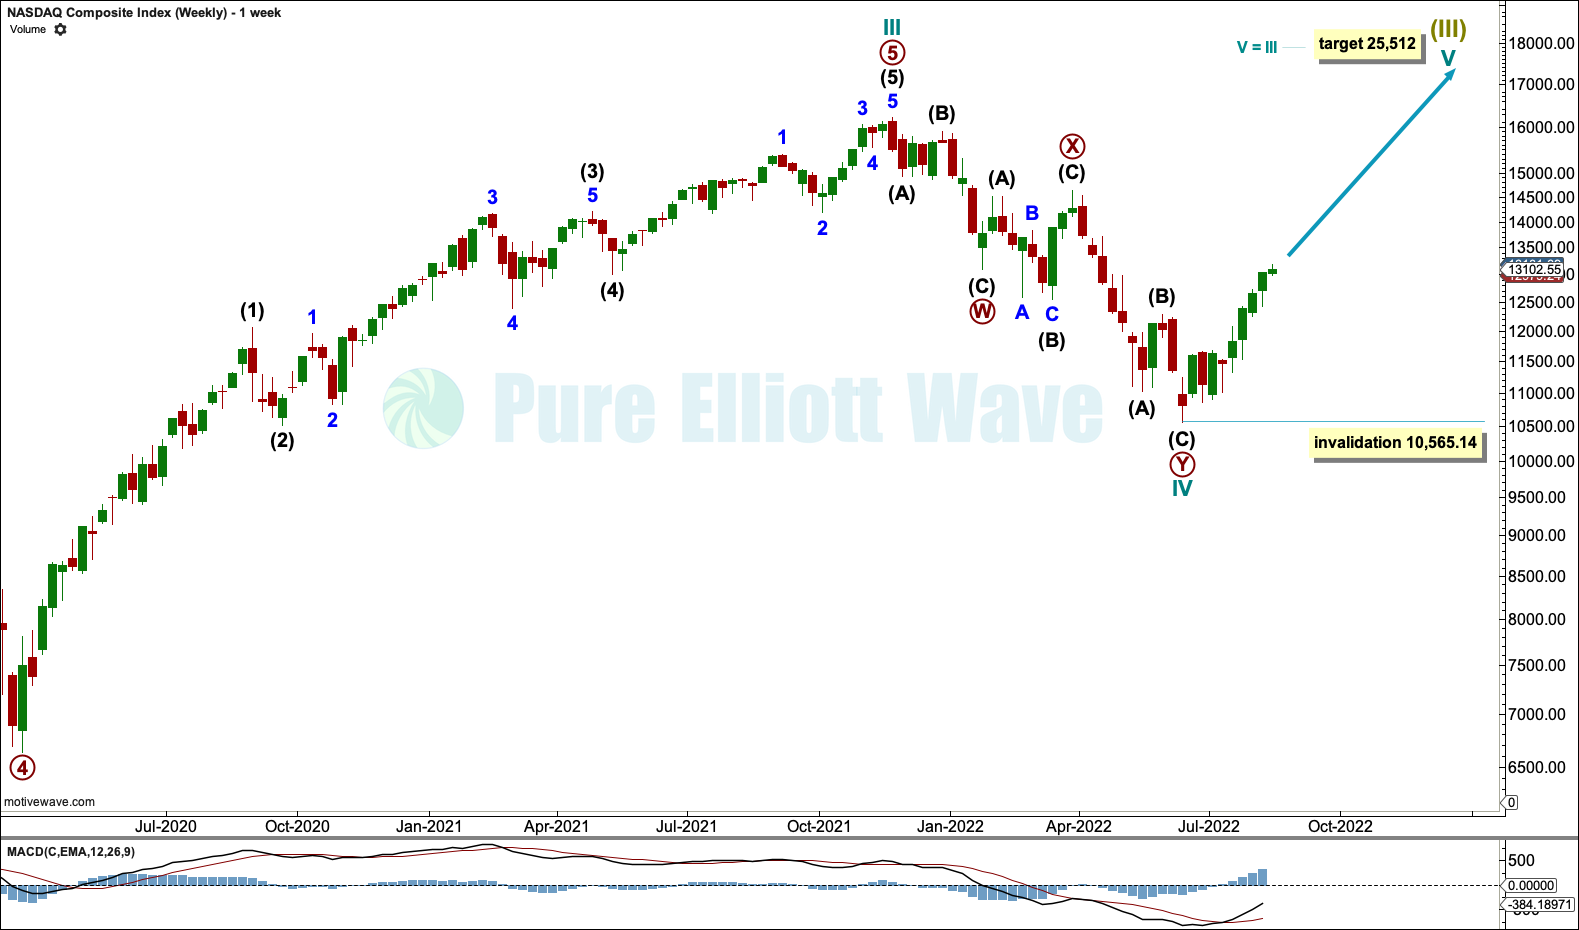
Click chart to enlarge.
FIRST ALTERNATE WEEKLY CHART
Click chart to enlarge.
SECOND ALTERNATE WEEKLY CHART
Click chart to enlarge.
TECHNICAL ANALYSIS
WEEKLY CHART
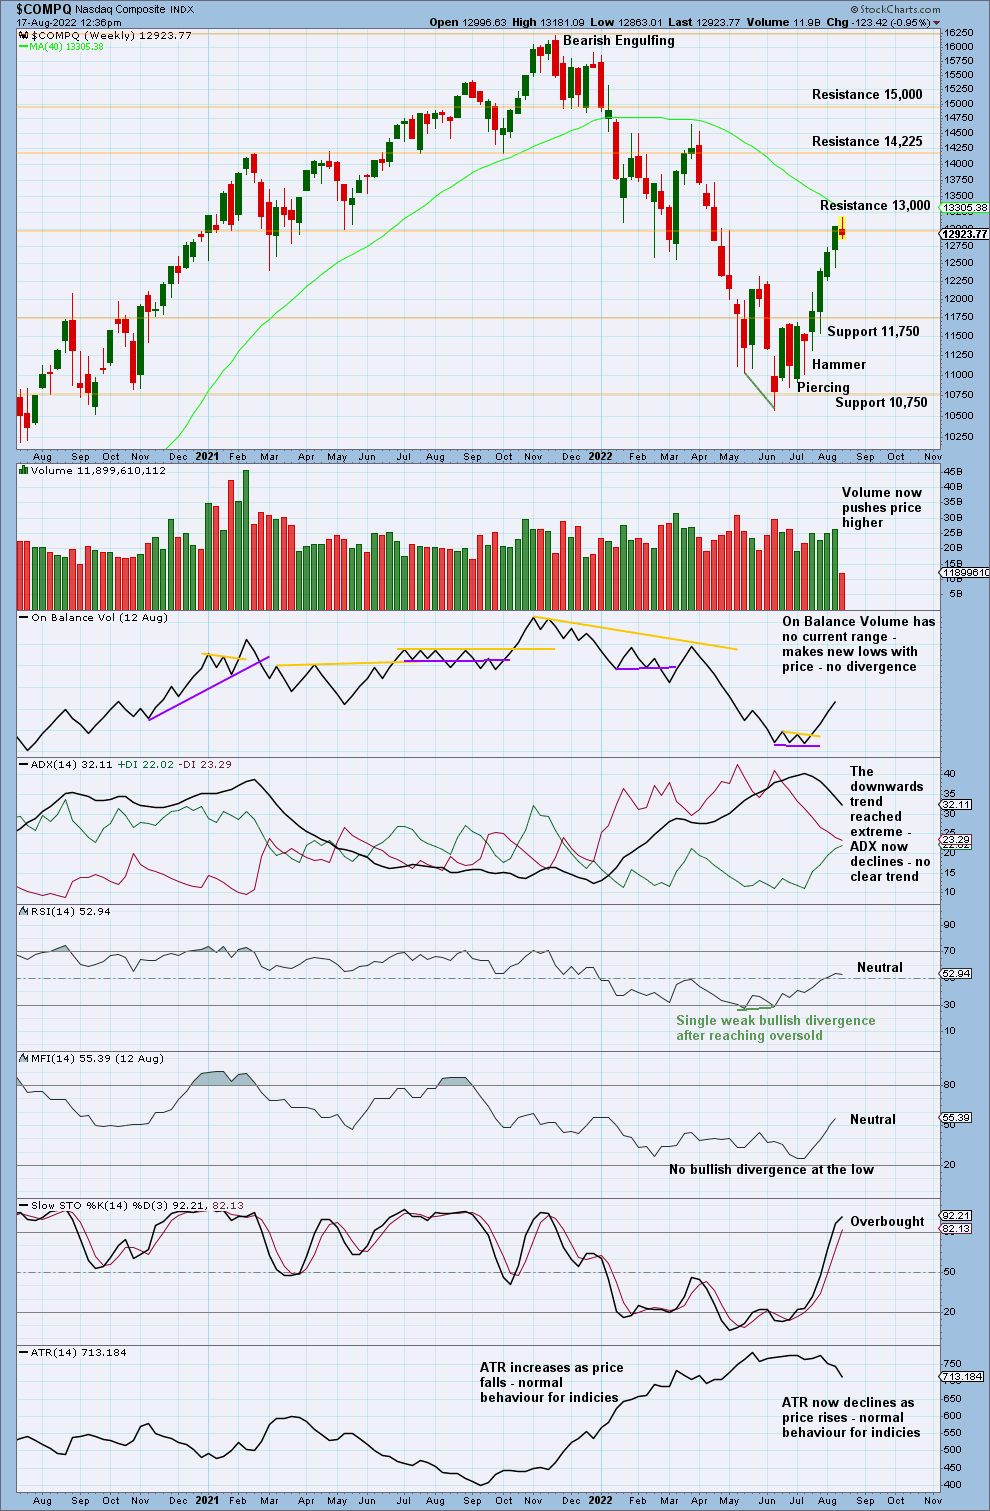
Click chart to enlarge.
DAILY CHART
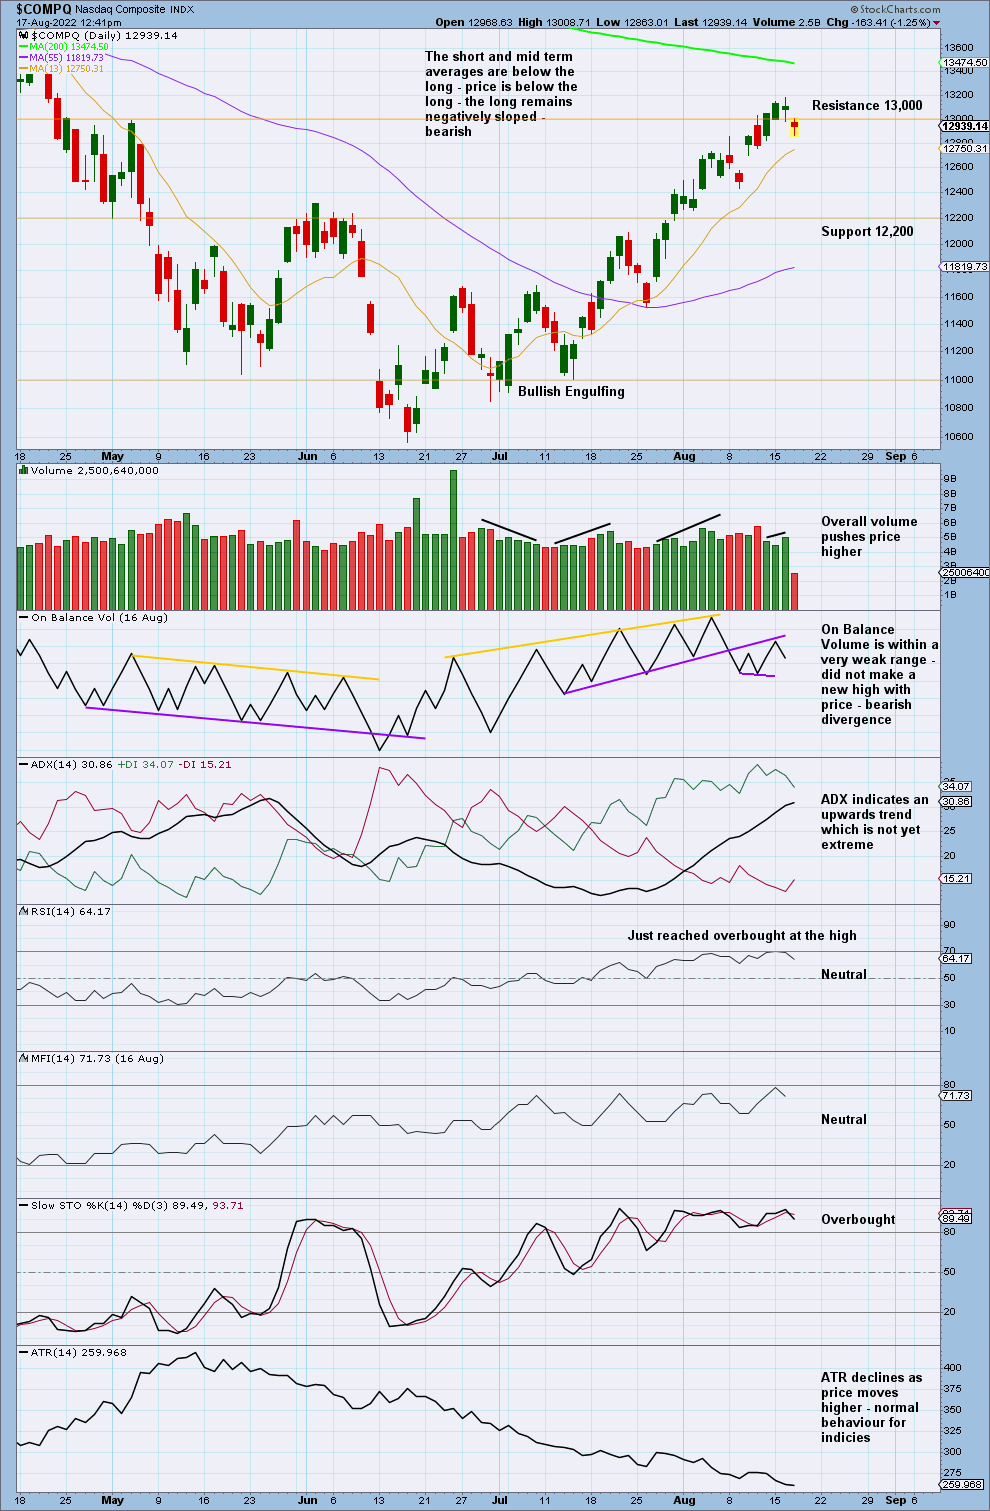
Click chart to enlarge.
Published @ 06:47 p.m. ET.
—
Careful risk management protects your trading account(s).
Follow my two Golden Rules:
1. Always trade with stops.
2. Risk only 1-5% of equity on any one trade.
—
New updates to this analysis are in bold.
—
 Save as PDF