May 12, 2023: NASDAQ Elliott Wave and Technical Analysis – Video and Charts
Summary: Price is expected to increase within primary wave 1, currently within minor wave 1 of intermediate wave (3).
Note that the S&P500 and NASDAQ do not always find highs and lows together. The last all-time high for the S&P500 was on January 4, 2022, whereas the last all-time high for NASDAQ was November 22, 2021.
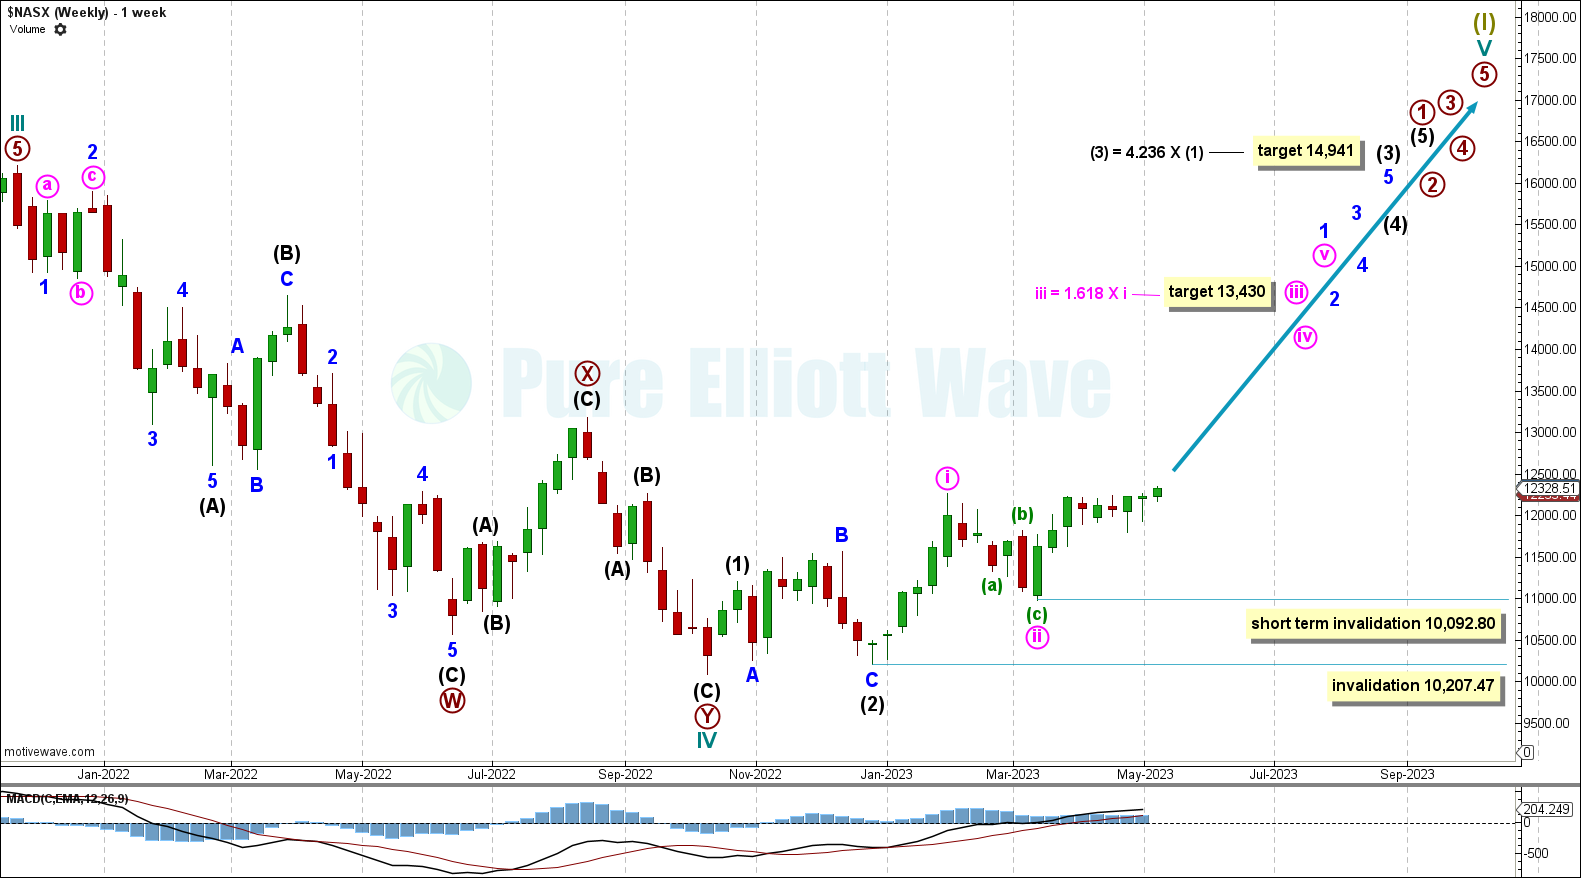
MAIN ELLIOTT WAVE COUNT
WEEKLY CHART
Click chart to enlarge.
Cycle wave IV may be over at the last low.
Within primary wave 1: Intermediate waves (1) and (2) may be over and intermediate wave (3) may now be starting.
Within intermediate wave (3): Minute waves i and ii may be over and minute iii may be starting. For the short-term wave count, a second wave correction within minute wave iii may not move below 10,092.80.
Intermediate wave (3) has a target calculated at 4.236 times the length of intermediate wave (1), at 14,941. A second wave correction within intermediate wave (3) may not move below 10,207.47.
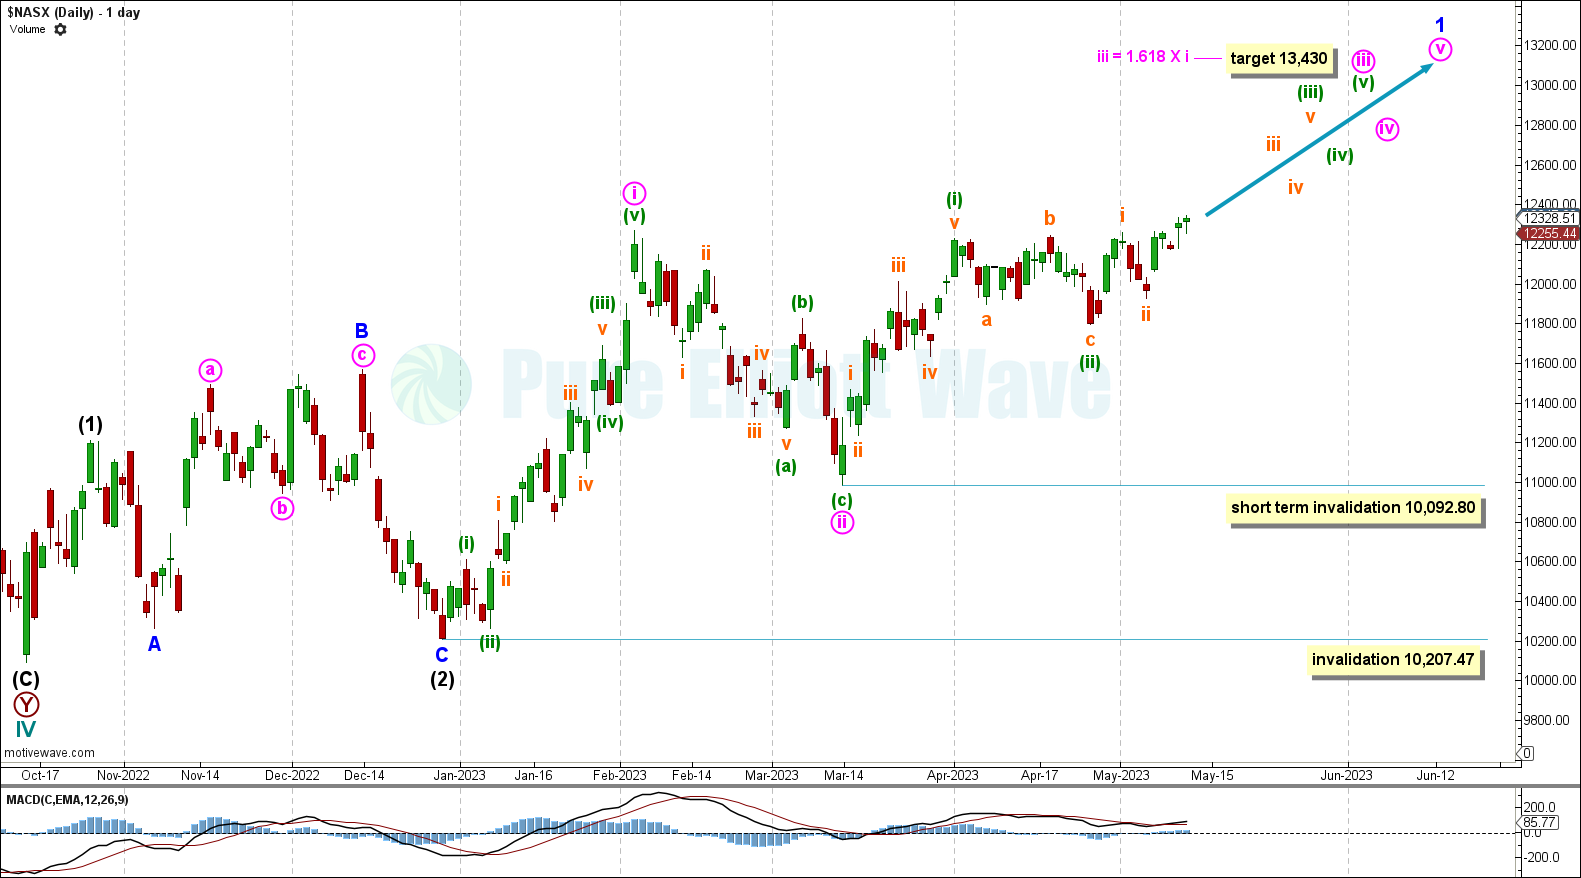
DAILY CHART
Click chart to enlarge.
Within intermediate wave (3), minor wave 1 looks likely to be an incomplete impulse, with minute waves i and ii complete.
Minute wave iii within minor wave 1 may be in its minuette (iii) wave.
TECHNICAL ANALYSIS
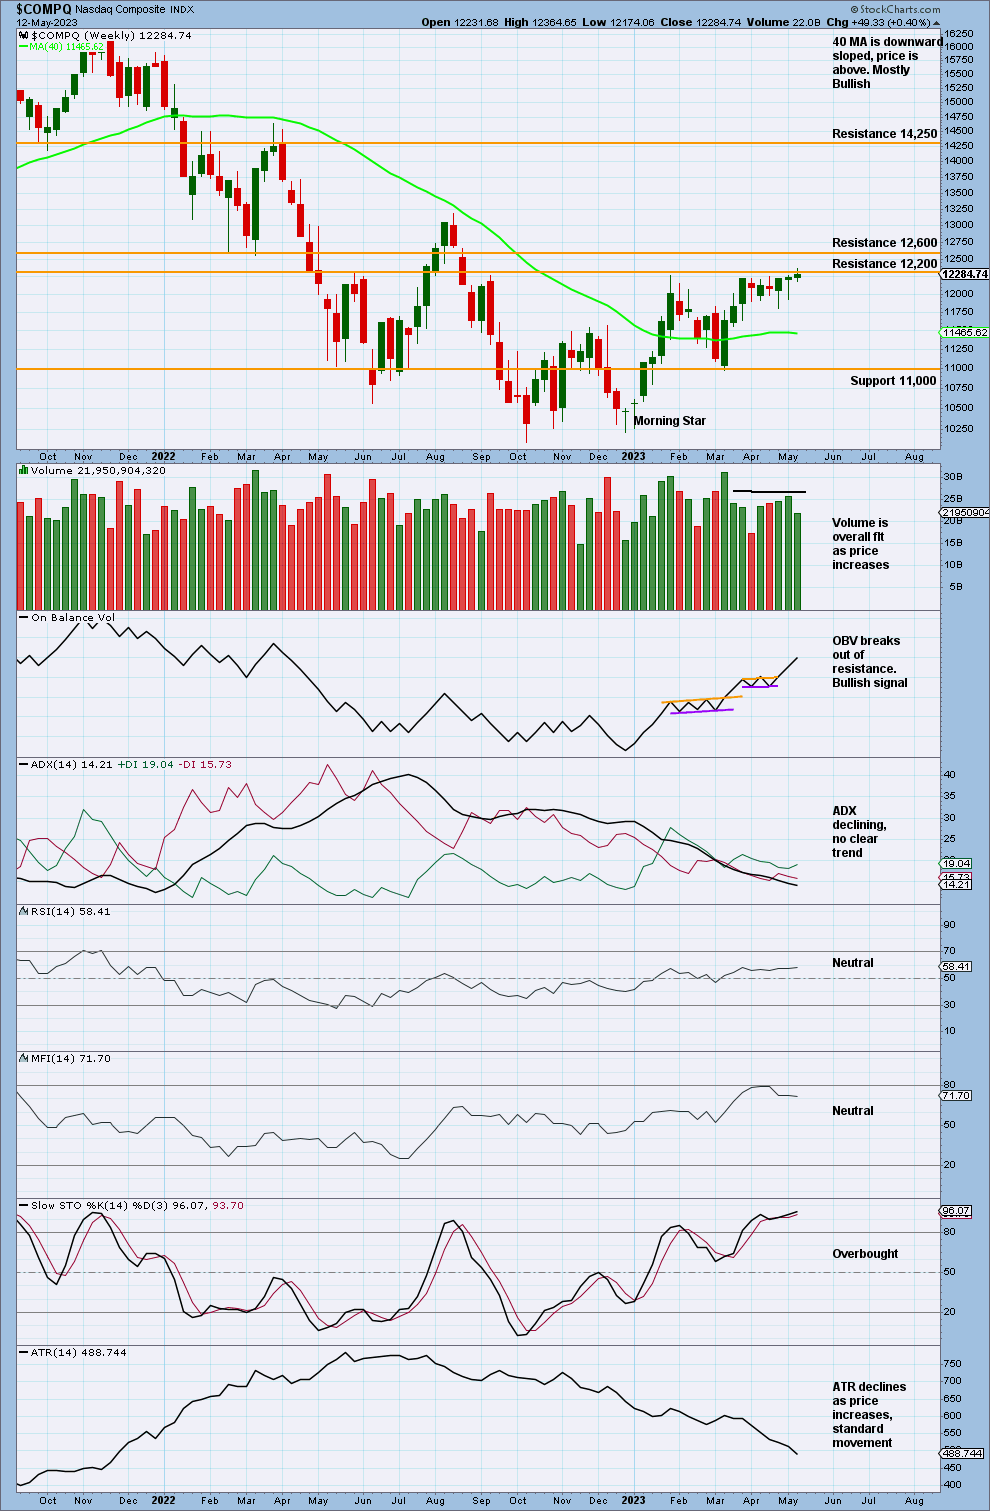
WEEKLY CHART
Click chart to enlarge.
This week has a small bullish candlestick.
Volume has dropped slightly, but is still overall flat. With On Balance Volume breaking out of resistance with a bullish signal, it supports the Elliott wave count.
ATR also declines as price increases, which is standard movement in this market for a bullish movement.
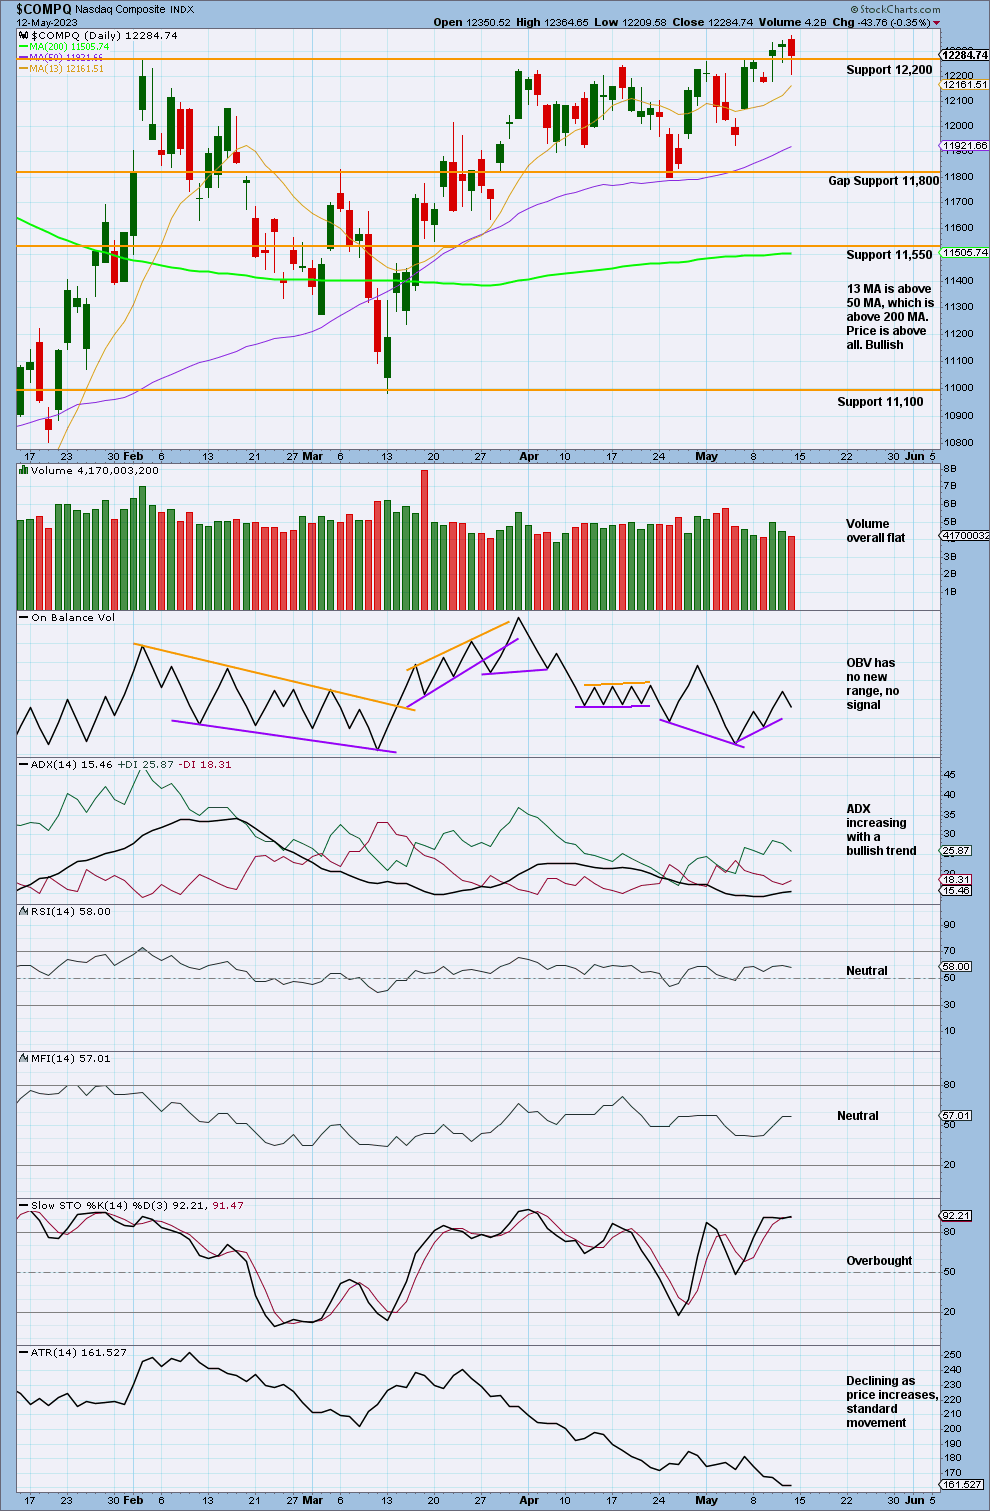
DAILY CHART
Click chart to enlarge
Price has moved above prior resistance, now leaving it as support.
ADX increases with a bullish trend from a low point, which gives the strongest bullish signal possible from ADX. ATR also declines further, which lends more support to the Elliott wave count. Overall, this supports the Elliott wave count.
NAAD WEEKLY CHART
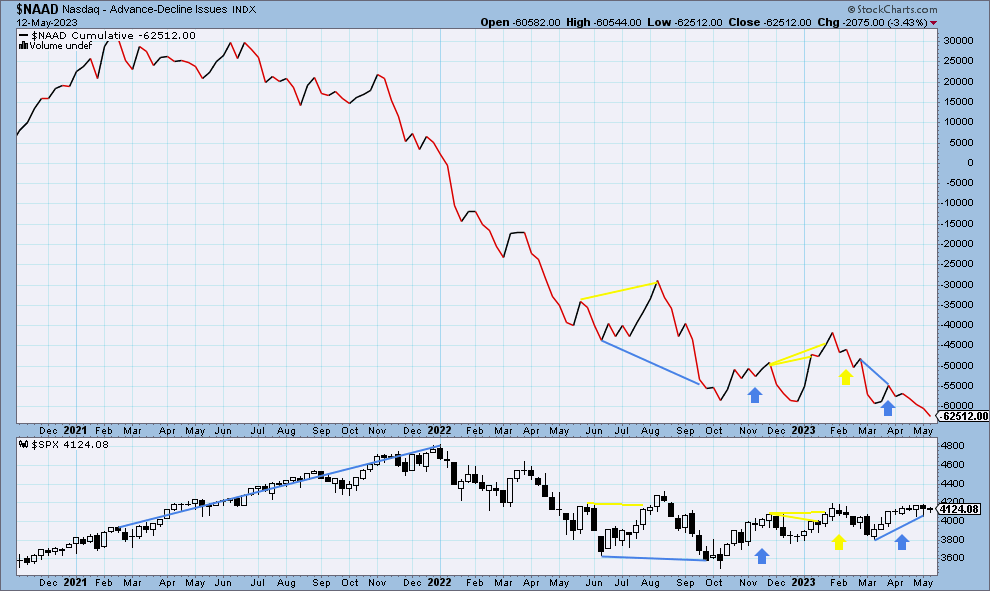
Click chart to enlarge
The Nasdaq AD line continues to make new lows where price has not. This divergence is bearish for the short, mid and long term.
Published @ 10:45 a.m. ET on May 14, 2023.
—
Careful risk management protects your trading account(s).
Follow my two Golden Rules:
1. Always trade with stops.
2. Risk only 1-5% of equity on any one trade.
—
New updates to this analysis are in bold.
—
 Save as PDF