July 6, 2023: SILVER Elliott Wave and Technical Analysis – Video and Charts
Summary: Price moves away from resistance. Mid-term bearish movement supports the main Elliott wave count.
Monthly charts are updated this week.
BEARISH ELLIOTT WAVE COUNT
MONTHLY CHART
Click chart to enlarge.
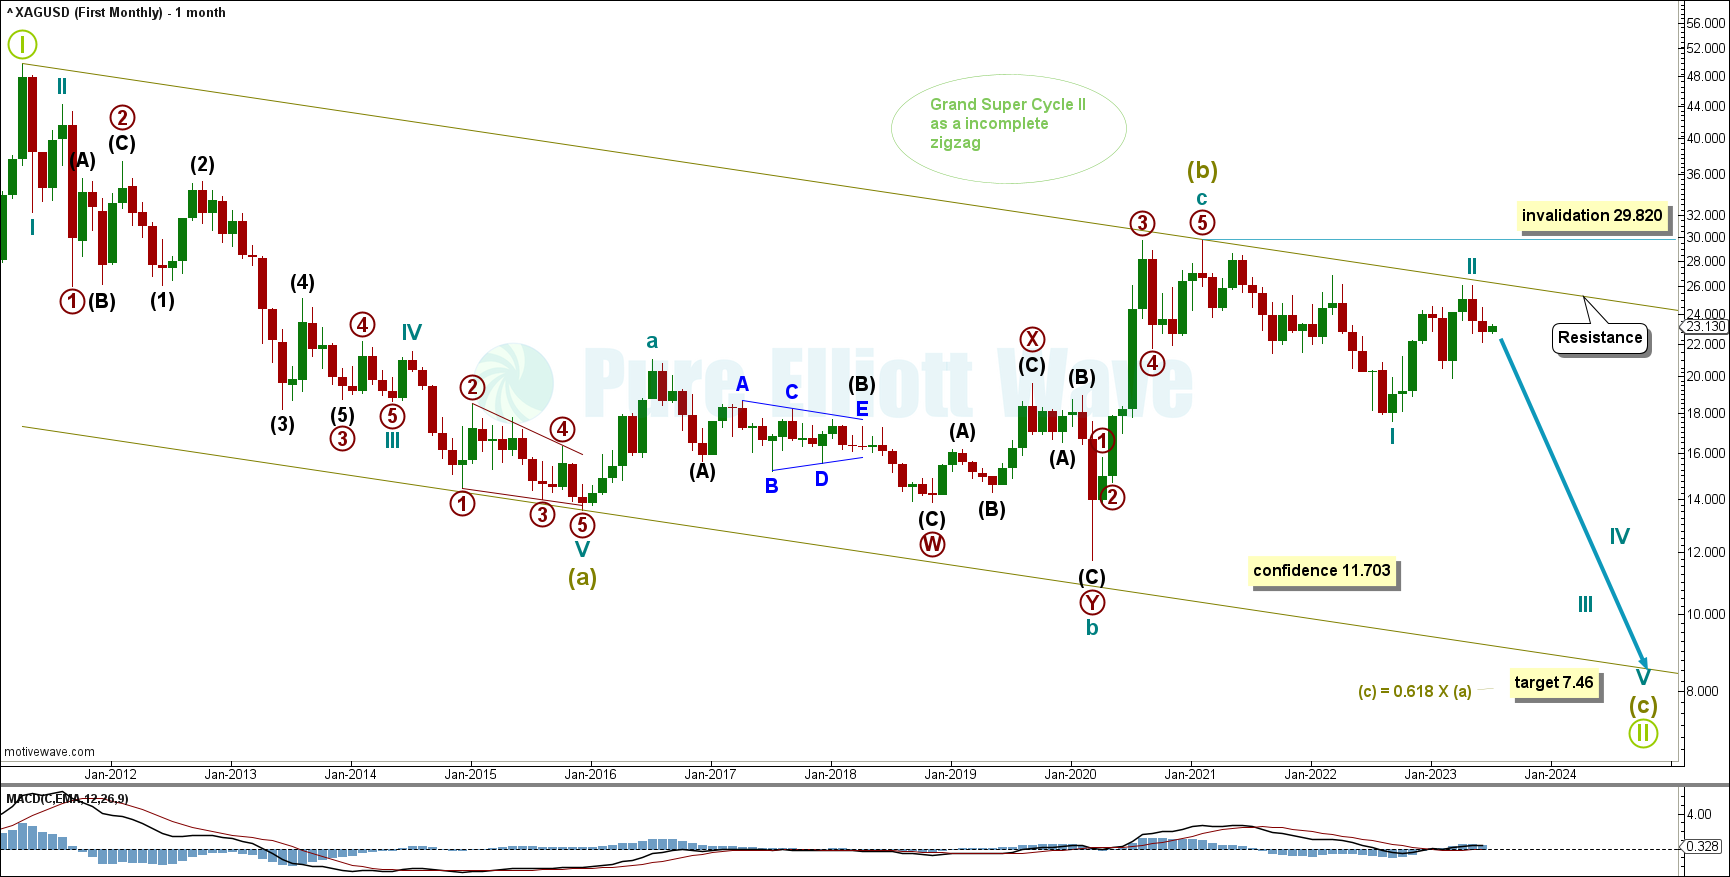
Cycle wave II is expected to be complete at the last high as price moves away from resistance. However, cycle wave II may continue higher, though it cannot move above the beginning of cycle wave I at 29.820.
Cycle wave III can only subdivide as an impulse. If there is a new low below 11.703, the end of cycle wave b within Supercycle wave (b), then there will be added confidence in Supercycle wave (c) being an impulse.
Supercycle wave (c) has a target calculated to reach the 0.618 fibonacci ratio of Supercycle wave (a) at 7.46.
WEEKLY CHART
Click chart to enlarge.
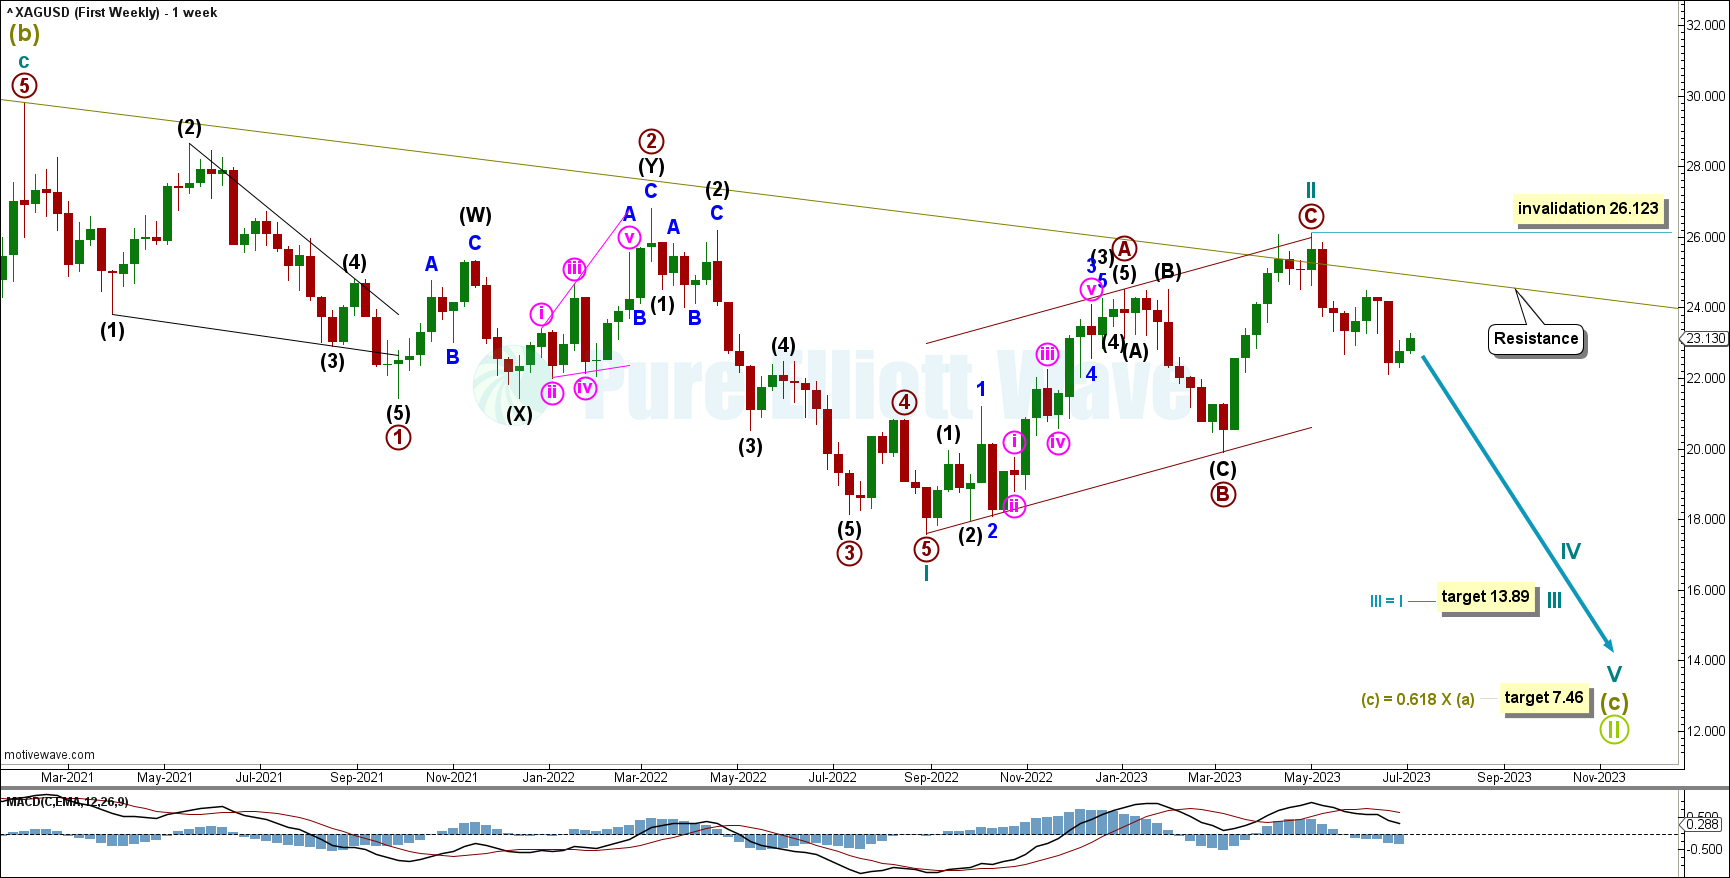
There are two possible structures that Super Cycle wave (c) may subdivide as, an impulse (more likely) or an ending diagonal (less likely). An impulse requires cycle wave I to subdivide as a five wave motive structure. Cycle wave I fits well as an impulse, which indicates Super Cycle wave (c) would most likely be subdividing as an impulse.
Within the impulse, cycle waves I and II may be complete, with price now moving down for cycle wave III.
No corrective movement within cycle wave III can move above its start at 26.123.
With recent downwards movement there is added confidence in Cycle wave II being complete at the last high, corresponding with resistance at the Supercycle degree trend channel. Price is now expected to continue downwards for Cycle wave III.
Cycle wave III has a target calculated to reach equality in length with cycle wave I at 13.89.
DAILY CHART
Click chart to enlarge.
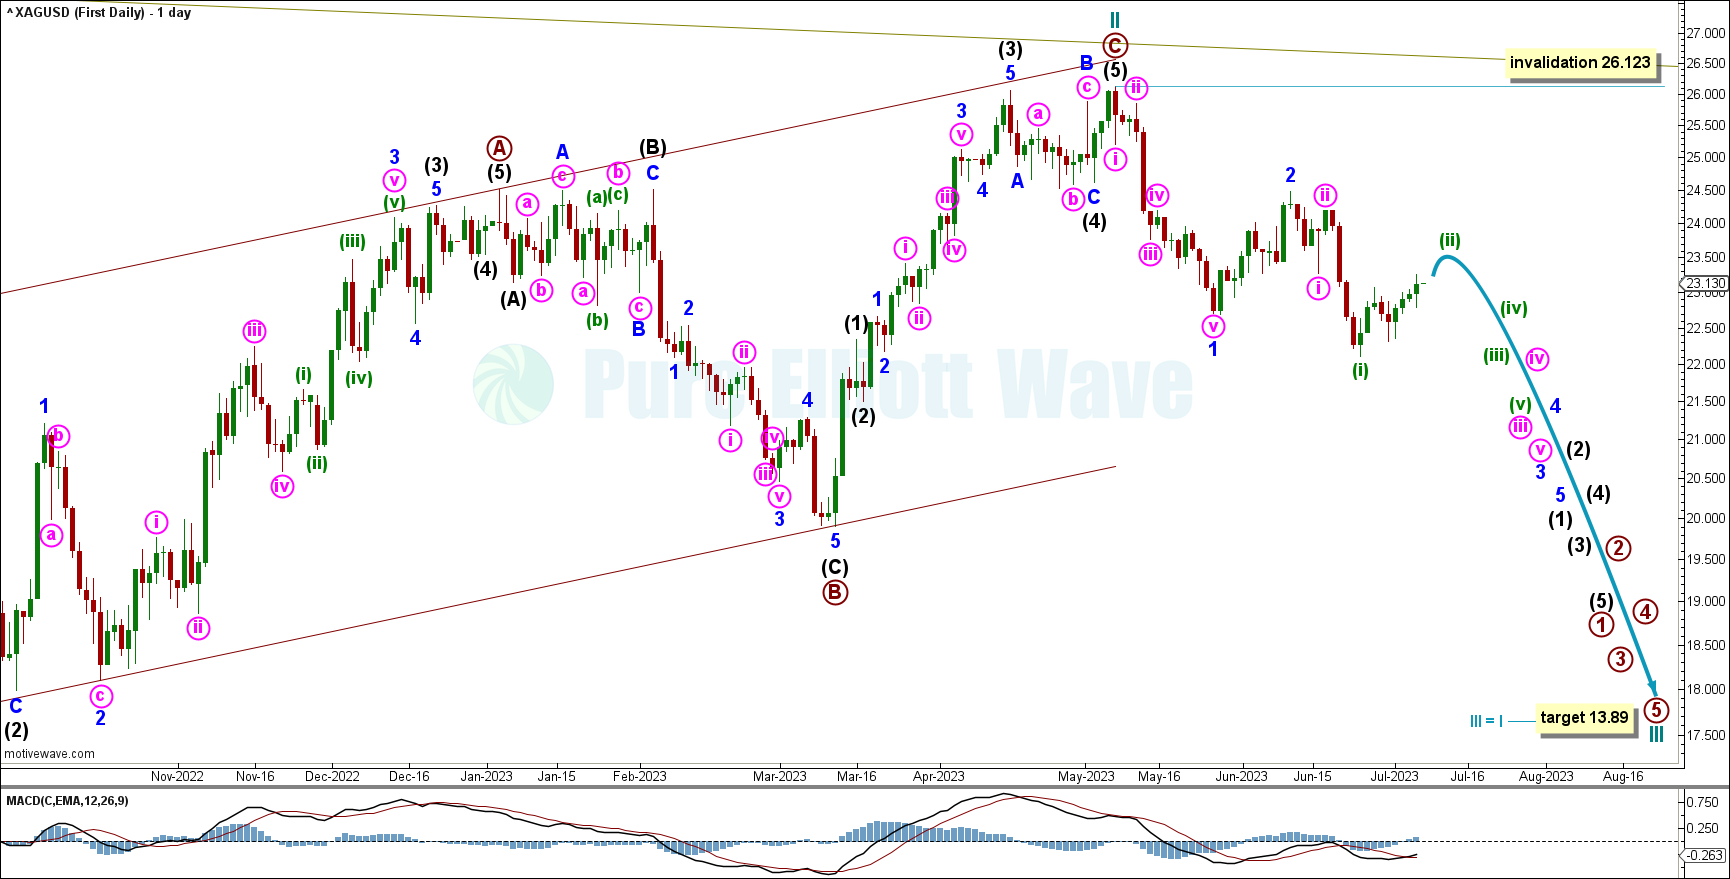
Cycle wave III has to unfold as an impulse. Within the impulse, minor waves 1 and 2 may be complete along with minute waves i and ii within minor wave 3. Some slight upwards movement is expected to complete minuette wave (ii) within minute wave iii before the expected increased downwards momentum develops for overlapping third waves at minuette, minute, and minor degrees.
If price moves below the last low of primary wave B within cycle wave II at 19.909, then there will be added confidence to this wave count as at that point the alternate wave count below would be invalidated.
BULLISH ELLIOTT WAVE COUNT.
MONTHLY CHART
Click chart to enlarge.
Price has continued upwards with some slight downwards movement recently. The bullish trend is expected to continue with its bearish movements seen as corrective structures.
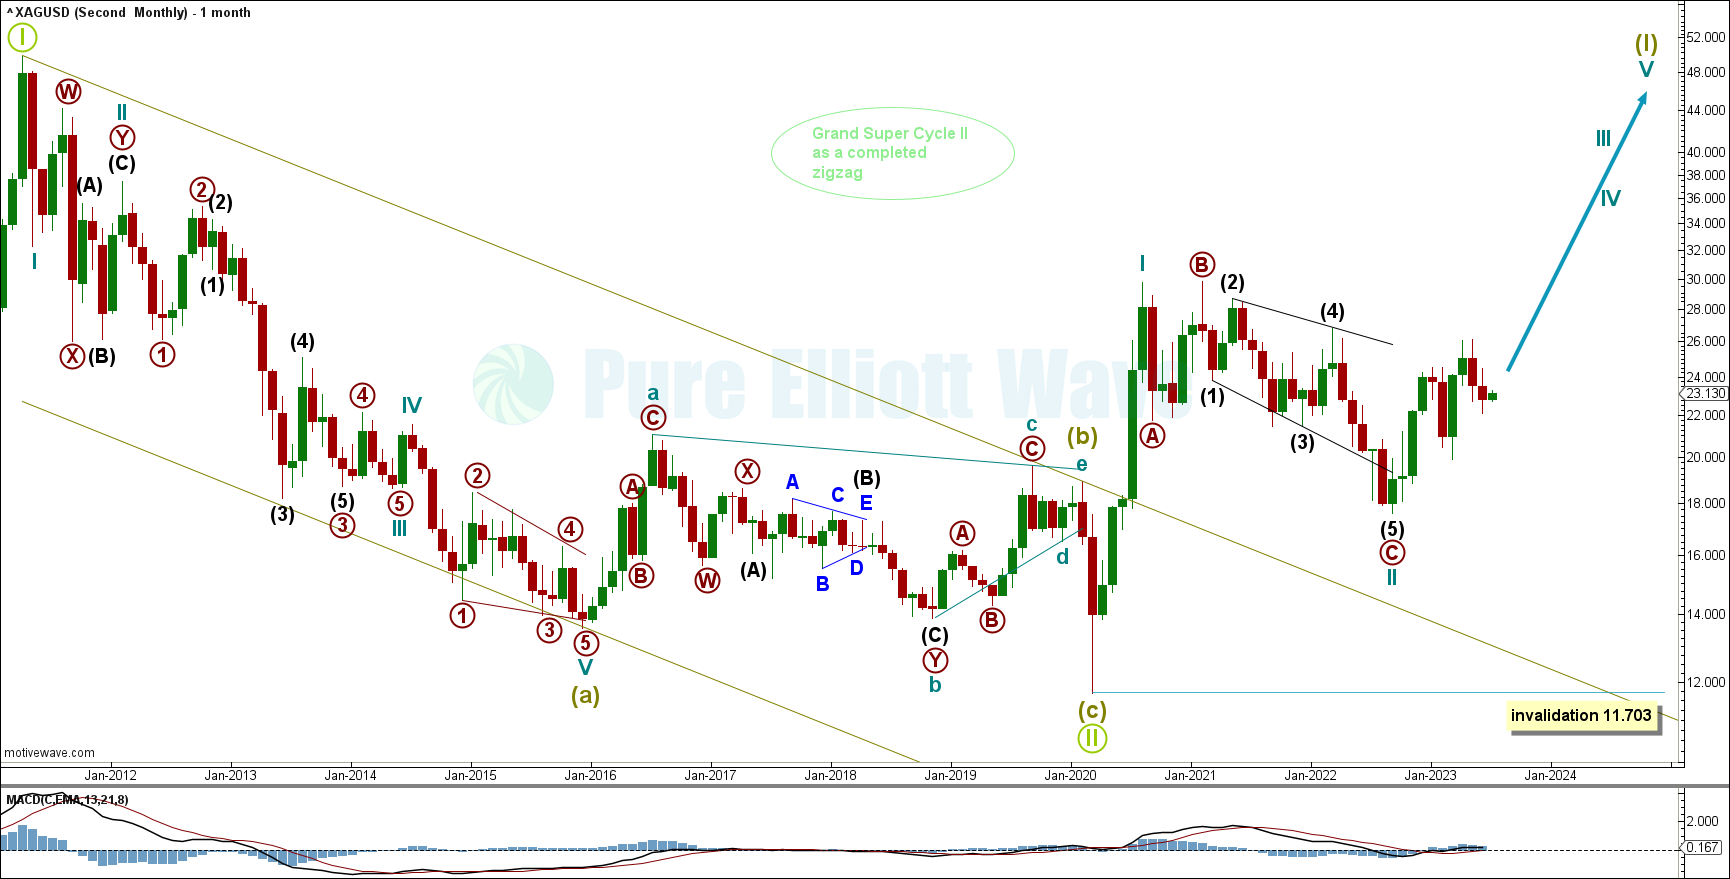
Grand Supercycle wave II is expected to be complete at the last low. Now, upwards movement is expected to continue for third waves at Grand Supercycle, Supercycle, and cycle degrees.
Supercycle wave (I) is expected to be unfolding as an impulse, as cycle wave I fits well as a five wave motive structure. If Supercycle wave (I) does unfold as an impulse, a second wave corrective movement cannot move below its start at 11.703.
WEEKLY CHART
Click chart to enlarge.
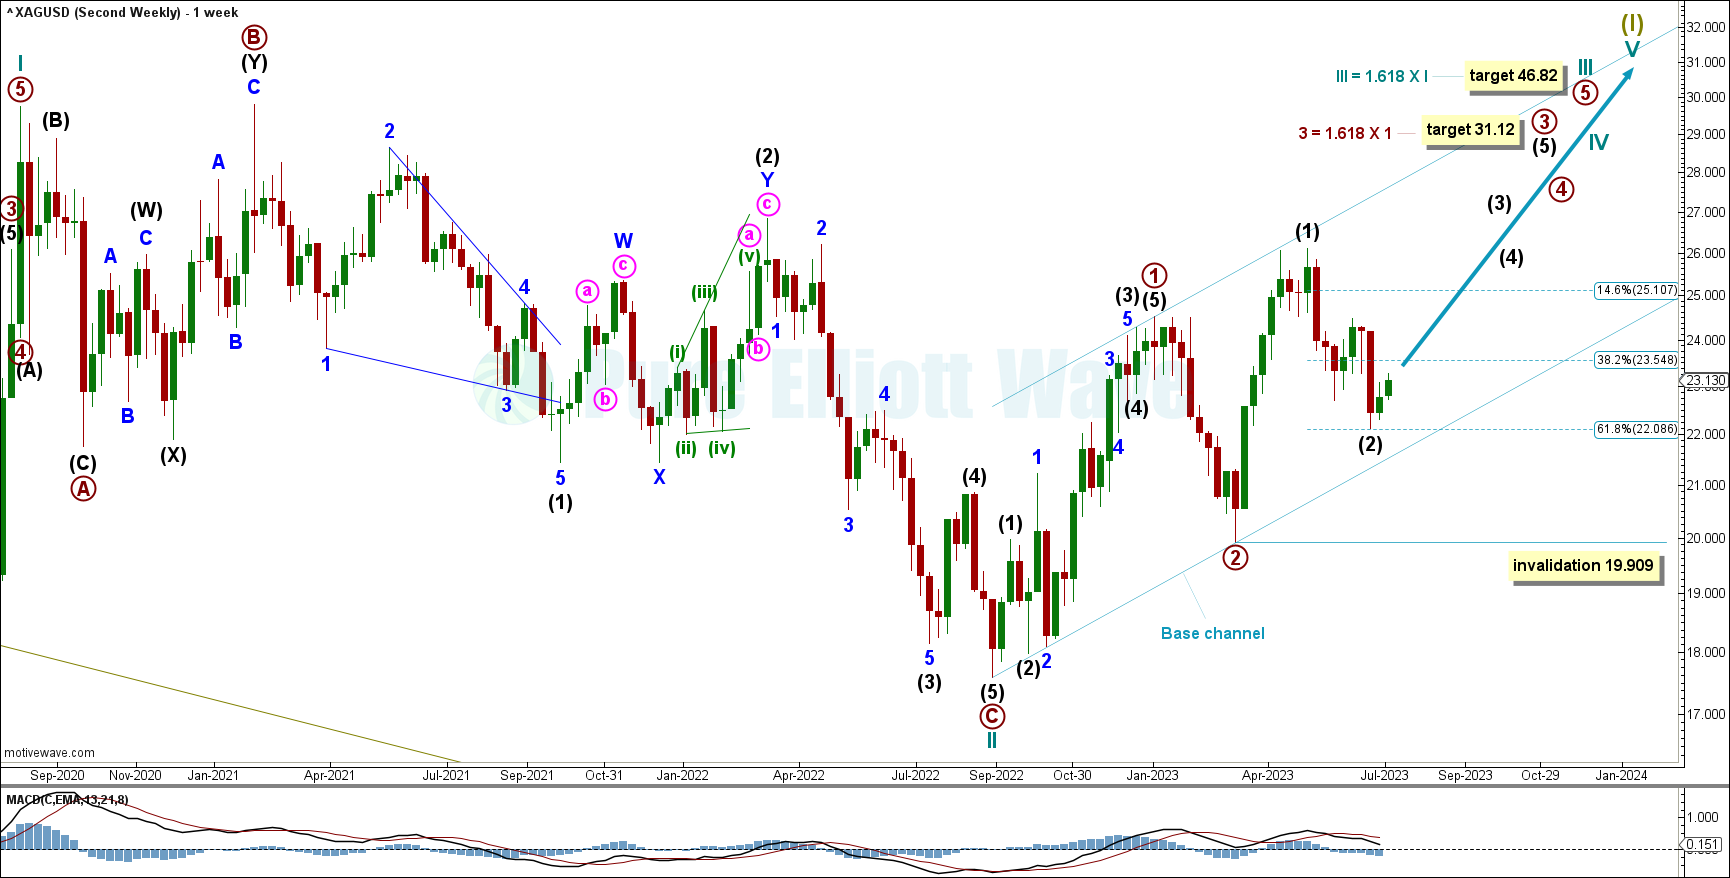
Within the new trend of Super Cycle wave (I), cycle waves I and II may be complete. Cycle wave II subdivides as a regular flat with an abnormally long primary wave C.
Cycle wave III may have begun. Cycle wave III may only subdivide as an impulse. Within the impulse, primary waves 1 and 2 may be complete. At 31.12 primary wave 3 would reach 1.618 the length of primary wave 1. Within primary wave 3, a second wave correction may not move below 19.909.
Draw a base channel about primary waves 1 and 2. Draw the first trend line from the start of primary wave 1 to the end of primary wave 2, then place a parallel copy on the end of primary wave 1. The lower edge of the base channel may show where deep corrections may find support. Primary wave 3 should have the power to break through resistance at the upper edge of the channel.
At 46.82 cycle wave III would reach 1.618 the length of cycle wave I. This target may be met in some years.
Within primary wave 3, intermediate wave (2) is expected to be complete at the last low, reaching the 0.618 fibonacci ratio of intermediate wave (1).
Price is expected to increase for third waves at intermediate and primary degrees. Primary wave 3 has a target calculated to reach 1.618 times the length of primary wave 1 at 31.12.
DAILY CHART
Click chart to enlarge.
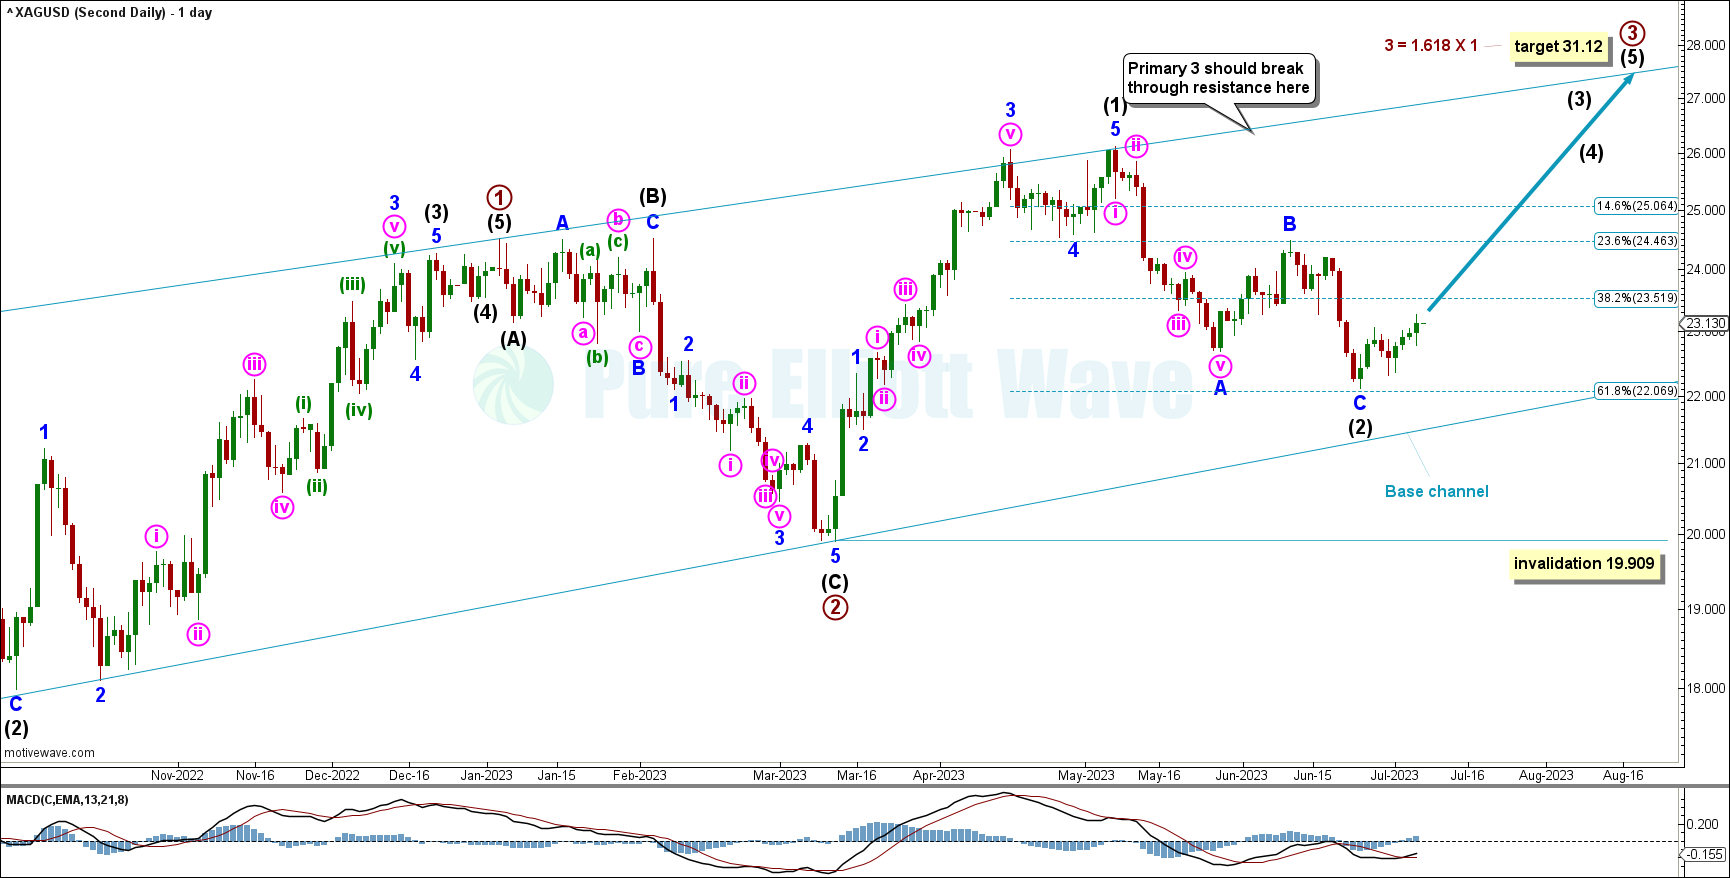
Intermediate wave (2) subdivides well as a complete zigzag; it reached the 0.618 fibonacci ratio perfectly. Within intermediate wave (2), minor wave C moved below the end of minor wave A, avoiding a truncation.
It is possible that intermediate wave (2) continues lower, finding support at the base channel. If that happens, then it may not move below the start of intermediate wave (1) at 19.909.
TECHNICAL ANALYSIS
MONTHLY CHART
Click chart to enlarge.
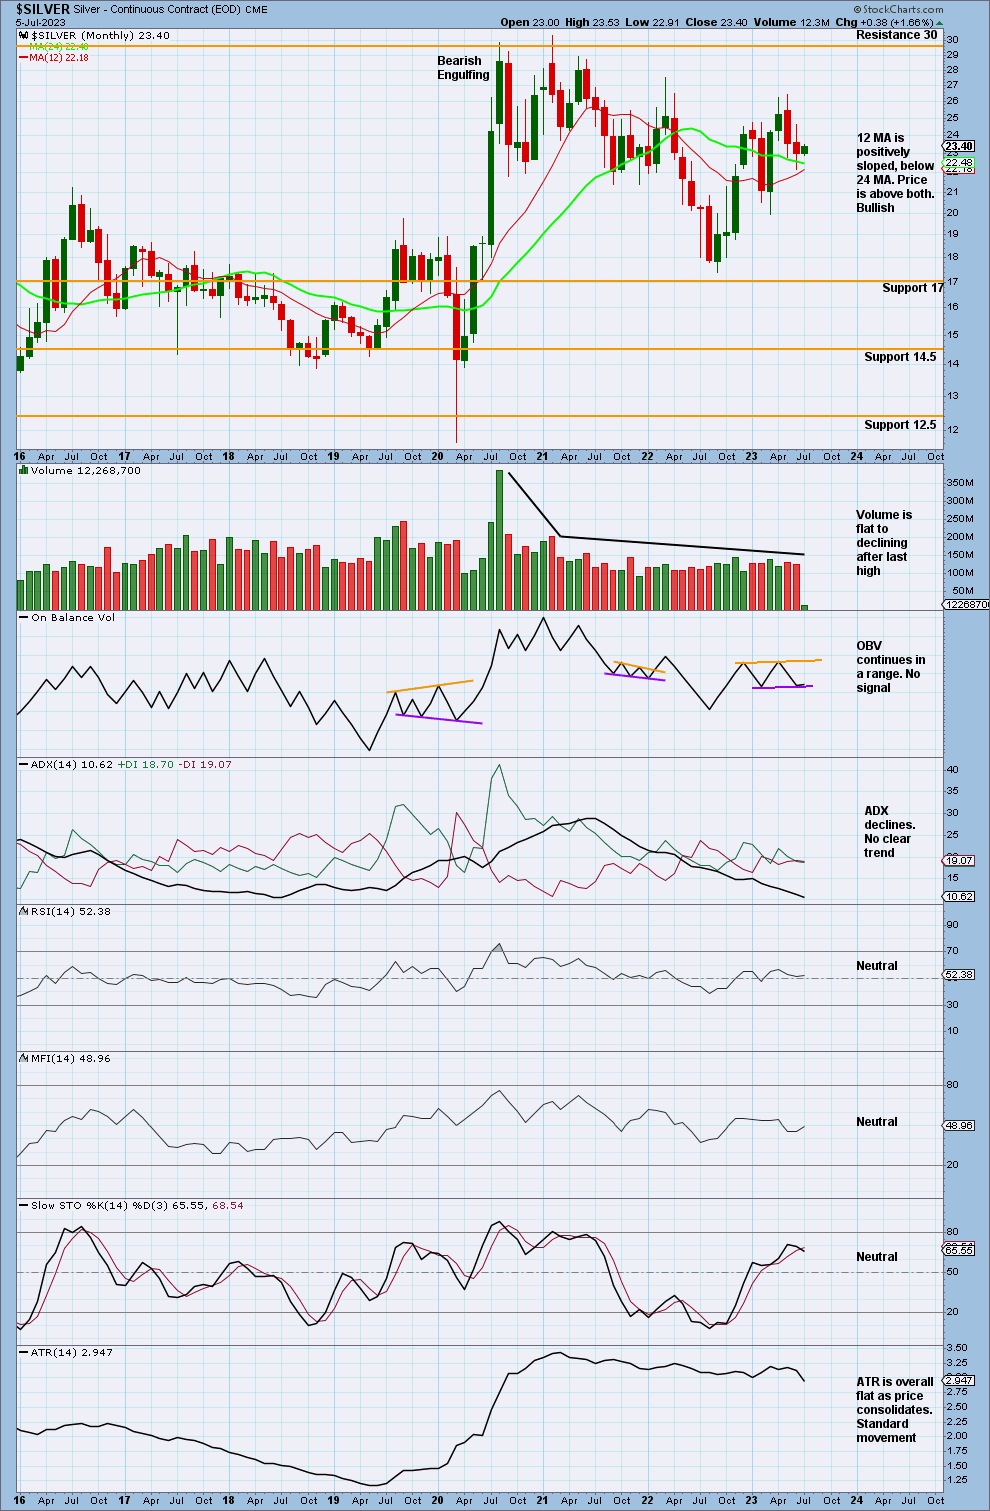
Price has consolidated after the last high, finding resistance at 30. Volume has also flattened with a slight downwards slope, which is standard for a consolidation. There will need to be a break above resistance at 30 or below support at 17 to mark the end of this consolidation.
ADX indicates no clear trend, so we use a model of Stochastics and support + resistance. If price reaches support or resistance when Stochastics is overbought/oversold, we can expect a breakout then.
Currently, price is not near support or resistance and Stochastics is neutral. The consolidation is expected to continue. Within the consolidation, an upwards swing may continue to resistance about 30.
WEEKLY CHART
Click chart to enlarge.
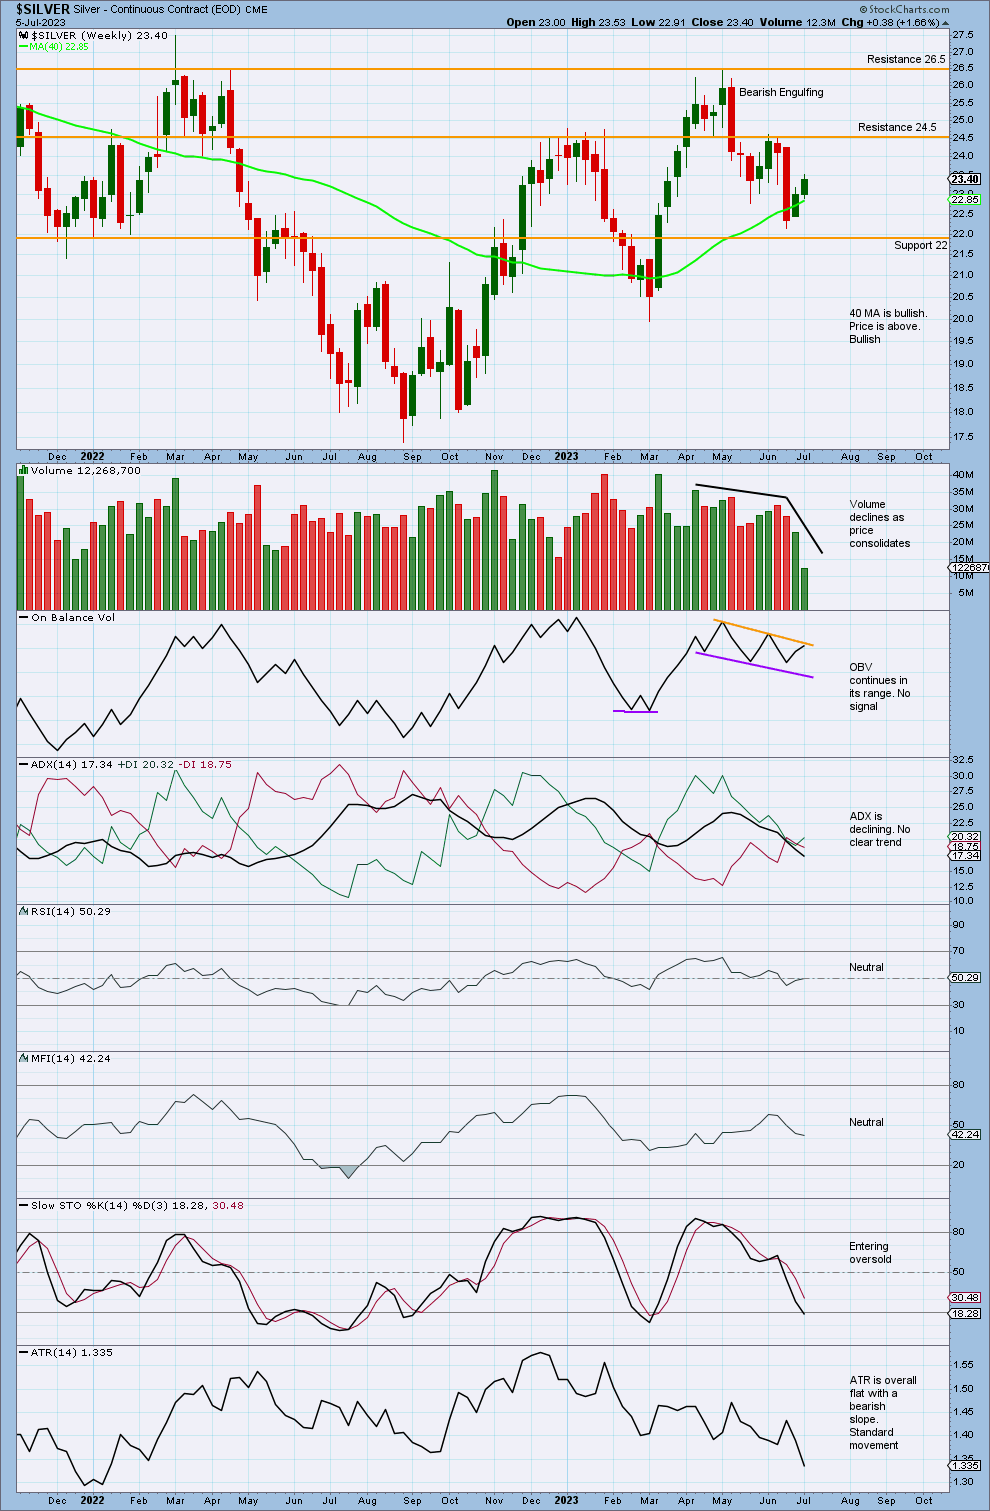
There is no clear trend currently.
Volume is strongest on downwards weeks and declines for the last two upwards weeks. The volume profile is bearish.
Price is expected to continue to fall.
DAILY CHART
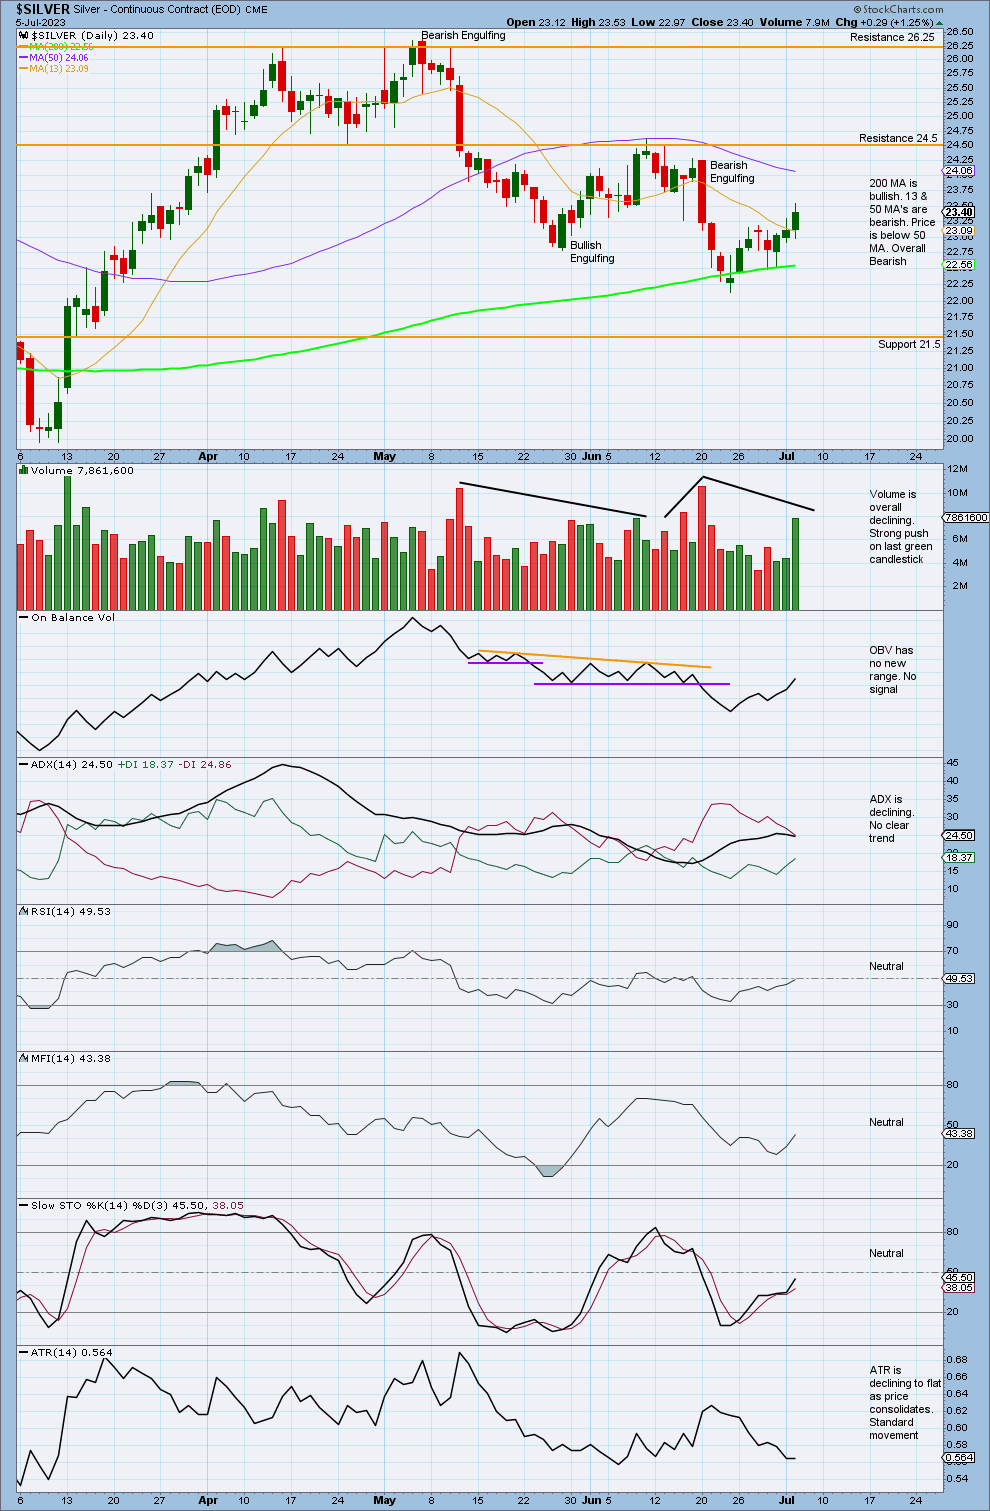
Click chart to enlarge.
There is no clear trend.
Price moves down with declining volume after finding resistance at 24.5.
There is a push from volume on some bearish candlesticks, indicating strength in bearish movement.
A Bearish Engulfing pattern after a short bullish movement indicates more strength in bearish movements.
Both volume and range declined as price moved higher to the last high in early May. This supports the first Elliott wave count and not the second. For the second Elliott wave count, a third wave up should not come with weak volume and declining range.
Published @ 07:54 p.m. ET.
—
Careful risk management protects your trading account(s).
Follow my two Golden Rules:
1. Invest only funds you can afford to lose.
2. Have an exit strategy for both directions; when to take profit and when to exit a losing investment.
—
New updates to this analysis are in bold.
—
 Save as PDF