November 9, 2023: Natural Gas Elliott Wave and Technical Analysis – Video and Charts
Summary: Price moves up with increasing bullish momentum as the Elliott wave count expects.
ELLIOTT WAVE COUNT
MONTHLY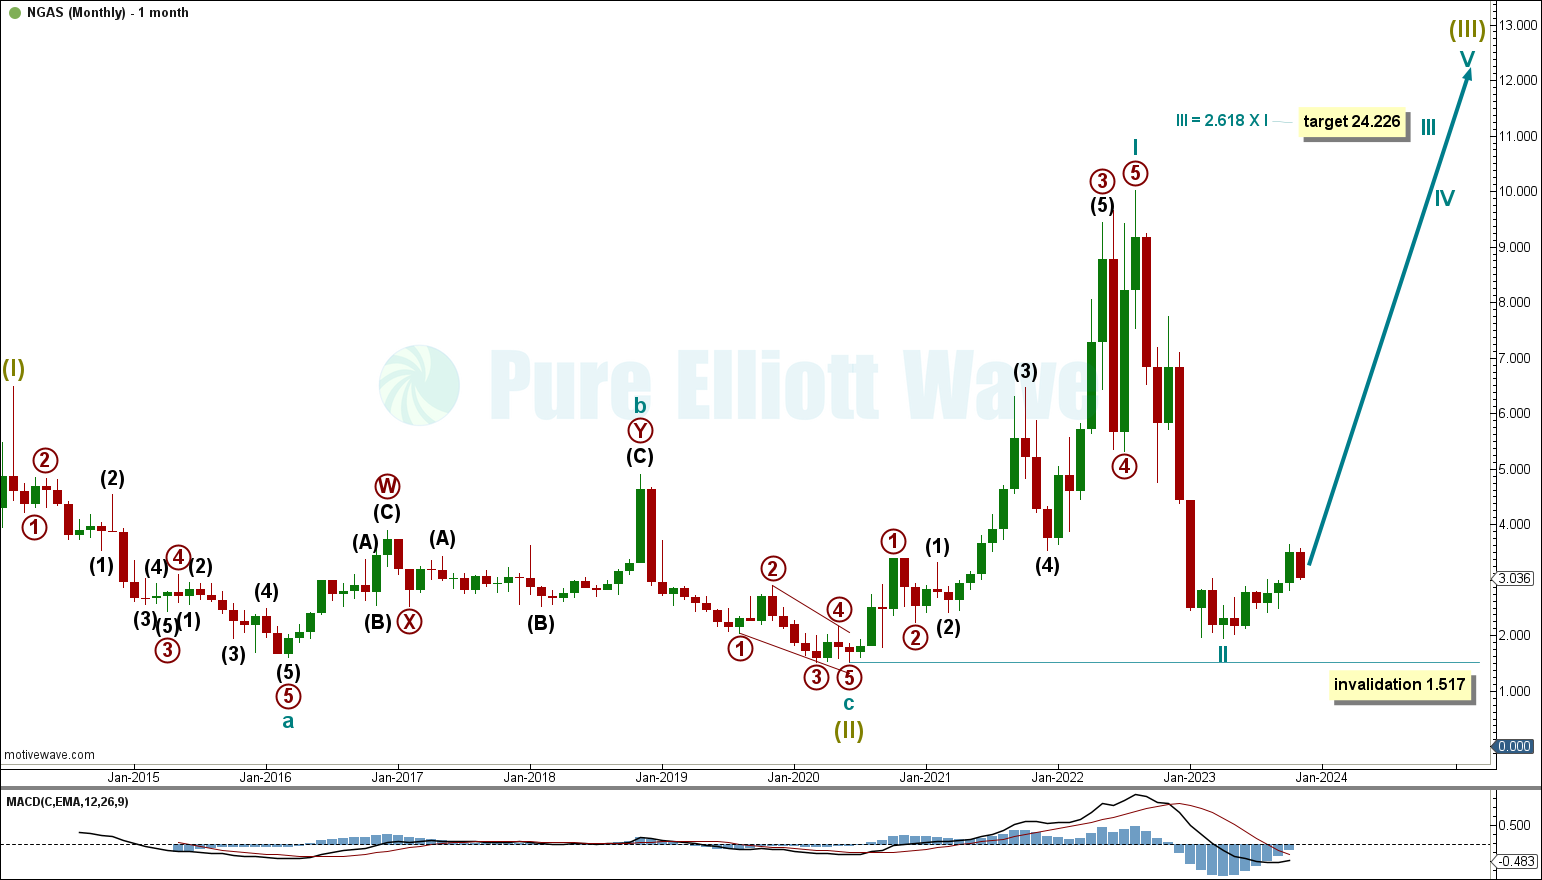
Click chart to enlarge.
Price has begun to increase for cycle wave III within supercycle wave (III).
Cycle wave II is labelled complete at the low for April 1, 2023. Price is now steadily increasing.
If cycle wave II continues, then it cannot move below the start of cycle wave I at 1.517.
WEEKLY
Click chart to enlarge.
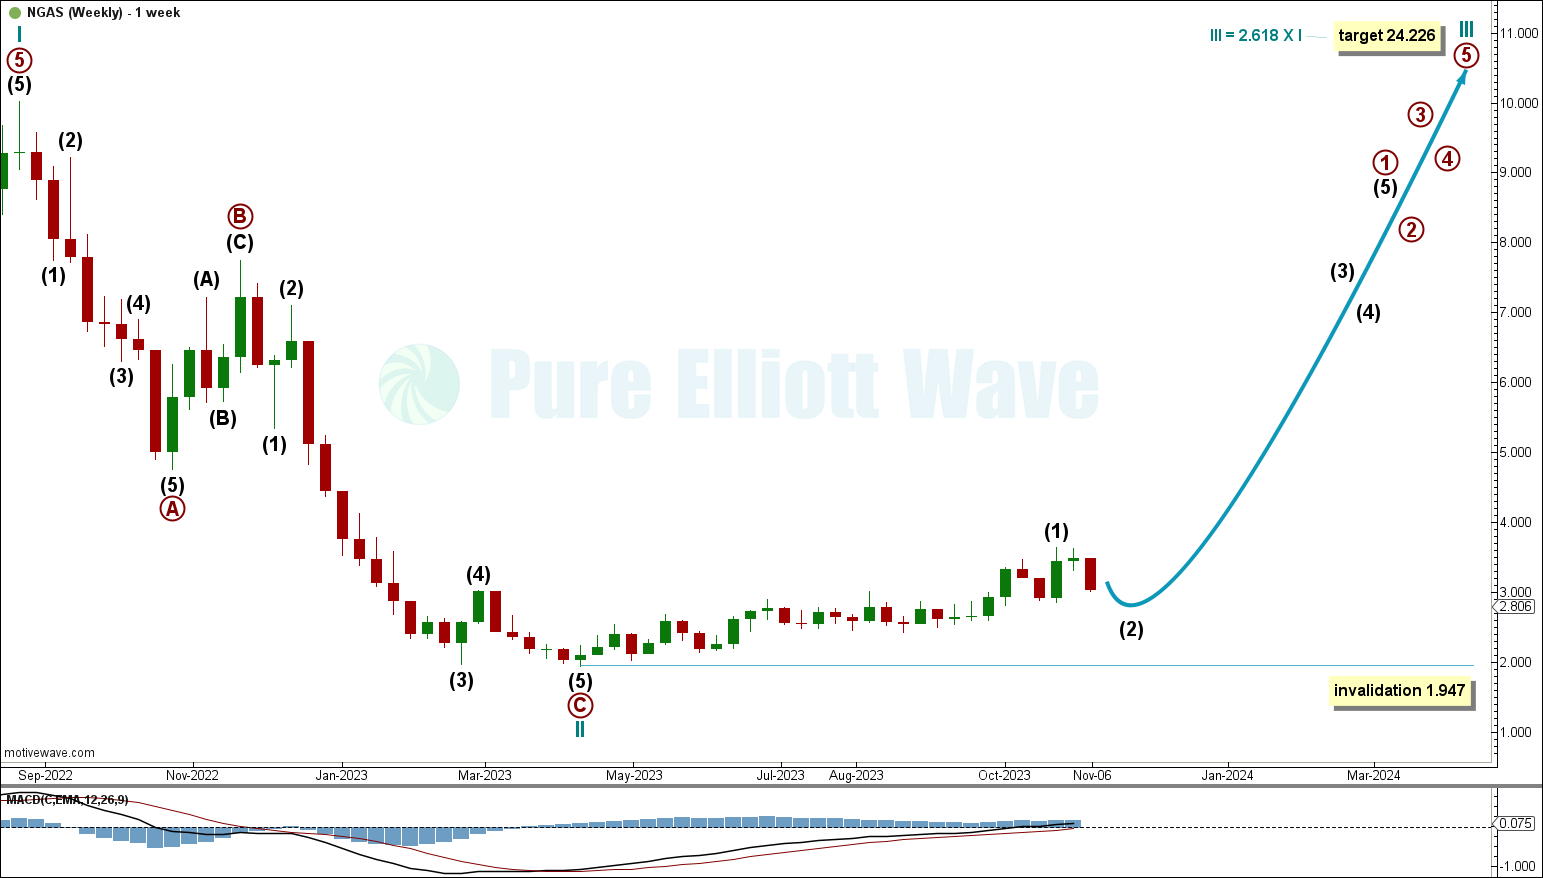
Price has increased for intermediate wave (1) within primary wave 1.
A pullback is expected for intermediate wave (2). Intermediate wave (2) may not move beyond the start of intermediate wave (1) below 1.947.
Cycle wave III has a target calculated to reach 2.618 times the length of cycle wave I at 24.226.
DAILY
Click chart to enlarge.
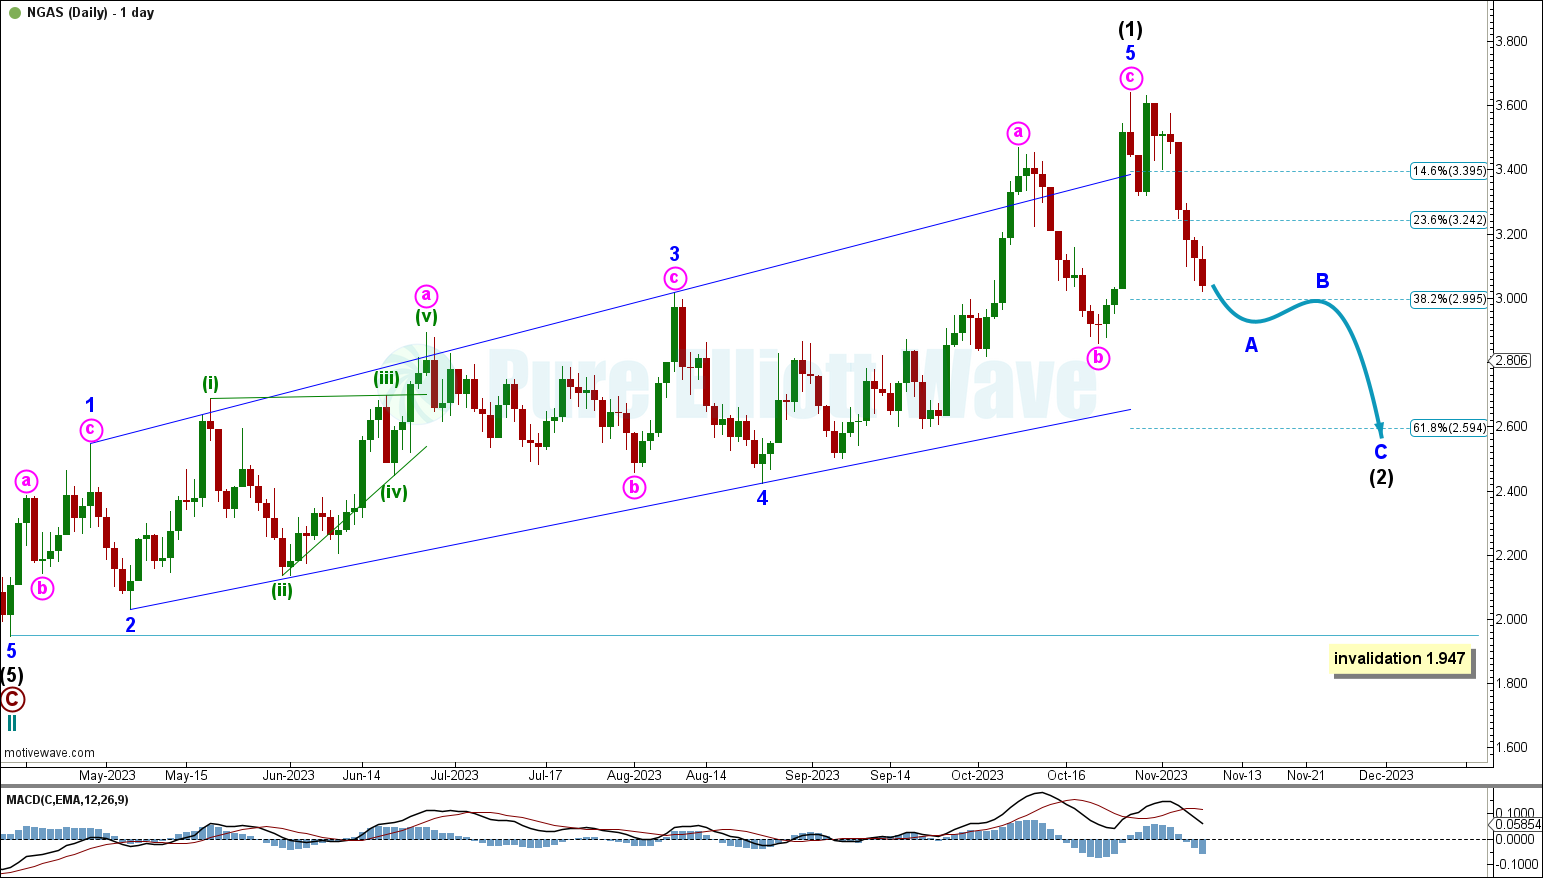
Intermediate wave (1) is labelled complete at the October 26th high. Intermediate wave (1) subdivides well as a complete leading expanding diagonal.
Price has began to decline for intermediate wave (2). Intermediate wave (2) currently has not developed enough to label any minor degree complete. It is currently labelled a single correction, though the structure may have to be relabelled as it unfolds.
Intermediate wave (2) may not move beyond the start of intermediate wave (1) at 1.947.
Intermediate wave (2) has a target calculated to reach 2.594, the 0.618 Fibonacci ratio of intermediate wave (1).
TECHNICAL ANALYSIS
MONTHLY
Click chart to enlarge.
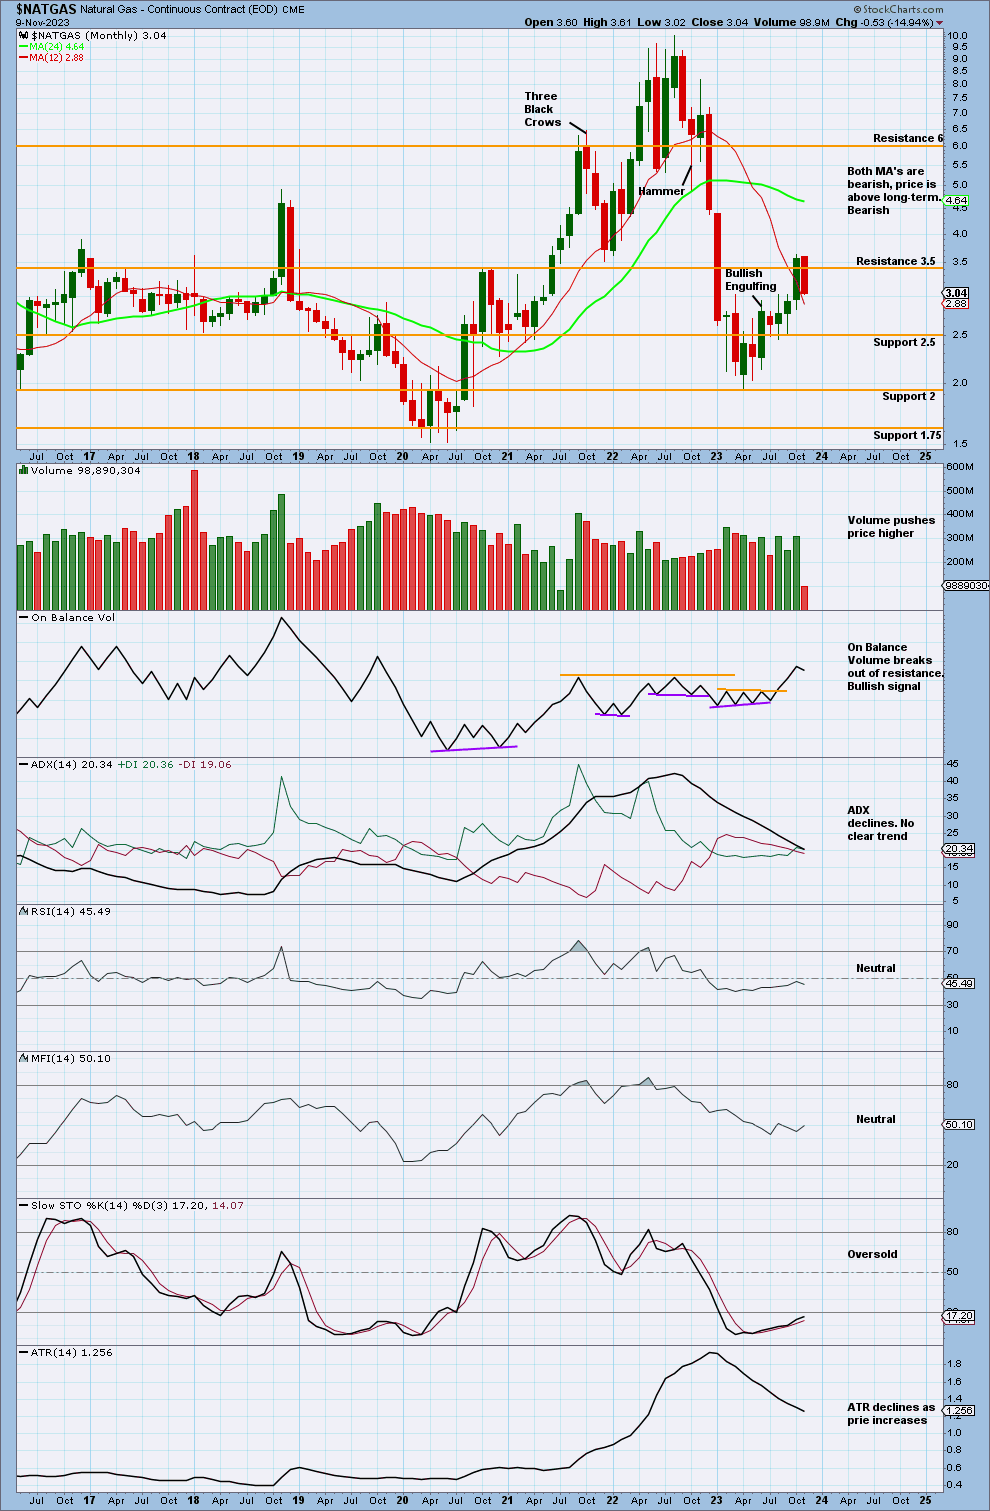
Price has declined, finding resistance at 3.5.
ADX declines and Stochastics has remained oversold for the past few months. A model using Stochastics plus support and resistance would expect overall an upwards swing to continue until price reaches resistance and Stochastics reaches overbought.
On Balance Volume previously broke out of resistance, giving a bullish signal.
WEEKLY
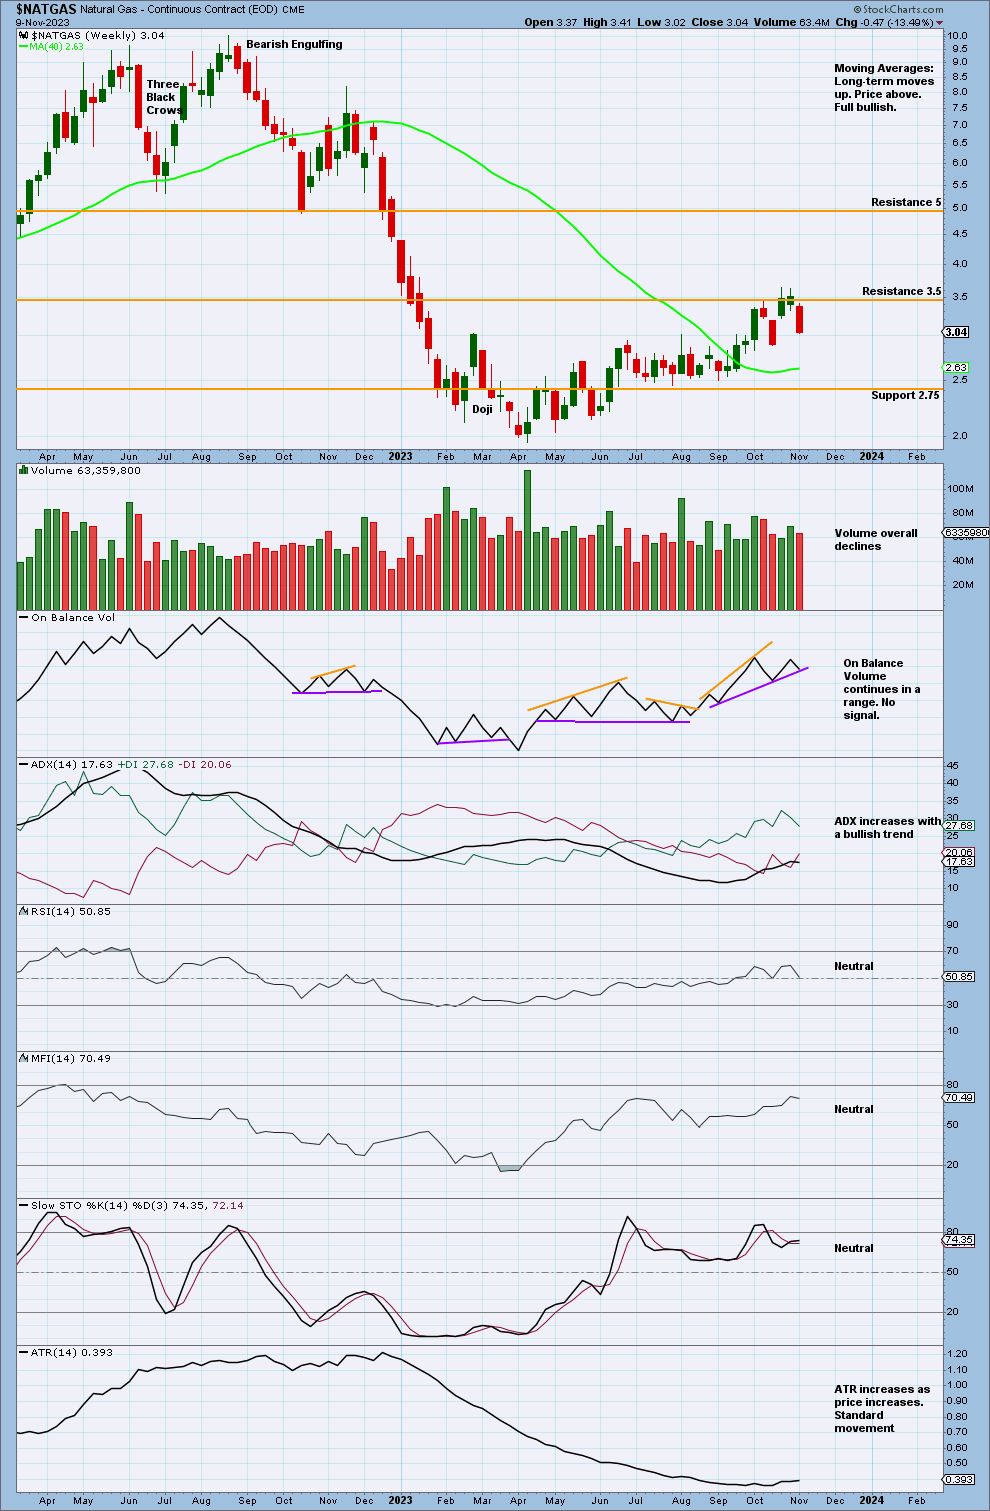
Click chart to enlarge.
Price declines away from resistance at 3.5.
There was a push from volume when price found resistance, though volume overall declines.
The volume profile remains bullish, with stronger volume on bullish candlesticks.
DAILY
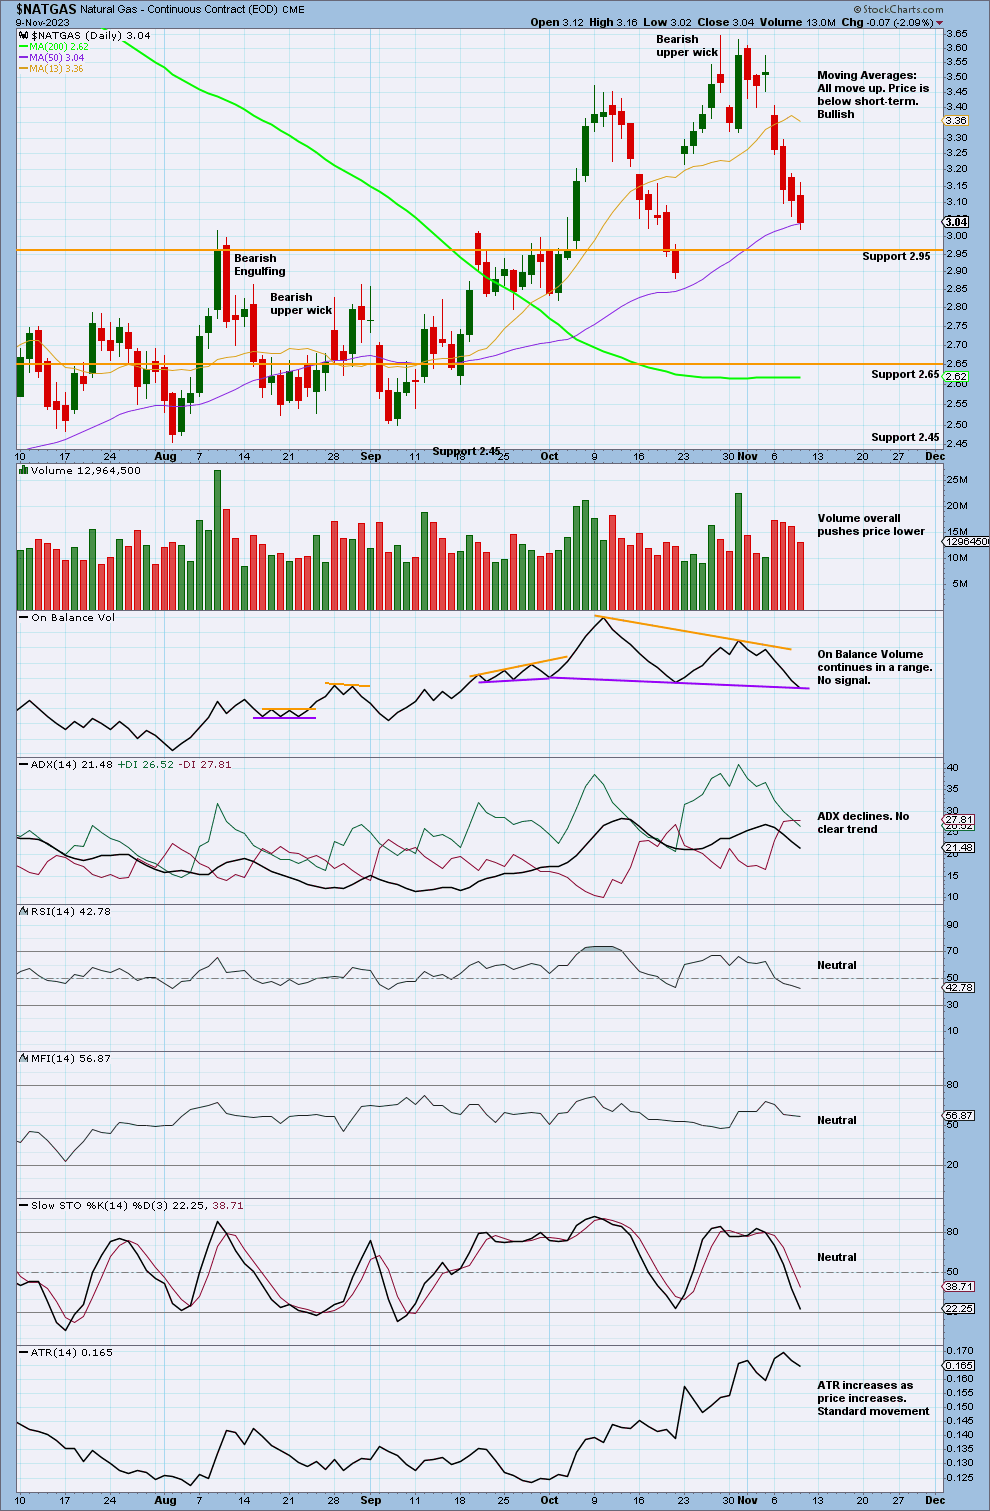
Click chart to enlarge.
Price declines, nearing support at 2.65.
Volume steadily declines as price falls although overall volume remains relatively heavy.
Stochastics nears oversold as price nears support at 2.65. The downwards swing may end at support around 2.65.
Published @ 11:36 p.m. ET.
—
Careful risk management protects your trading account(s).
Follow my two Golden Rules:
1. Always trade with stops.
2. Risk only 1-5% of equity on any one trade.
—
New updates to this analysis are in bold.
—
 Save as PDF