December 3, 2025: SILVER Elliott Wave and Technical Analysis – Charts
Summary: Last analysis of Silver on October 9, 2024, expected upwards movement.
Silver continues to move higher as the Elliott Wave count expects.
A target is calculated at 64.88.
Monthly charts are updated in this analysis.
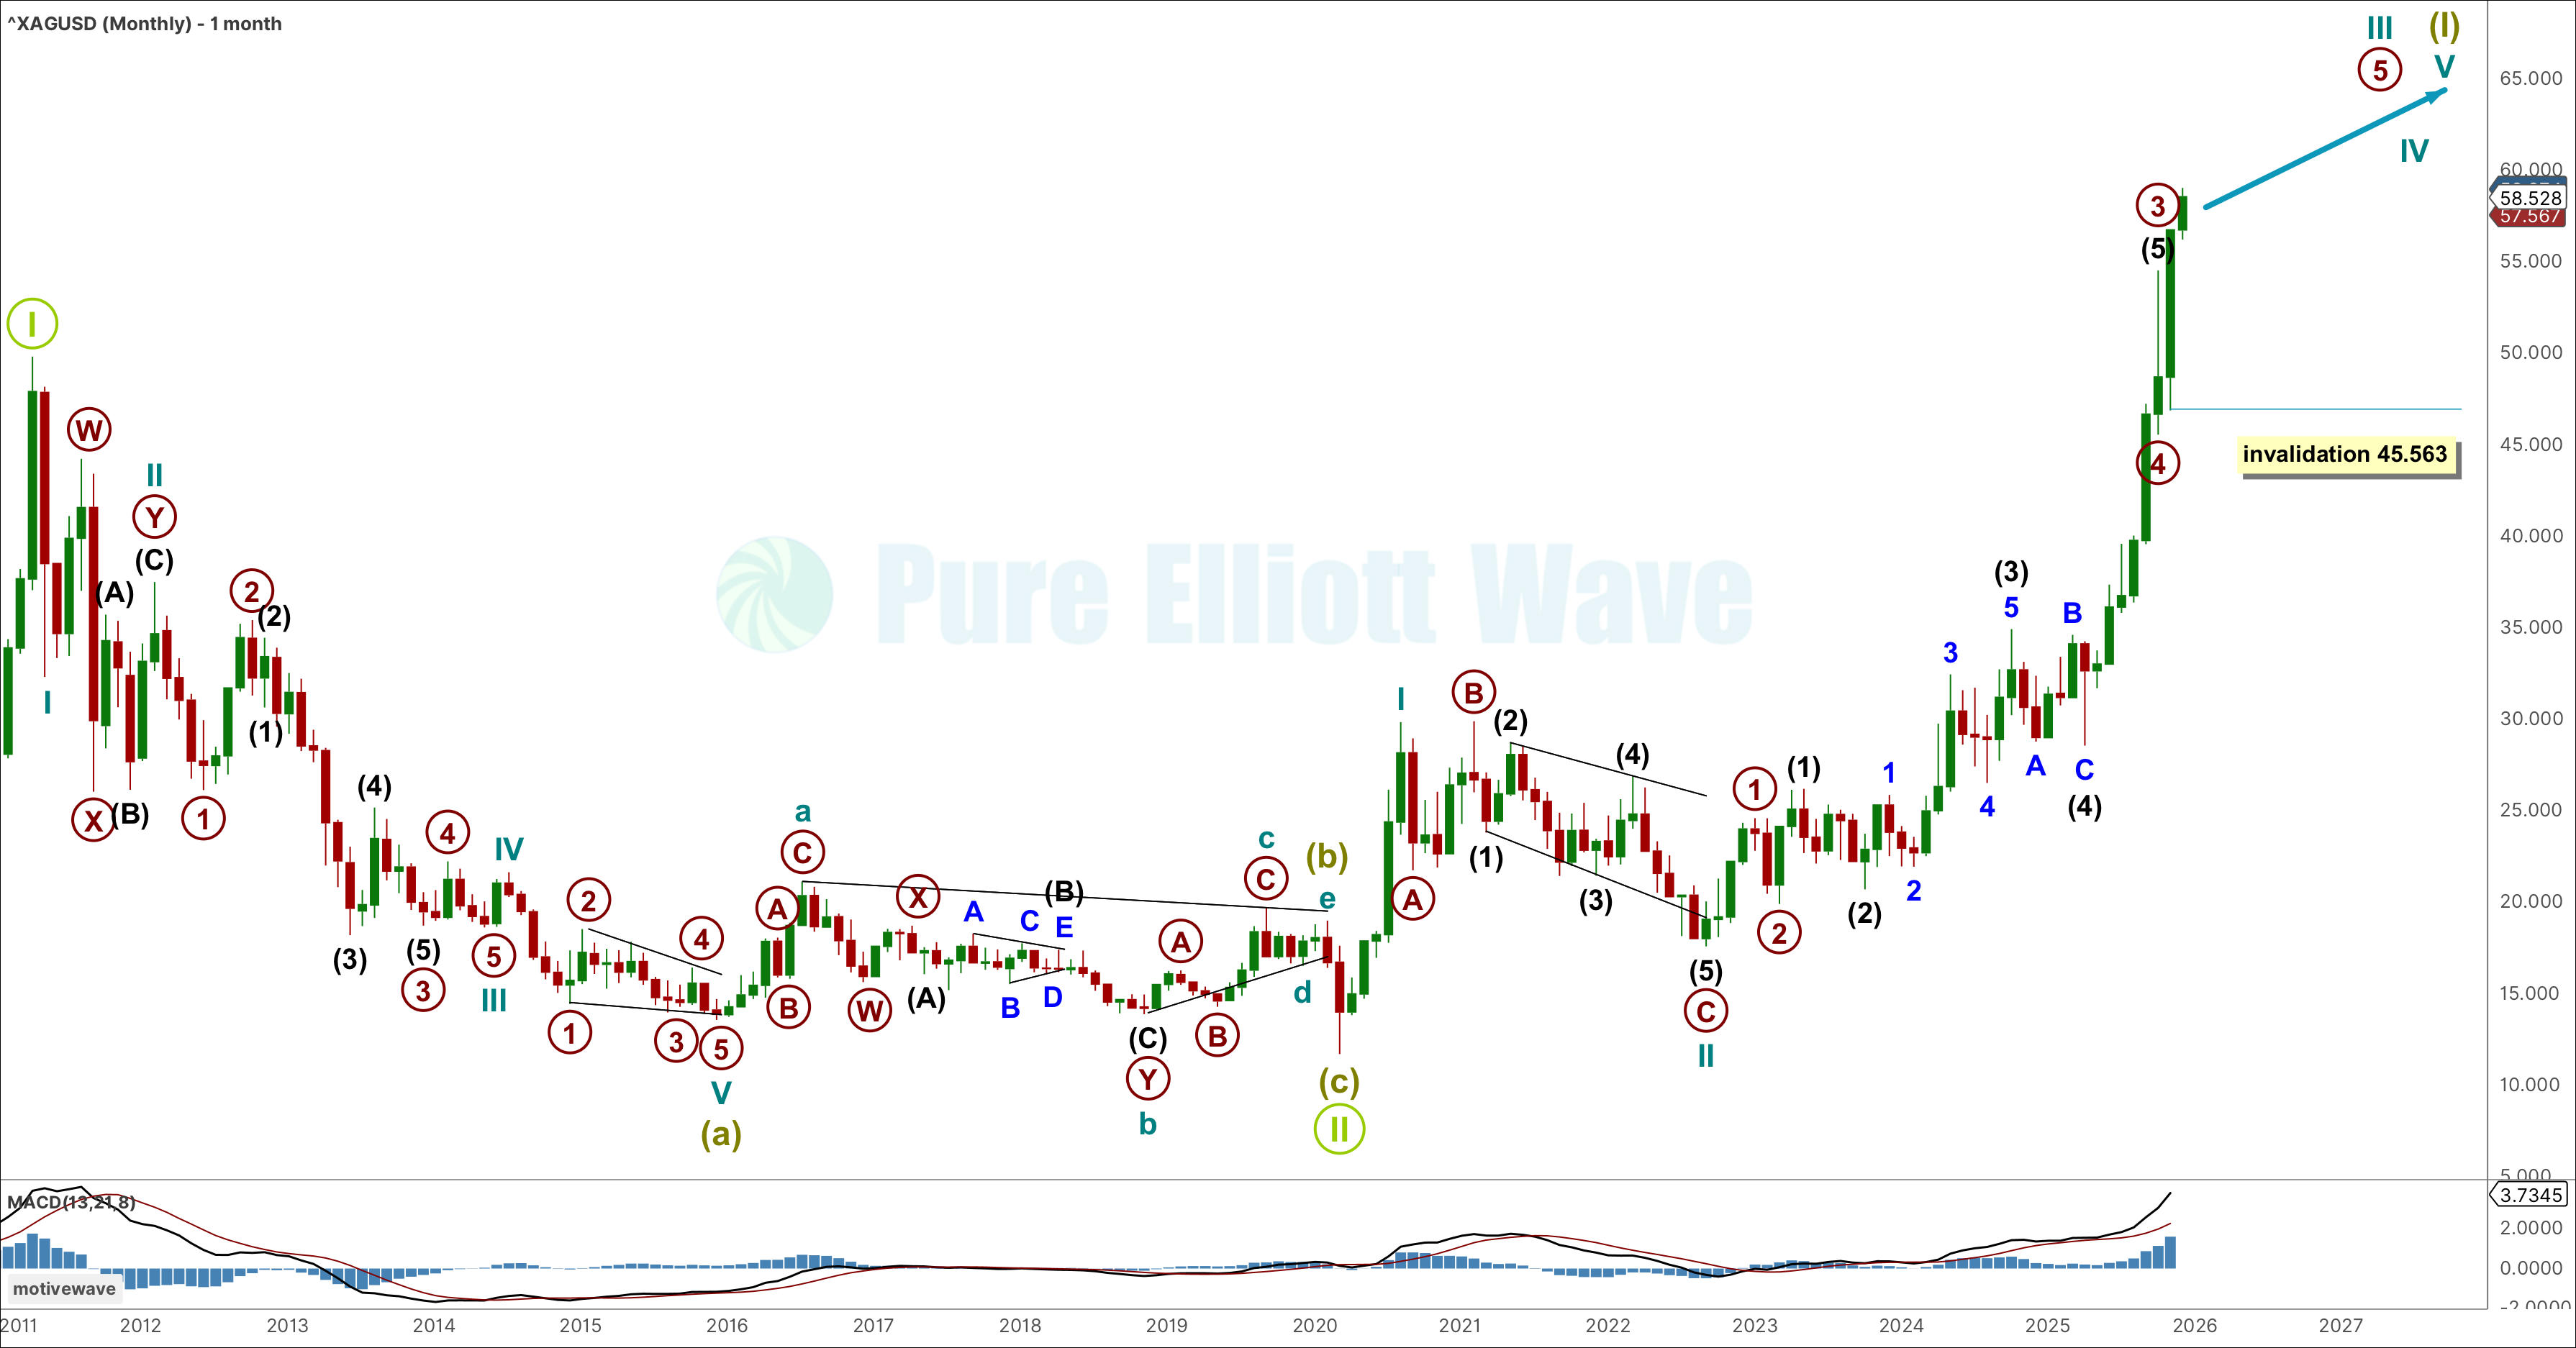
BULLISH ELLIOTT WAVE COUNT
MONTHLY CHART
Click chart to enlarge.
This wave count previously expected upwards movement to continue for overlapping third waves, particularly at primary and cycle degree. Upwards movement has since continued with increasing range.
Primary waves 3 and 4 are now labelled complete, with the final stages of cycle wave III to move higher, for primary wave 5.
Within primary wave 5 moving higher, any second wave corrective movement cannot move below its start at 45.563.
WEEKLY CHART
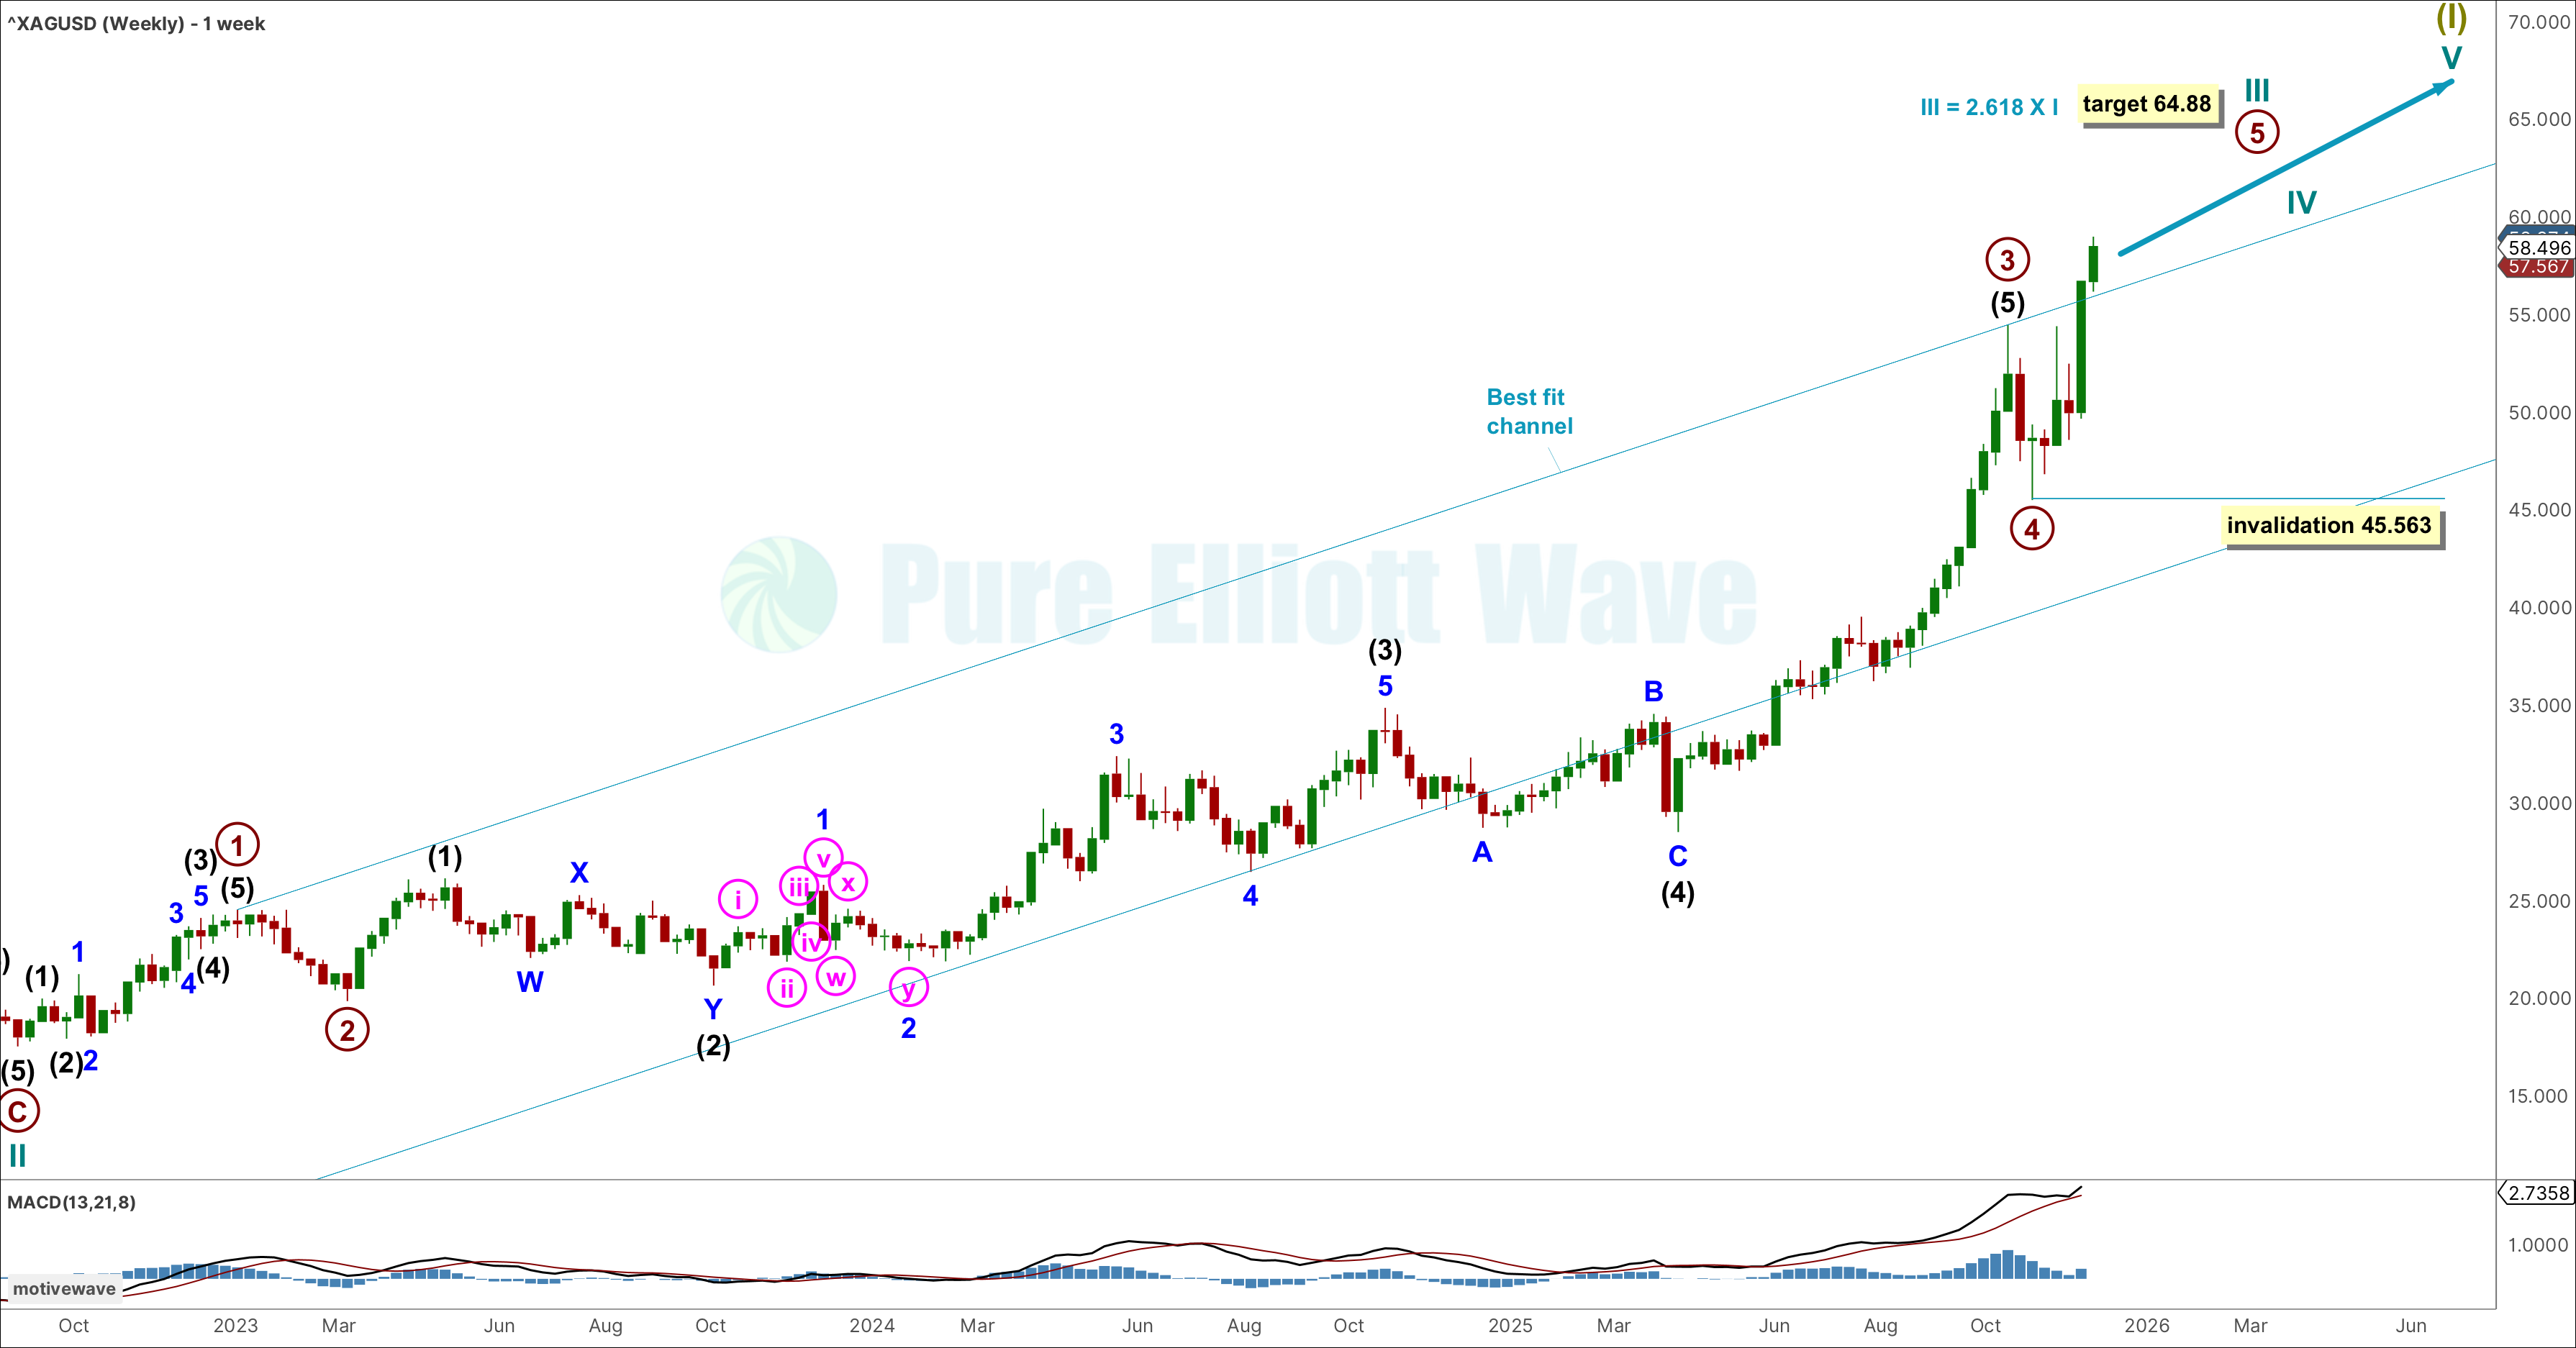
Click chart to enlarge.
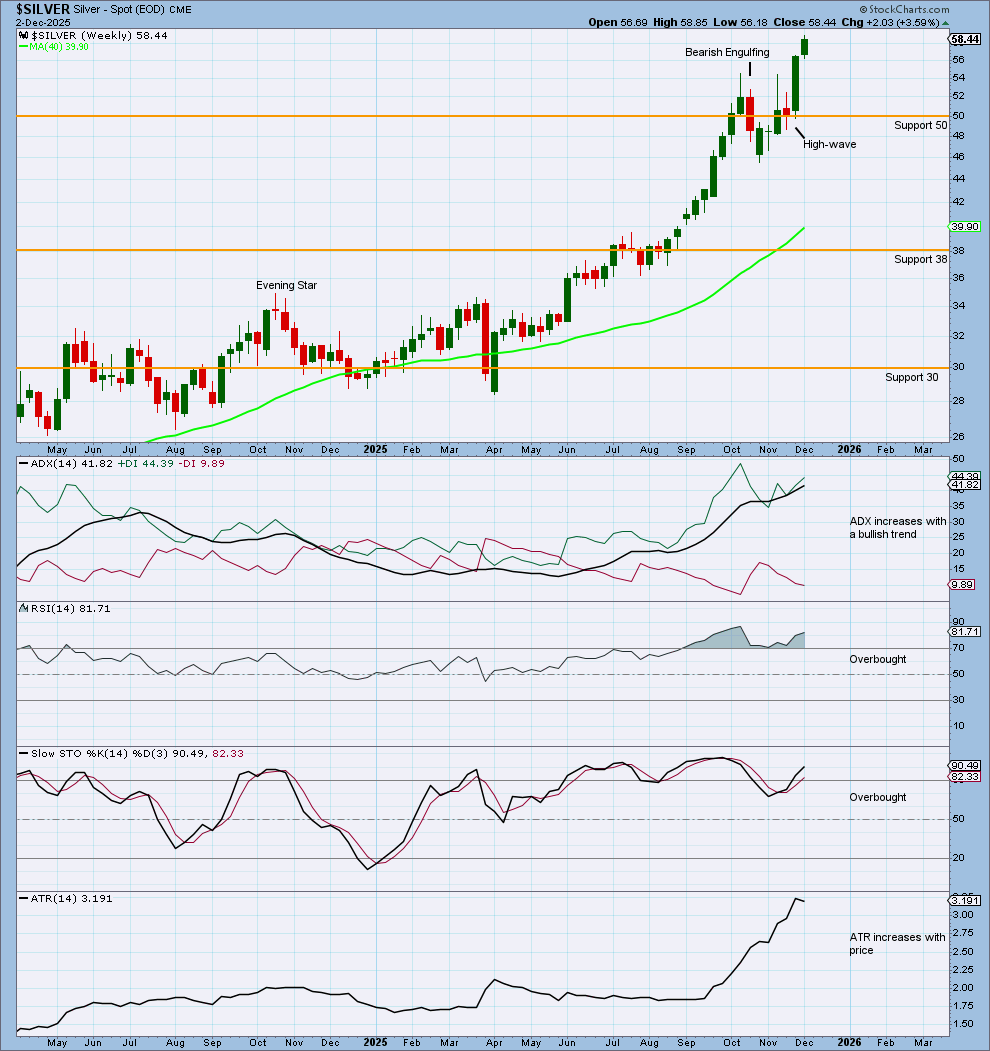
Within the trend of Supercycle wave (I), cycle wave III overall pulls price higher. Cycle wave III may be within its final stages.
The prior target for cycle wave III (calculated at 46.82) has been overshot, while the structure remains incomplete. A higher target has been calculated for cycle wave III at 64.88. This target is calculated using the 2.618 Fibonacci ratio of cycle wave I.
A best fit channel is drawn around the upwards movement for cycle wave III. Price has broken above the channel for the latest weekly candlestick, however price may find support/resistance around the upper edge of the channel.
An eventual break below the best fit channel with a full red candlestick below and not touching, may indicate cycle wave III may be over at that point.
DAILY CHART
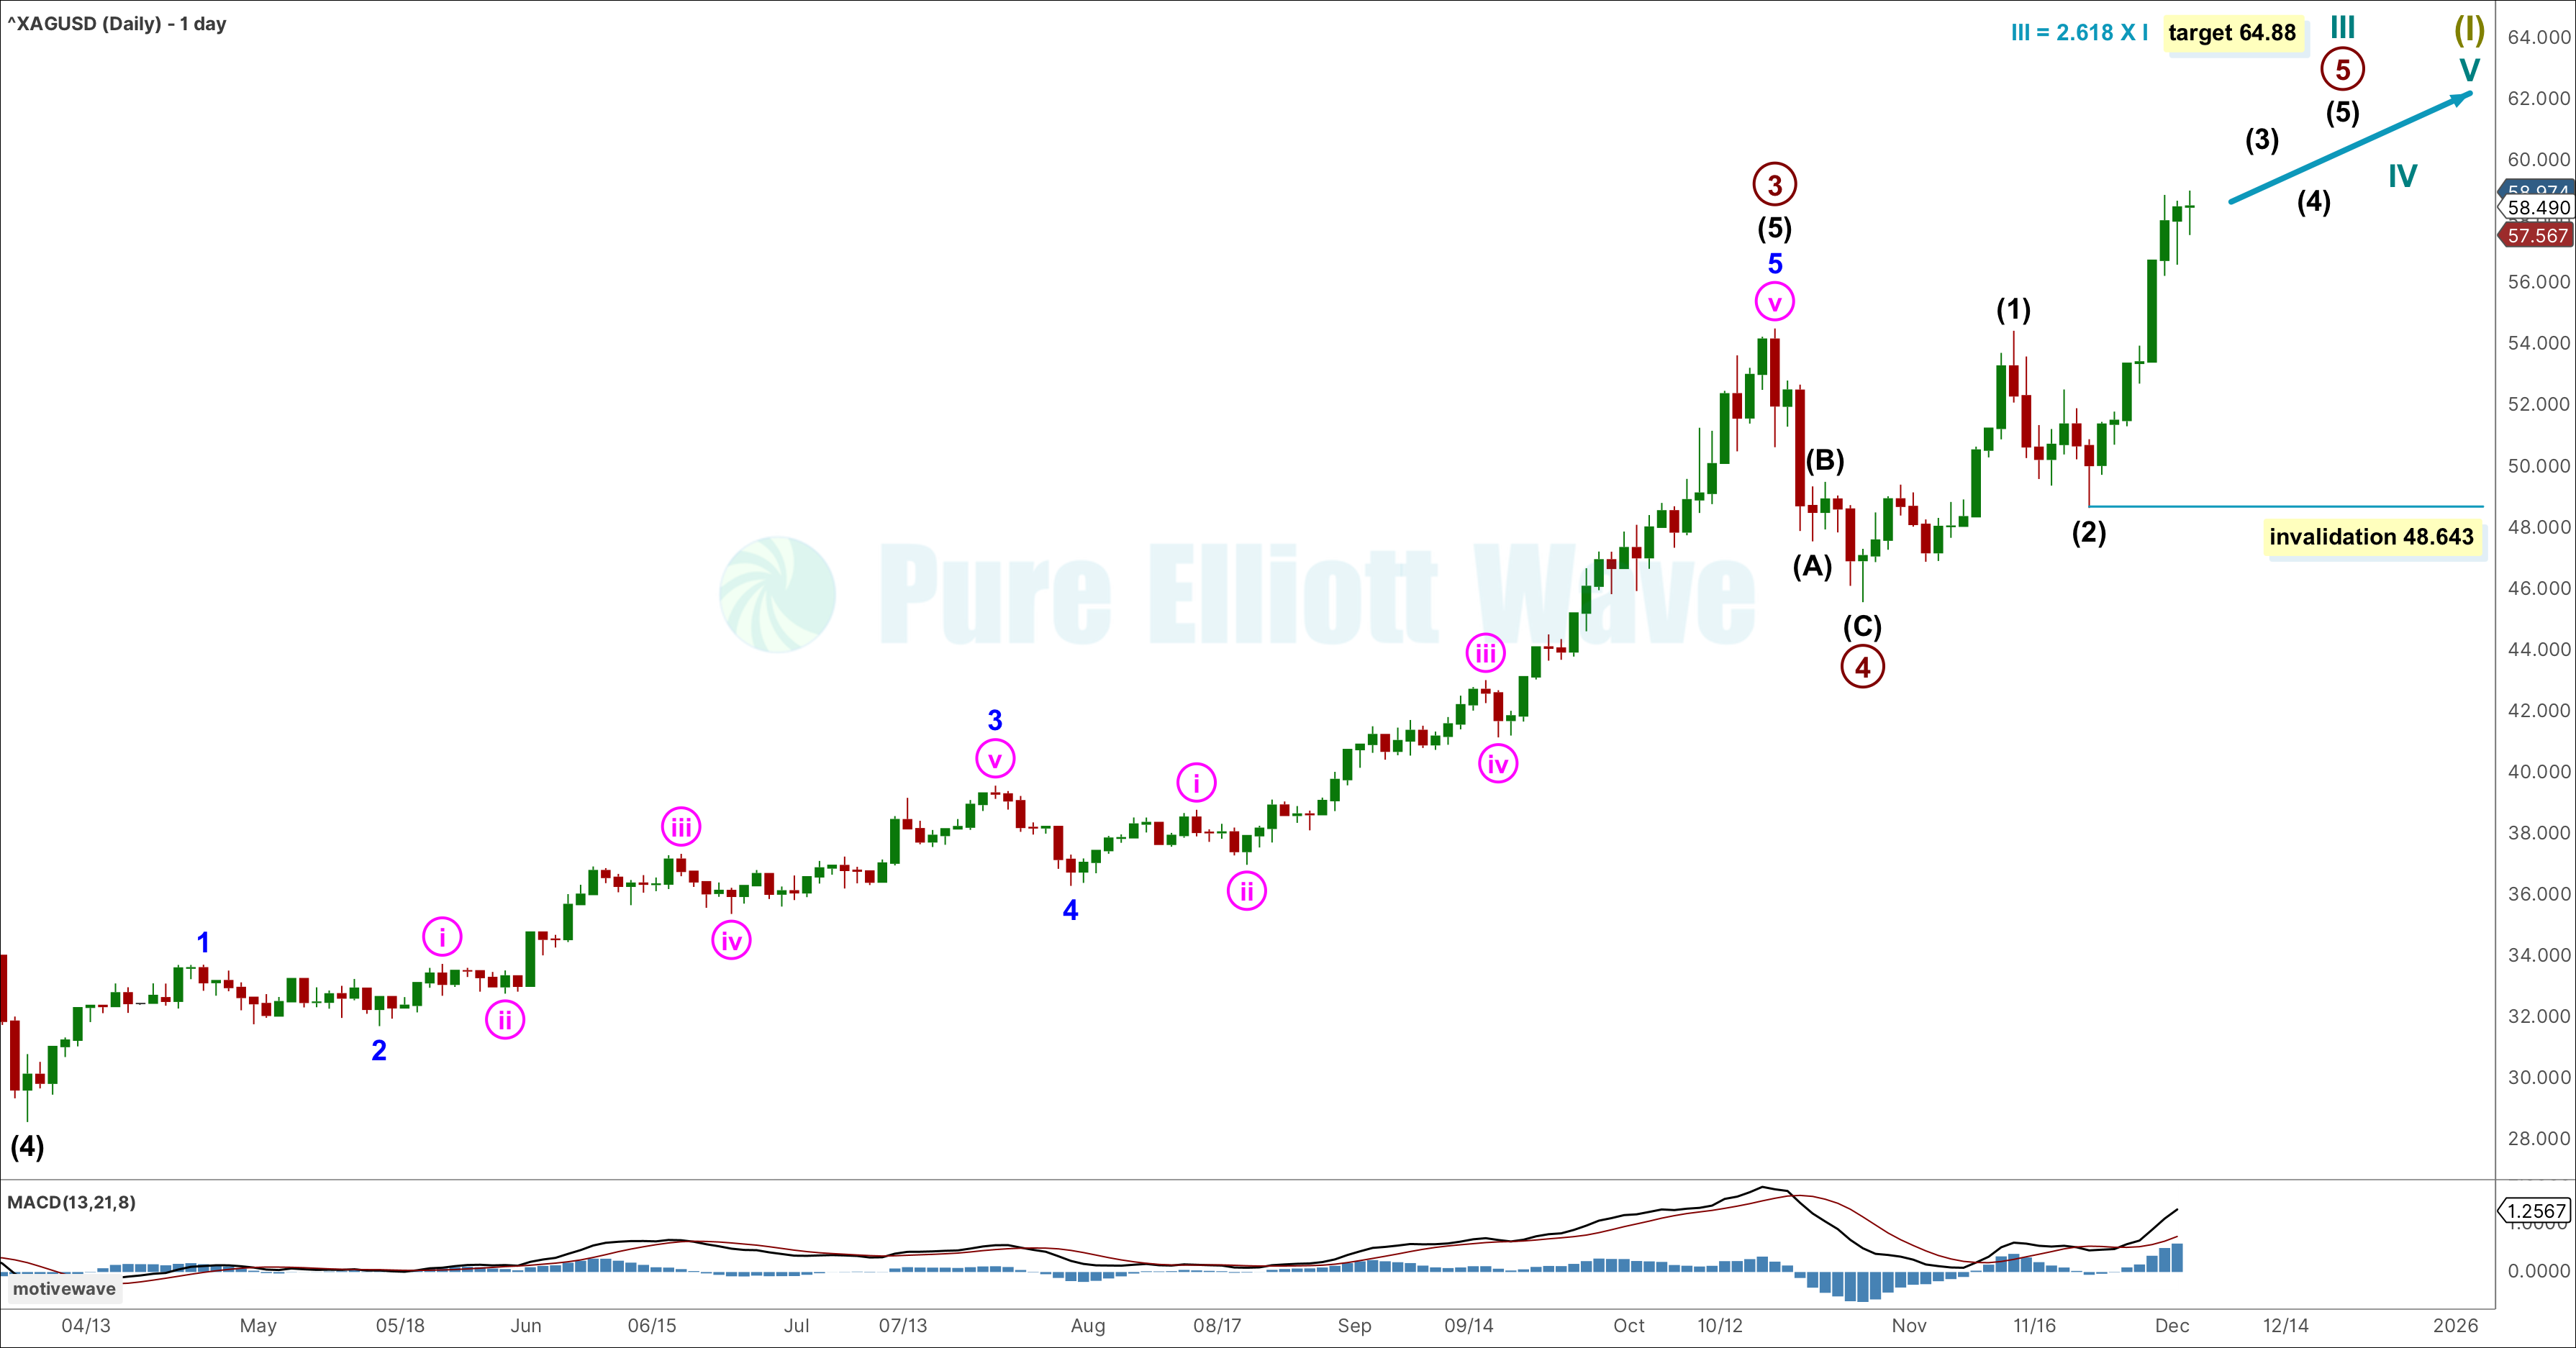
Click chart to enlarge.
As primary wave 5 moves higher, it is expected to be within its middle stages, moving higher for intermediate wave (3).
Within intermediate wave (3), any second wave corrective movement cannot move below its start at 48.643.
Intermediate wave (3) can only subdivide as an impulse and should come with an increase in range and momentum.
TECHNICAL ANALYSIS
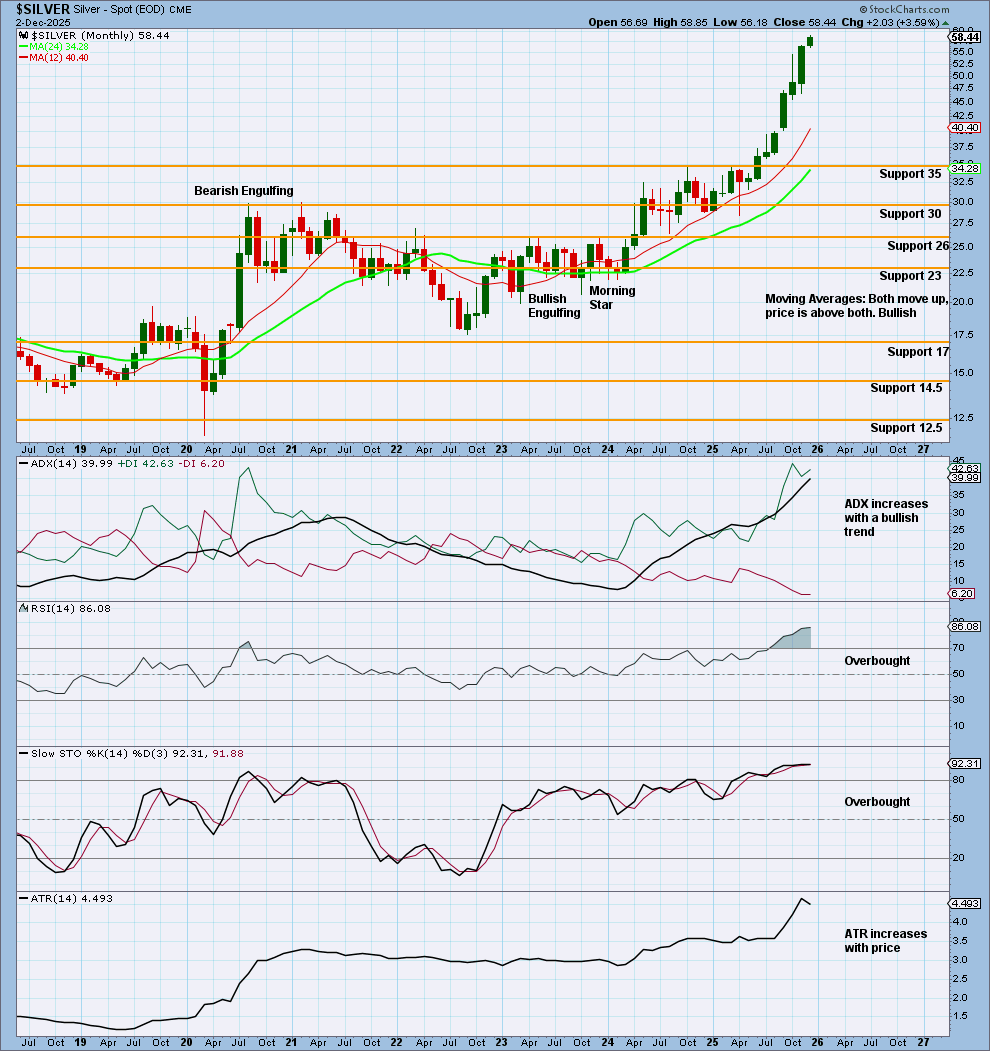
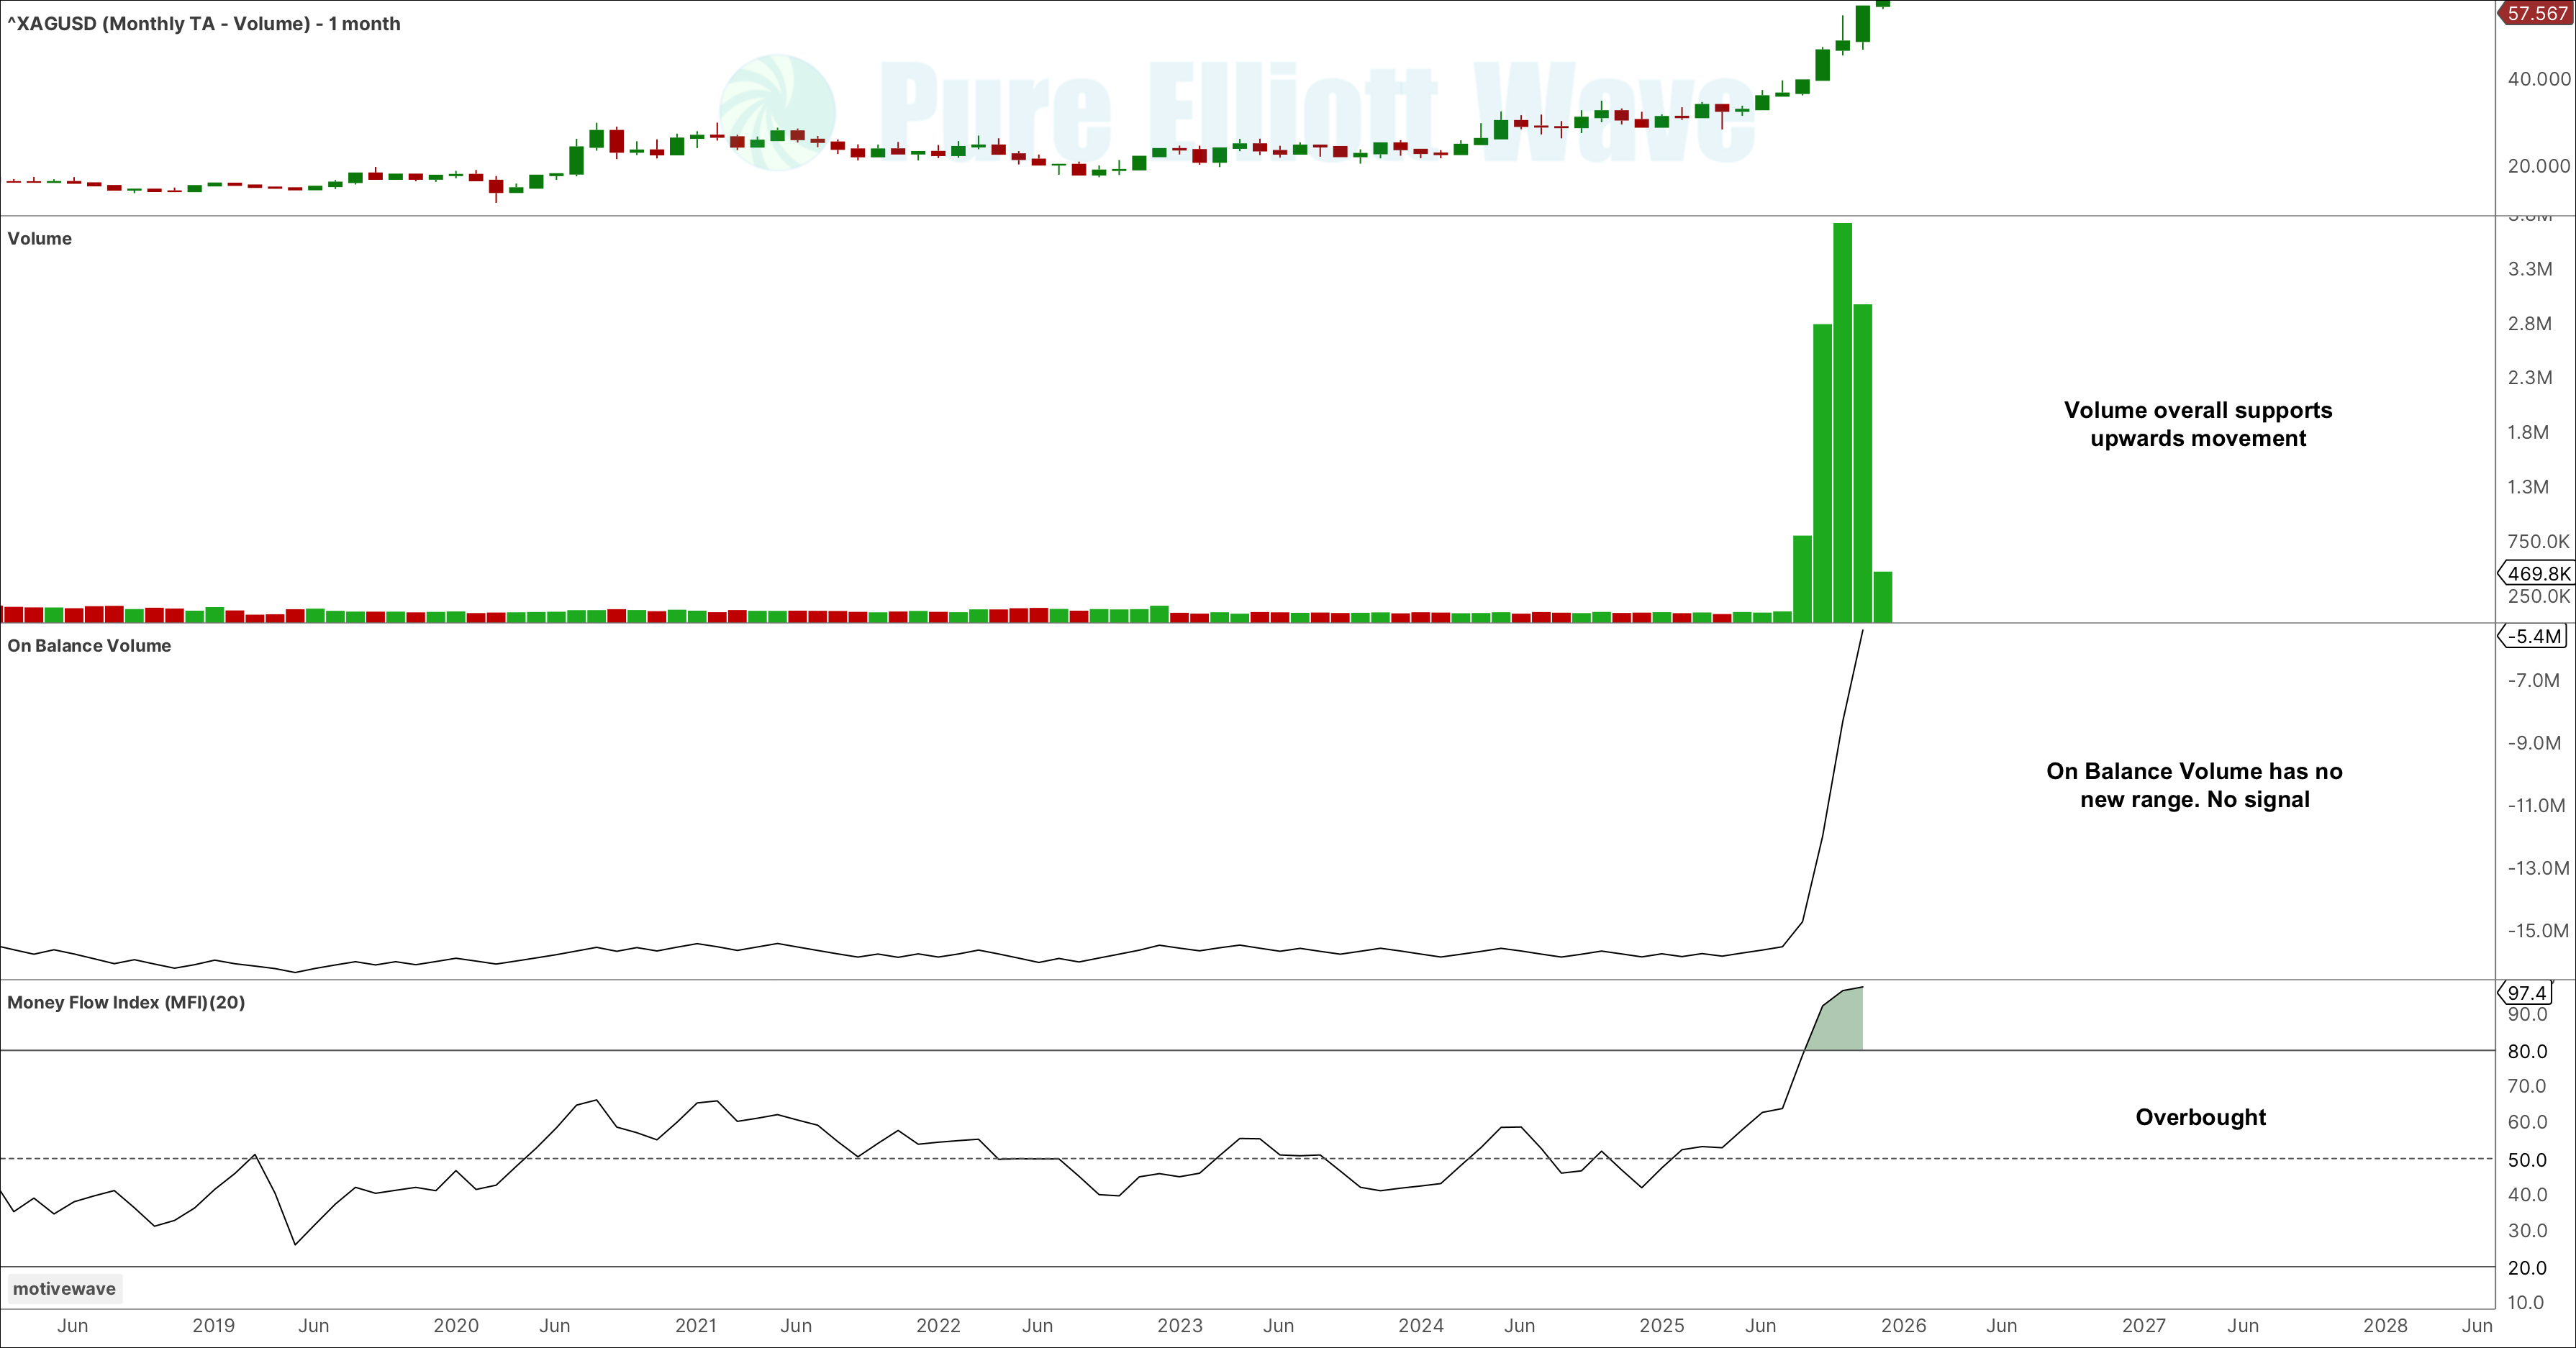
MONTHLY CHART
Click chart to enlarge.
Click chart to enlarge.
Price has continued higher, surpassing all prior resistance.
A change in our volume data source makes it look like a very strong increase in volume data for the last few months. However, this is not the case and is only a discrepancy within the data.
An increase in volume previously shows strongest volume on bullish months. However, strongest volume within these months (as shown below) was on bearish weeks and sessions.
ADX increases with a bullish trend that is not yet extreme. This trend has continued from a low point and below both DX lines, supporting the Elliott Wave count.
The trend indicated by ADX may reach extreme or very extreme conditions, while RSI and Money Flow Index may exhibit divergence before the trend may be in danger of ending.
This data supports the Elliott Wave count.
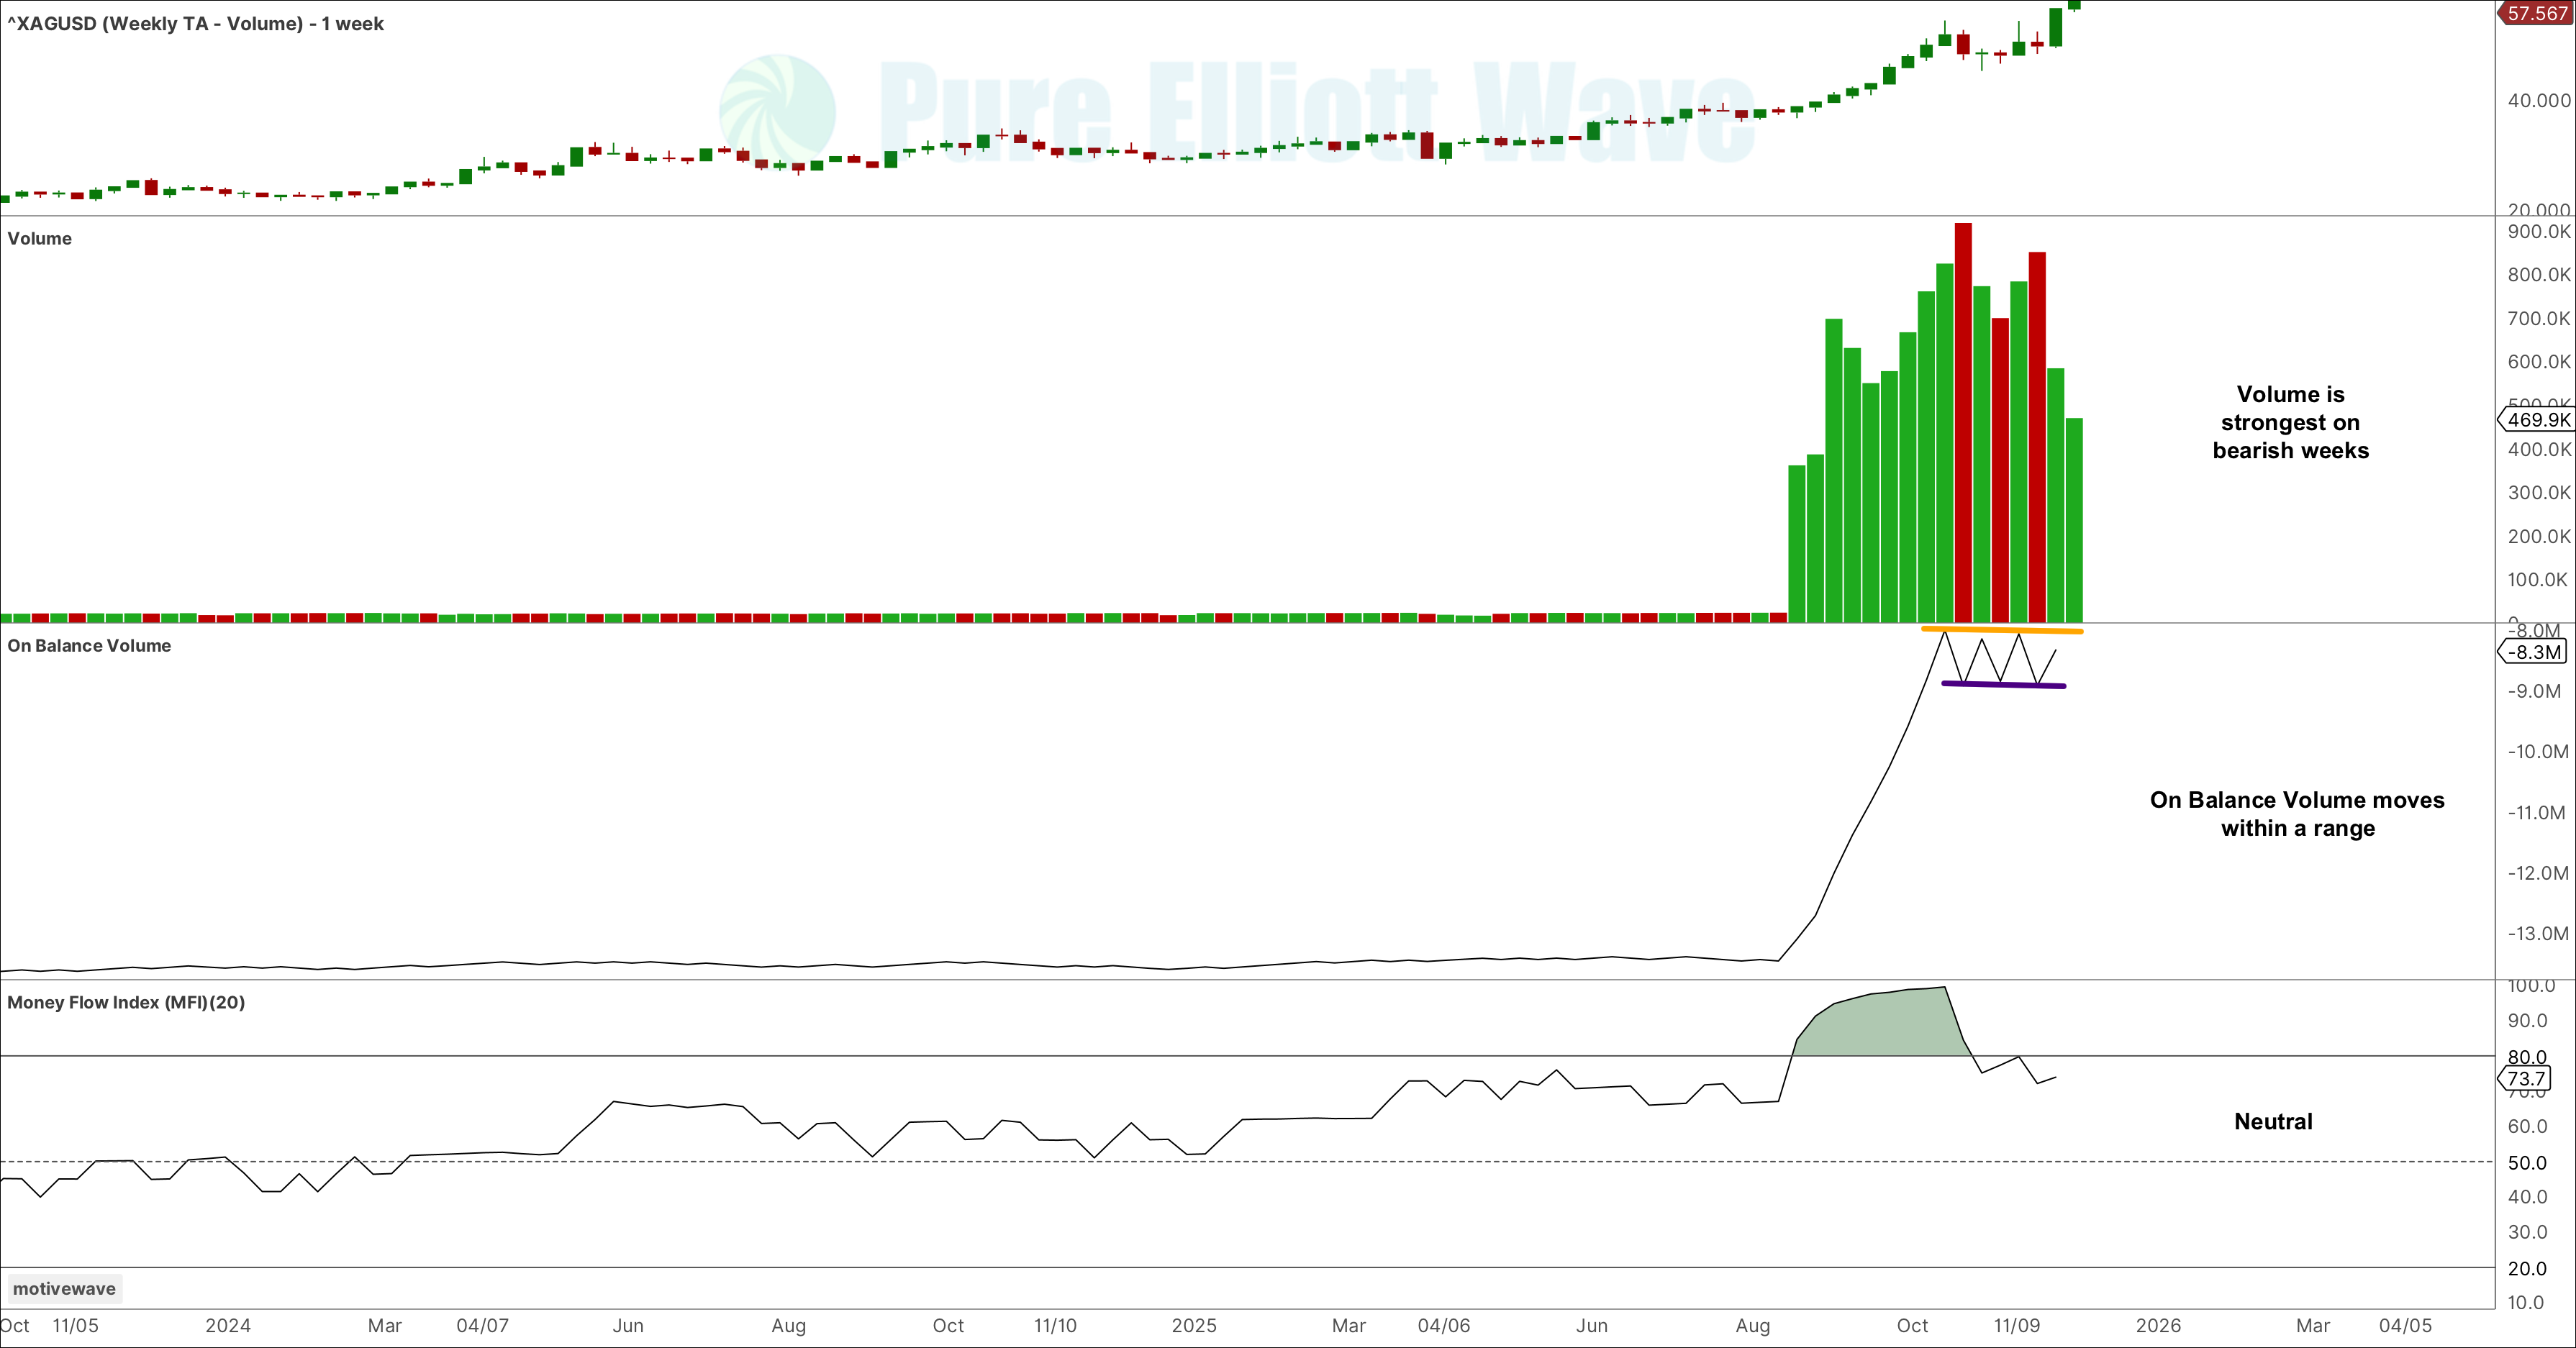
WEEKLY CHART
Click chart to enlarge.
Click chart to enlarge.
Price has increased, surpassing prior resistance (now support).
Overall, volume is stronger on bearish weeks, seeing some weakening support for upwards movement, and some support for downwards movement.
ADX increases with a bullish trend that is not yet extreme. This trend may continue to where ADX enters extreme or very extreme conditions, while RSI and Money Flow Index exhibit bearish divergence.
This data continues to support the Elliott Wave count, seeing upwards movement to continue, though to possibly end soon.
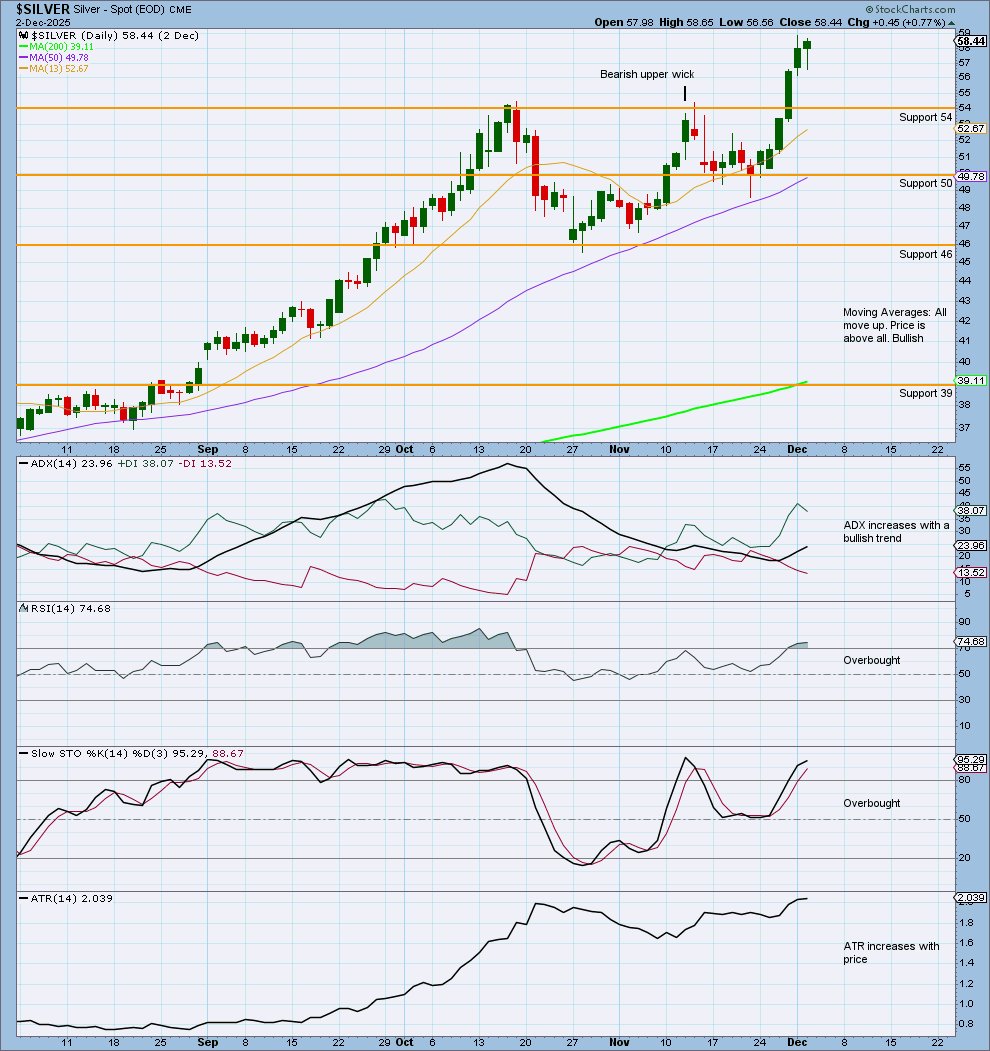
DAILY CHART
Click chart to enlarge.
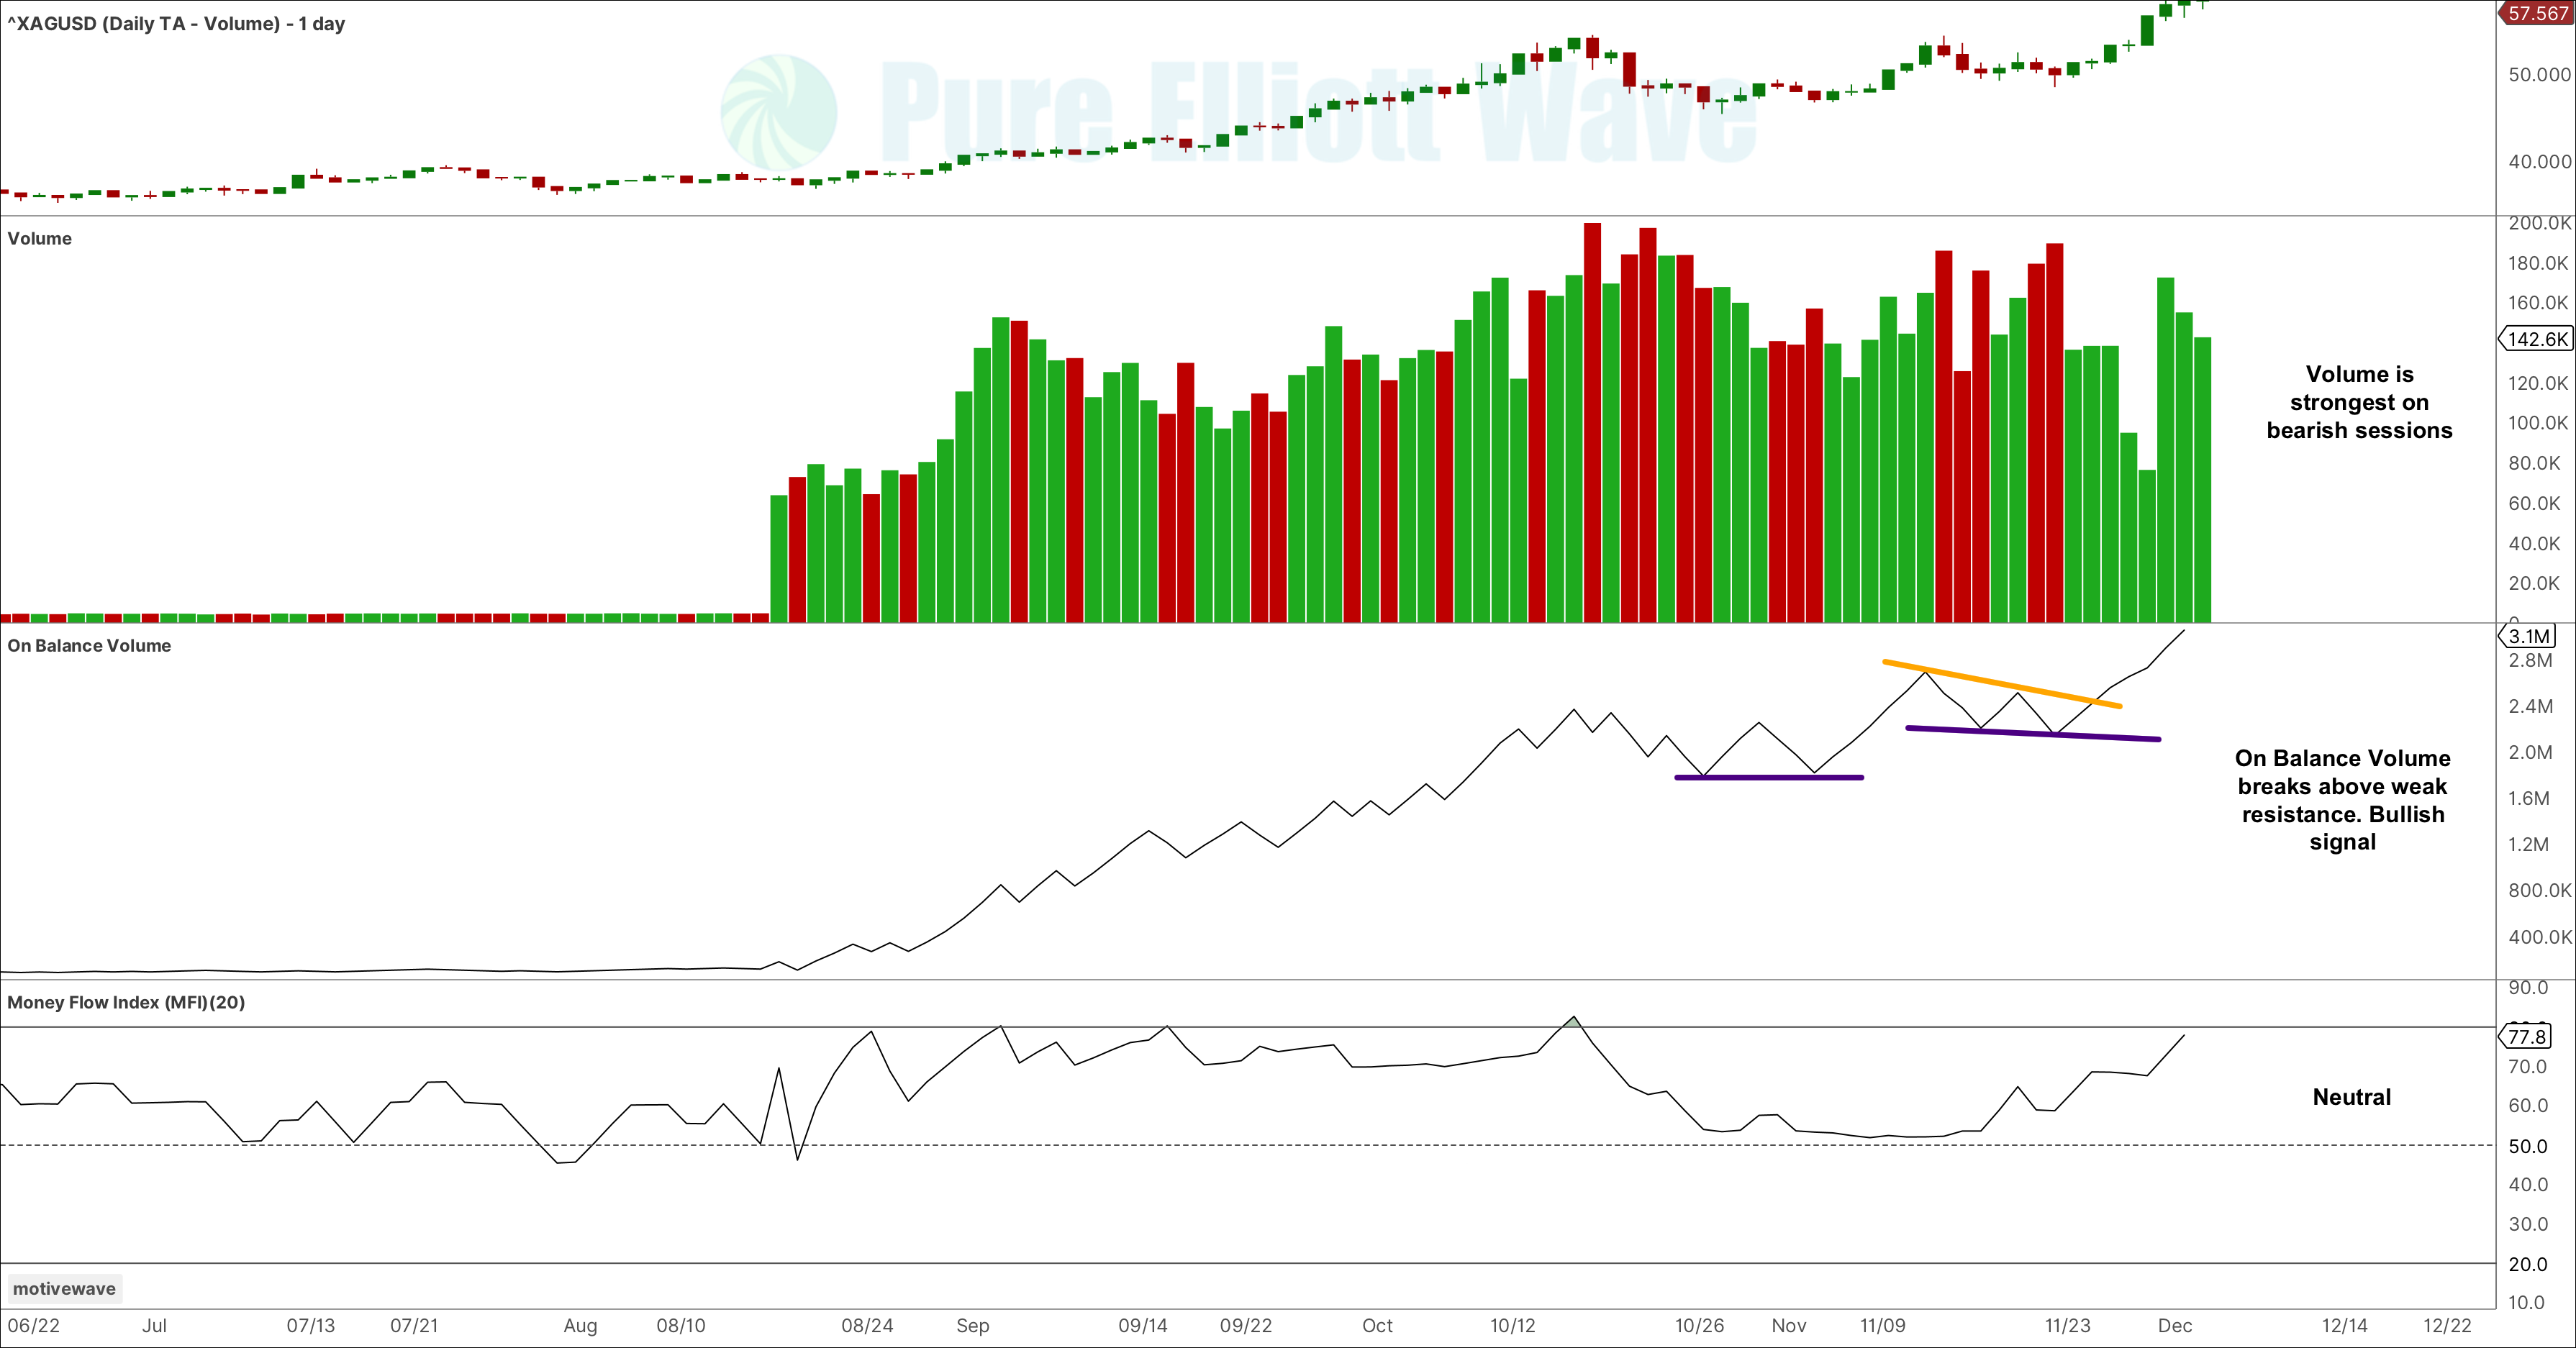
Click chart to enlarge.
Price has continued higher, recently breaking above resistance (now support) at 54. This break above resistance came with a strong push from volume, supporting that break.
Overall strongest volume remains on bearish sessions, with weakening volume overall on upwards sessions.
ADX increases with a bullish trend that is not extreme or in danger of ending. The trend increases from a low point, though not below 15 or below both DX lines. This is still a strong bullish signal from ADX, however it is not the strongest.
The trend may continue to where ADX enters extreme or very extreme conditions, while RSI and Money Flow Index exhibit divergence.
This chart continues to support the Elliott Wave count, seeing upwards movement to continue.
Published @ December 3rd, 2025 06:21 p.m. ET.
—
Careful risk management protects your trading account(s).
Follow our two Golden Rules:
1. Always trade with stops.
2. Risk only 1-5% of equity on any one trade.
—
New updates to this analysis are in bold.
—
 Save as PDF