BTCUSD Elliott Wave and Technical Analysis – 23rd December, 2017
Last analysis stated: “Instead of trying to figure out where this bubble may go, I’ll focus on figuring out when it may have popped. A strong bearish candlestick pattern at the weekly chart level and a trend channel or trend line breach will be looked for.”
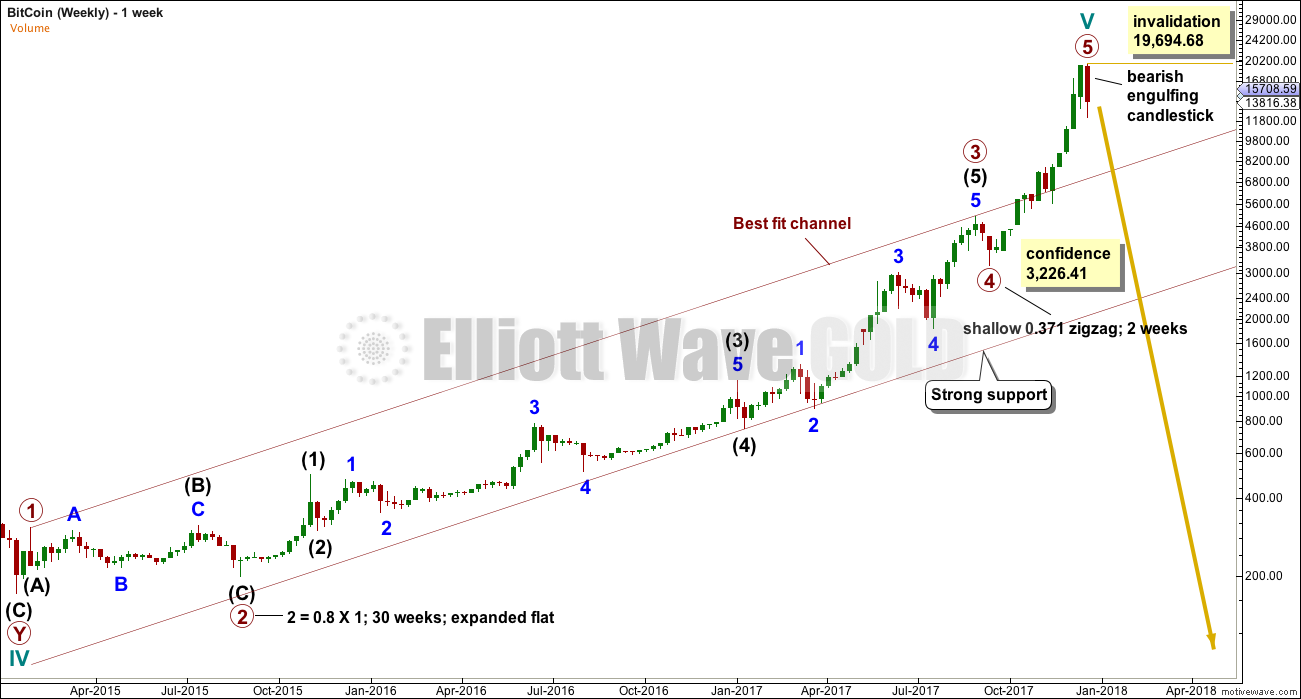
There is a completed weekly candlestick at the end of today’s session, and it is a strong bearish engulfing candlestick pattern.
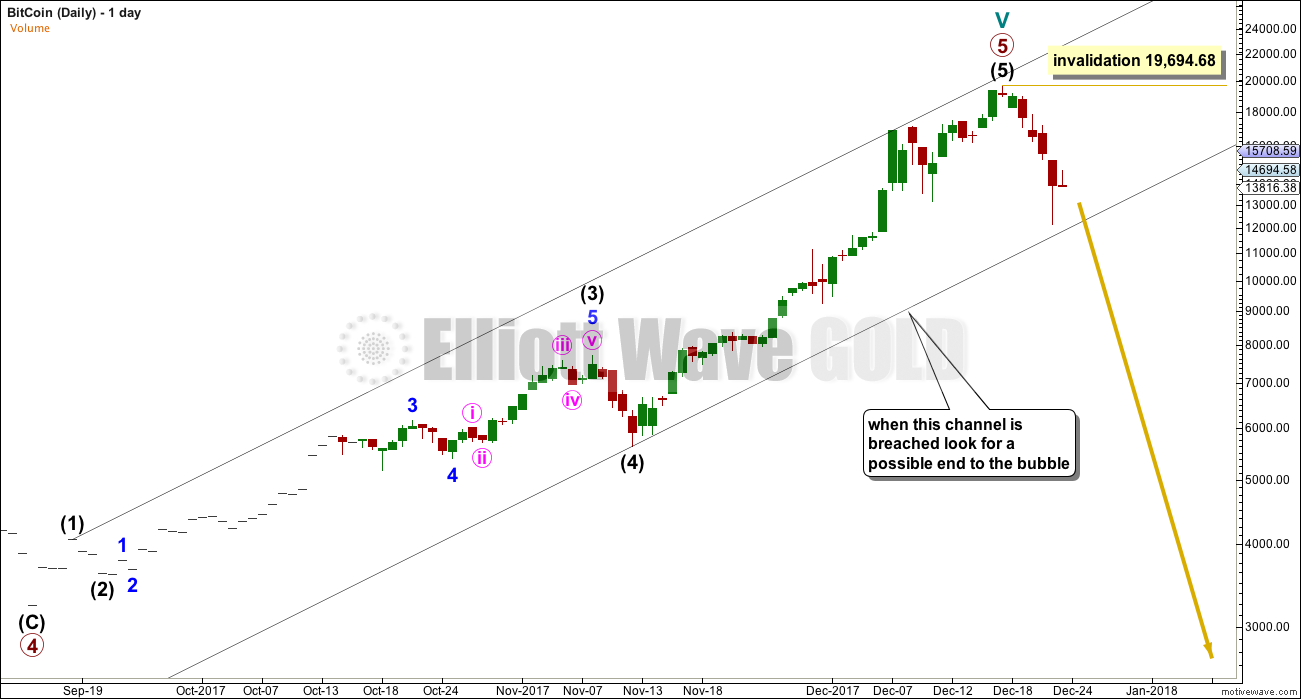
But the channel is not yet breached.
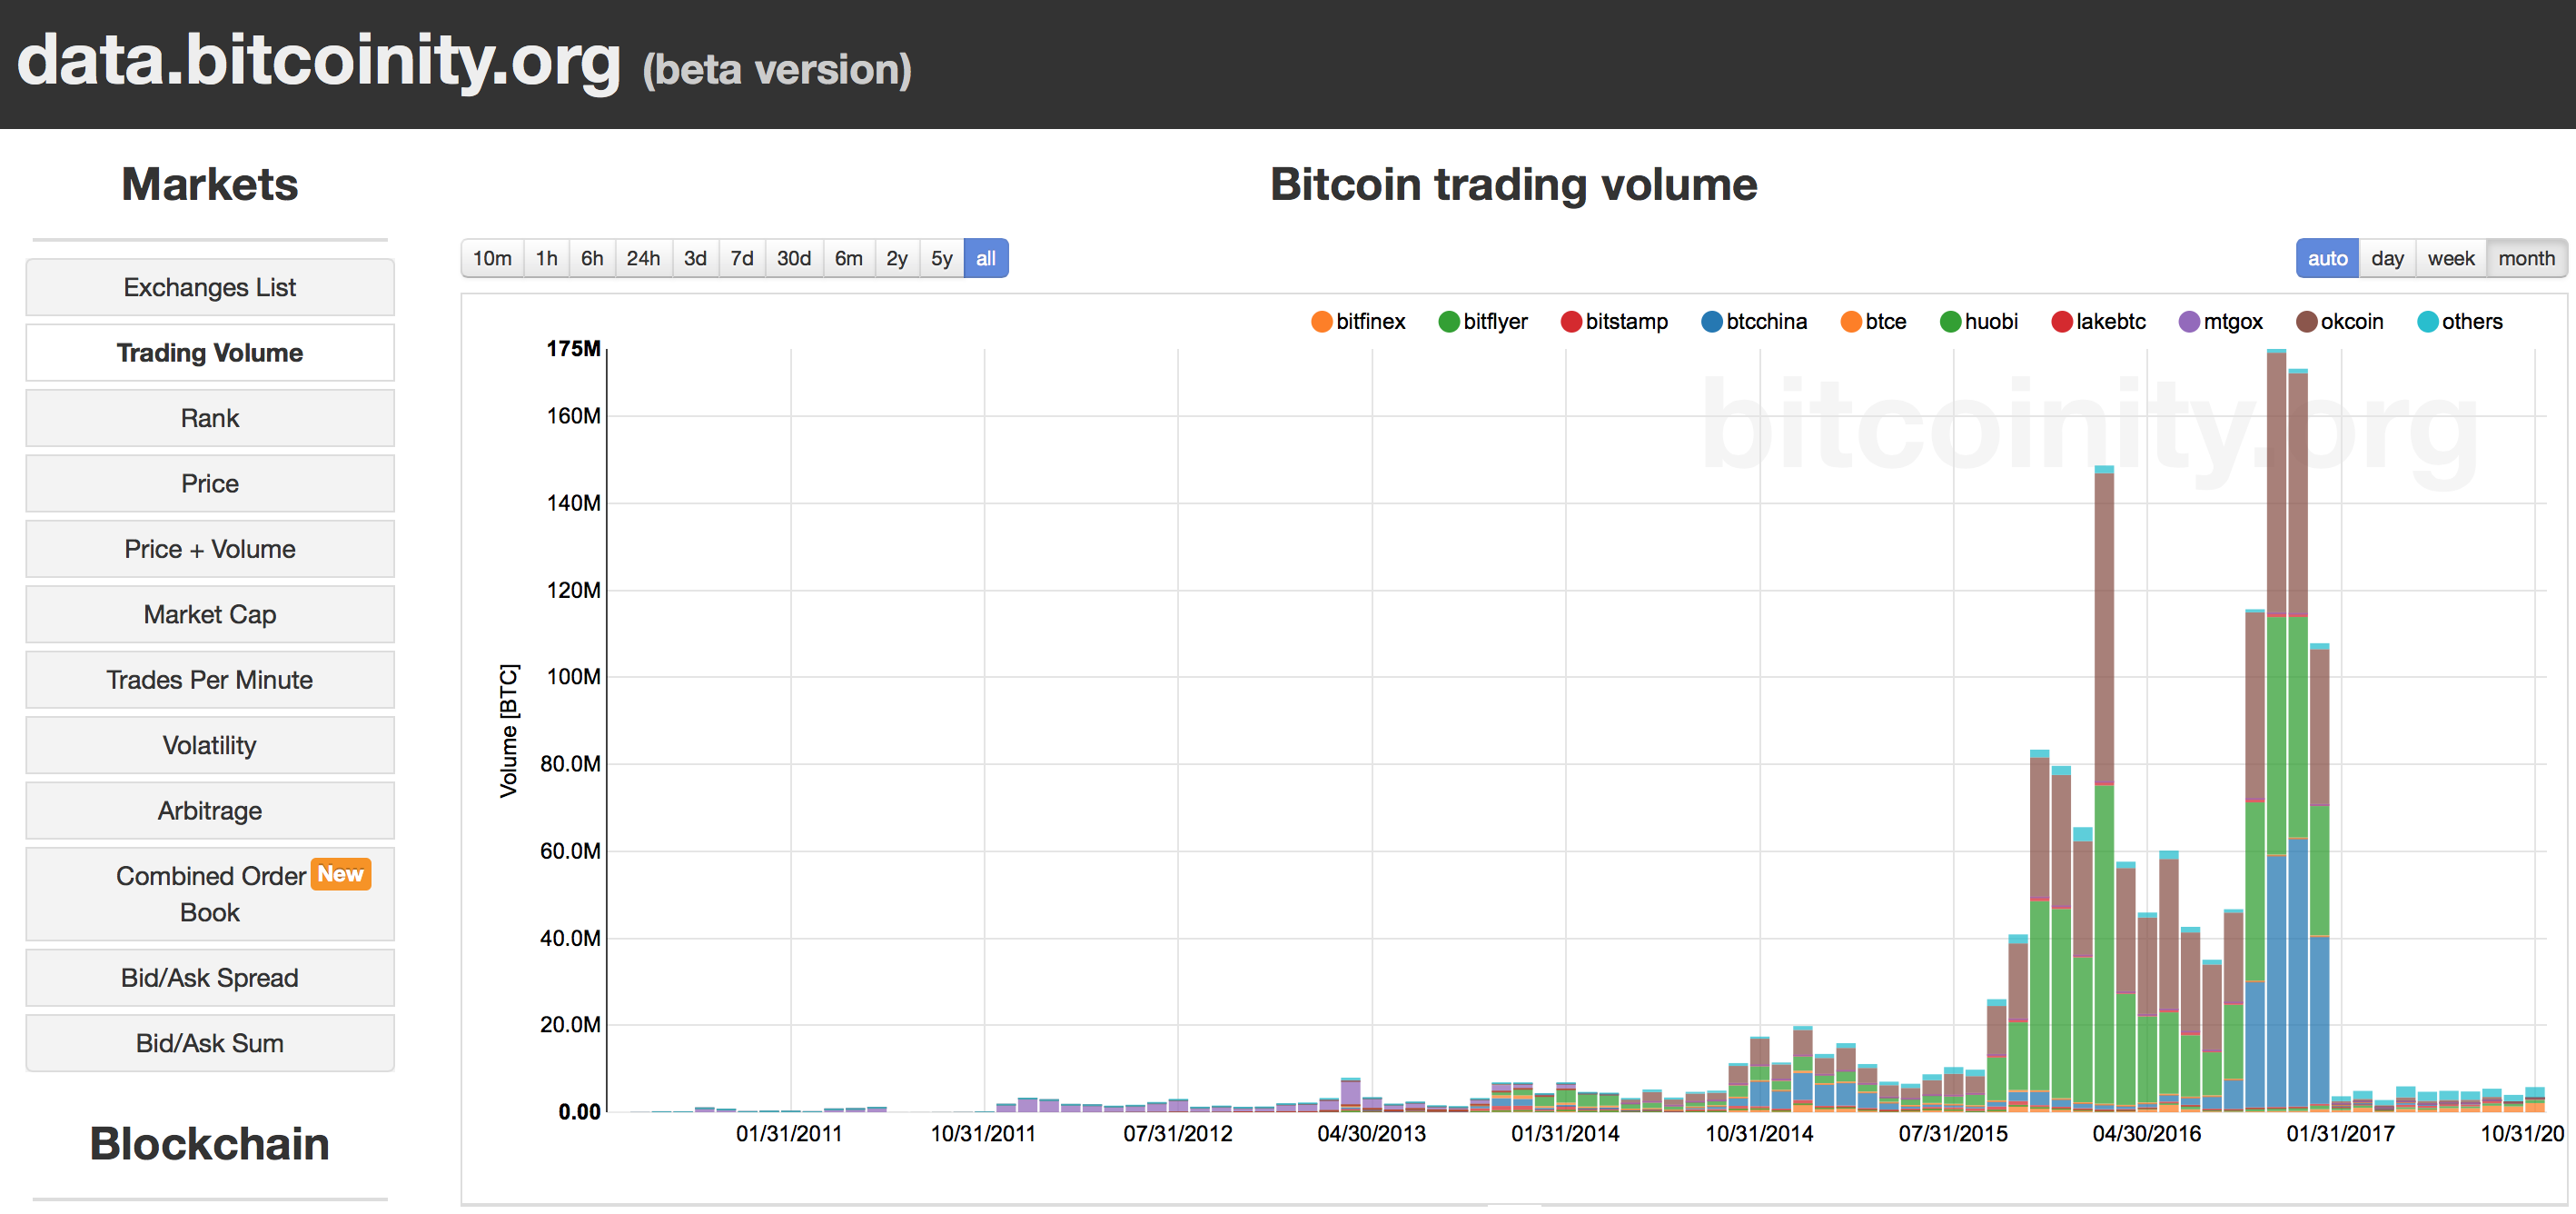
Volume supports the idea of a high in place, but the bottom line is that there is substantial risk to any short position while price remains within the channel.
Look now for a bounce to not make a new all time high, which should exhibit weakness in volume. Then look for the channel breach.
Manage risk diligently.
ELLIOTT WAVE CHARTS
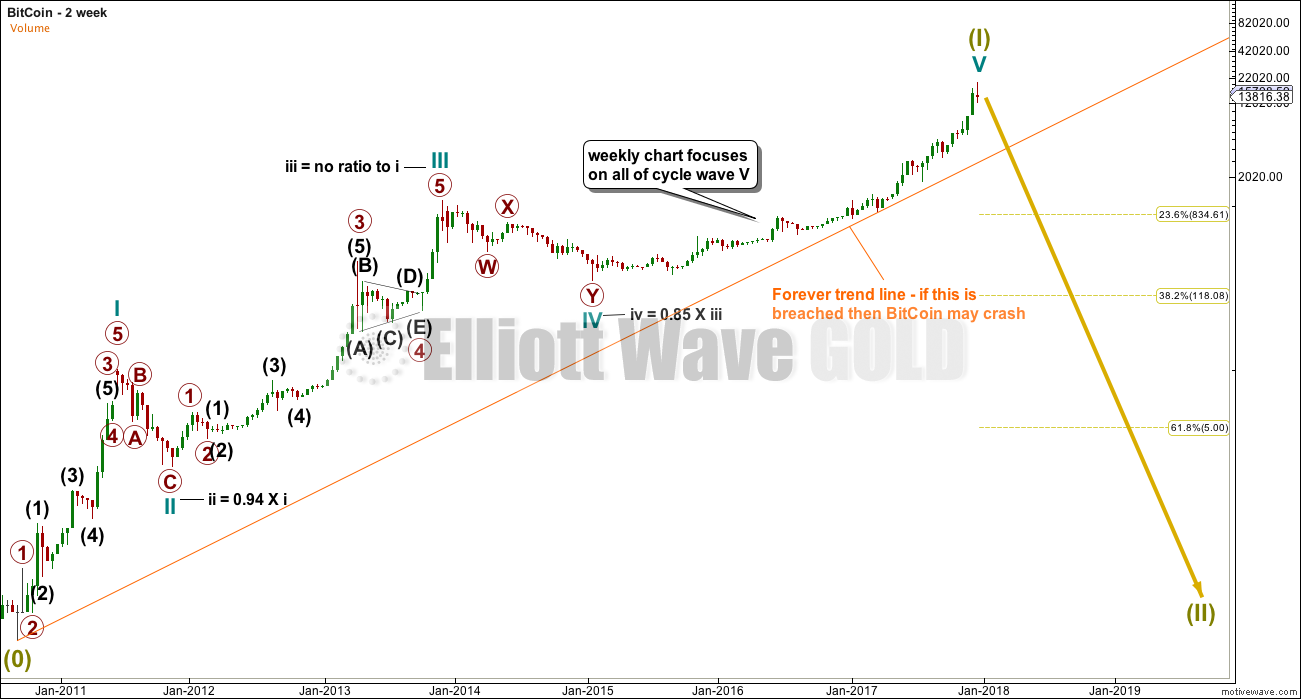
2 WEEKLY
WEEKLY
DAILY
VOLUME ANALYSIS

Click chart to enlarge. Chart courtesy of Bitcoinity.org.
A huge drop in volume suggests exhaustion.
Published @ 02:22 a.m. EST.


