March 8, 2023: EURUSD Elliott Wave and Technical Analysis – Video and Charts
Summary: The bigger picture for Euro expects overall upwards movement for the long term, most likely to not make a new high above 1.06380.
For the short term, a pullback may continue lower to a target zone from 1.01948 to 1.01709. Thereafter, a strong third wave up may begin.
MAIN QUARTERLY CHART
Click chart to enlarge.
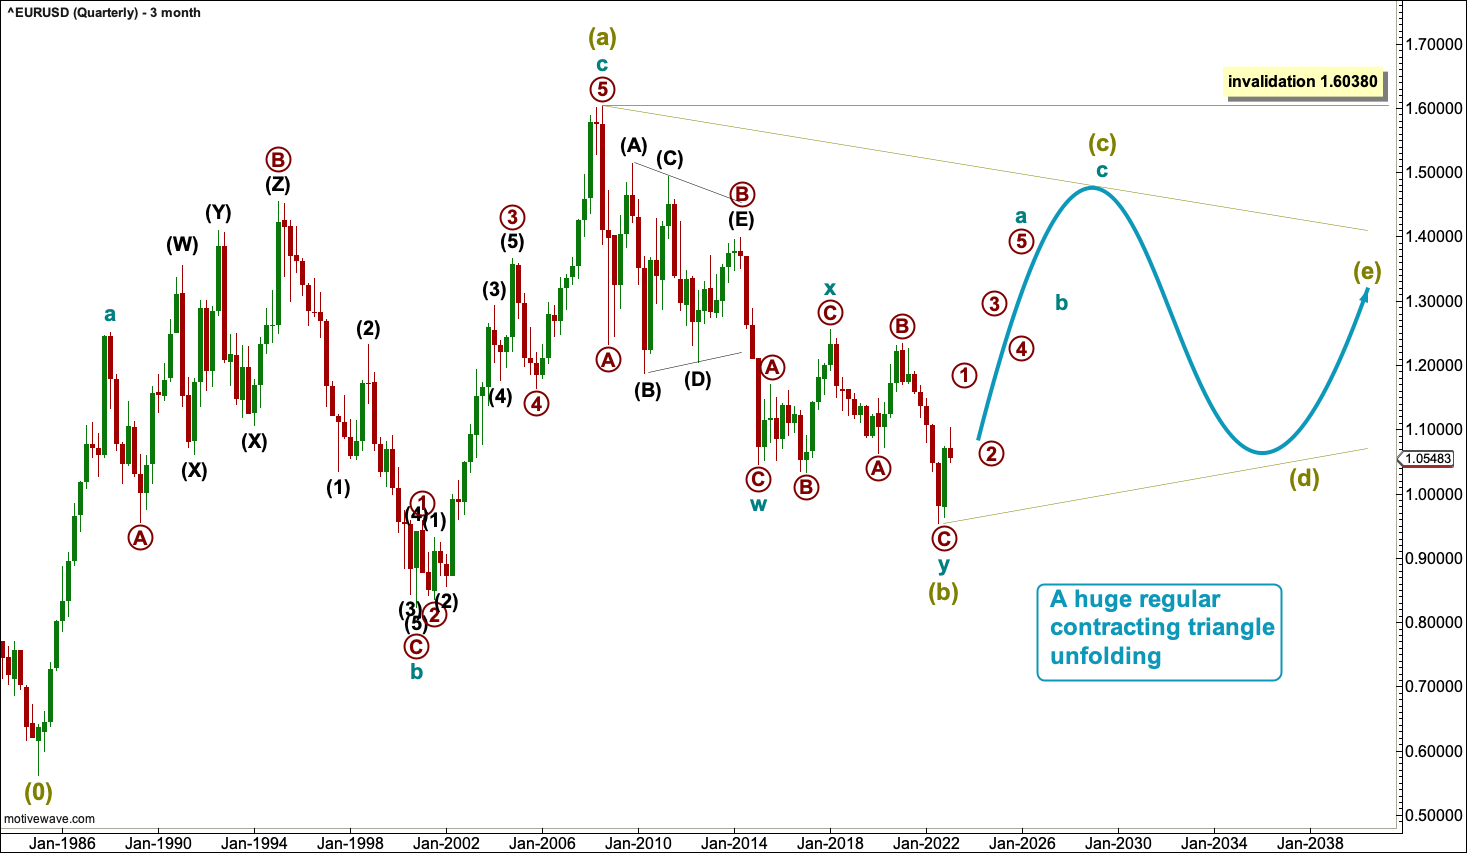
From the low in 1985 to the high in 2008, this upwards movement will not subdivide as a five wave motive structure, but it will subdivide well as a zigzag. If this upwards movement is a corrective structure, then it is a counter trend movement at the highest time frame. That means the larger trend for Euro is down.
If the first big wave up is a zigzag, then multiple structures are possible at Grand Super Cycle degree. This first wave count considers a regular contracting triangle, which is judged to have the highest probability as it has the best look.
Within the triangle, Super Cycle waves (a) and (b) may be complete. Super Cycle wave (c) must now continue higher and may not move beyond the end of Super Cycle wave (a) at 1.06380.
Super Cycle wave (b) subdivides as a double zigzag. Only one of the five subwaves of a triangle may subdivide as a multiple, and this means the remaining subwaves of Super Cycle waves (c), (d) and (e) must all subdivide as single zigzags.
MONTHLY CHART
Click chart to enlarge.
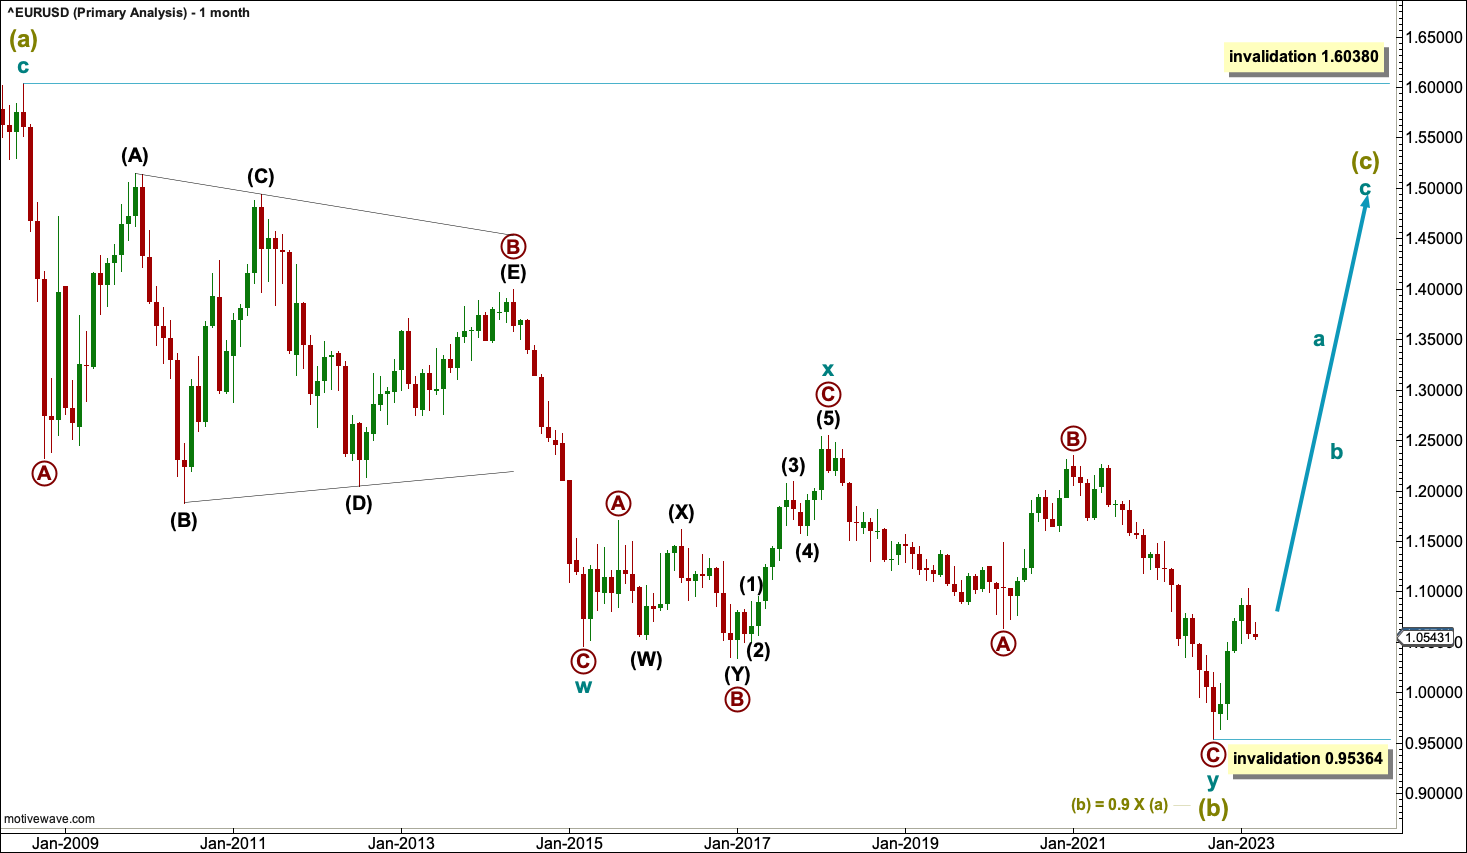
Super Cycle wave (c) may have begun just five months ago. It must subdivide as a zigzag. Within Super Cycle wave (c), a second wave or B wave may not move below 0.95364.
WEEKLY CHART
Click chart to enlarge.
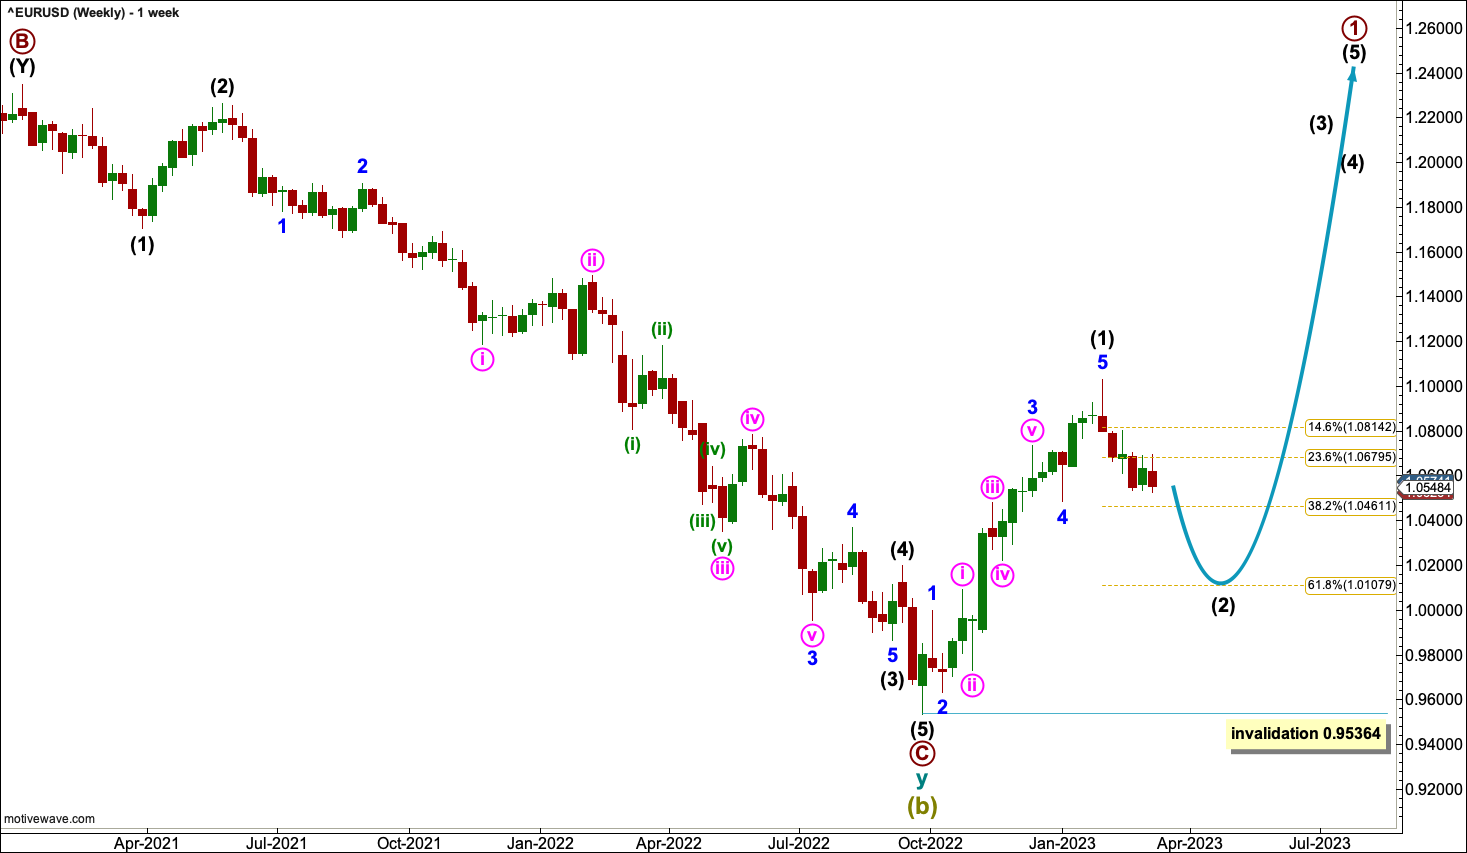
The weekly chart focusses on the end of Super Cycle wave (b) and the start of Super Cycle wave (c).
Within Super Cycle wave (c), cycle wave a must subdivide as a five wave motive structure. Primary wave 1 within cycle wave a would be most likely incomplete.
Within primary wave: Intermediate wave (1) may be over at the last high and now intermediate wave (2) may continue lower to find support about the 0.618 Fibonacci ratio of intermediate wave (1) at 1.01079.
Intermediate wave (1) lasted 18 weeks, 3 weeks short of a Fibonacci 21. Intermediate wave (2) may be expected to last about a Fibonacci 13 or 21 weeks in total, give or take about 2 either side of these numbers.
Intermediate wave (2) may not move beyond the start of intermediate wave (1) below 0.95364.
DAILY CHART
Click chart to enlarge.
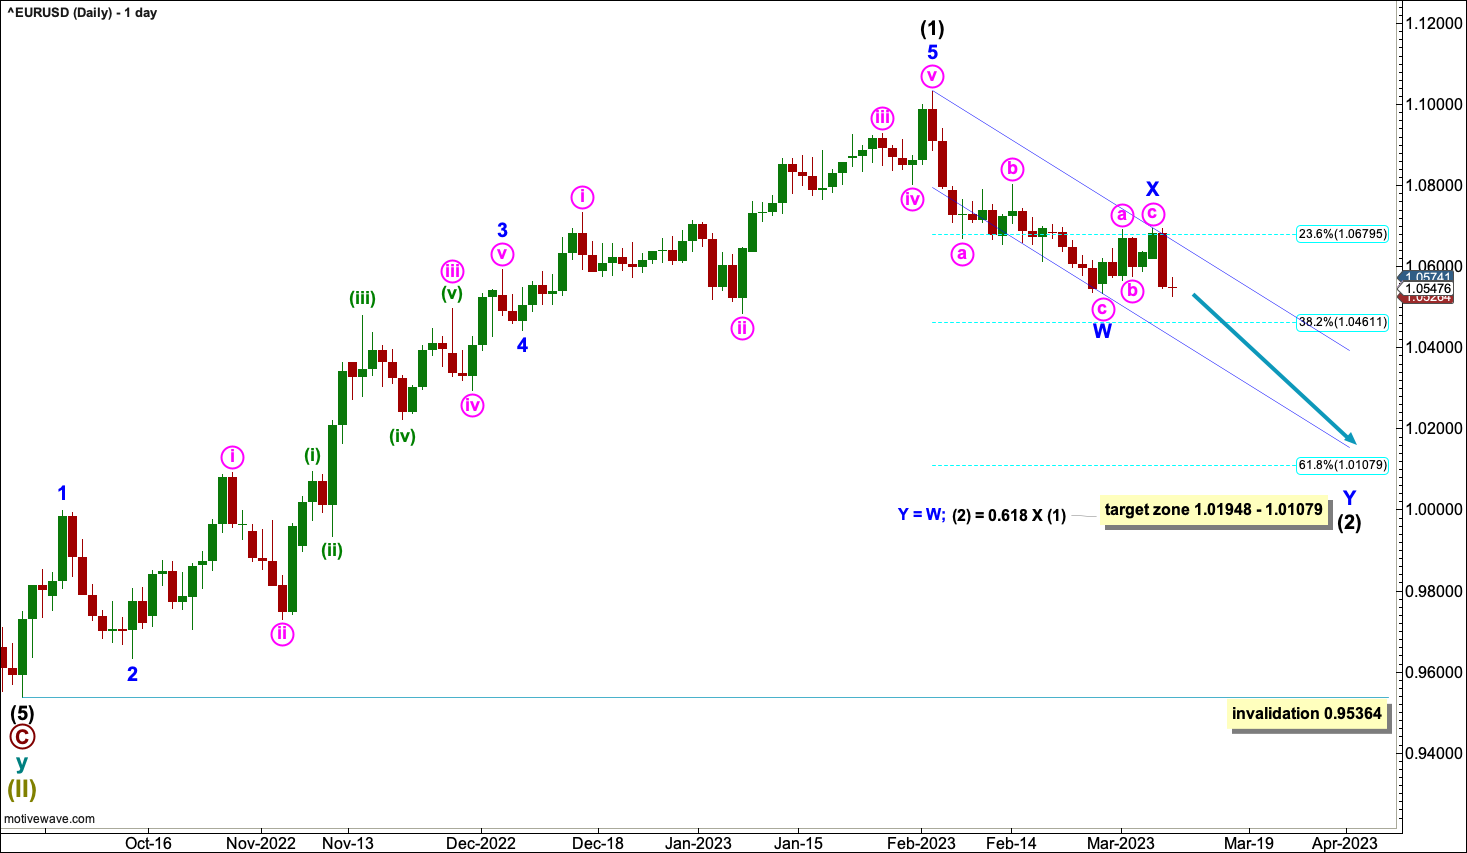
The daily chart focusses on intermediate waves (1) and (2).
Intermediate wave (2) may be unfolding as a double zigzag. Within the double, the first zigzag may be complete and is labelled minor wave W. The double is joined by a three in the opposite direction, a zigzag labelled minor wave X, which may also be complete. The second zigzag in the double is labelled minor wave Y and looks incomplete. The purpose of a second zigzag in a double is to deepen the correction when the first zigzag does not move price deep enough. If minor wave Y ends at the target zone, then this purpose would be achieved.
A target is calculated at two degrees. At 1.01079 intermediate wave (2) would reach the 0.618 Fibonacci ratio of intermediate wave (1). At 1.01948 minor wave Y would reach equality in length with minor wave W. This gives a an 87 pip target zone.
HOURLY CHART
Click chart to enlarge.
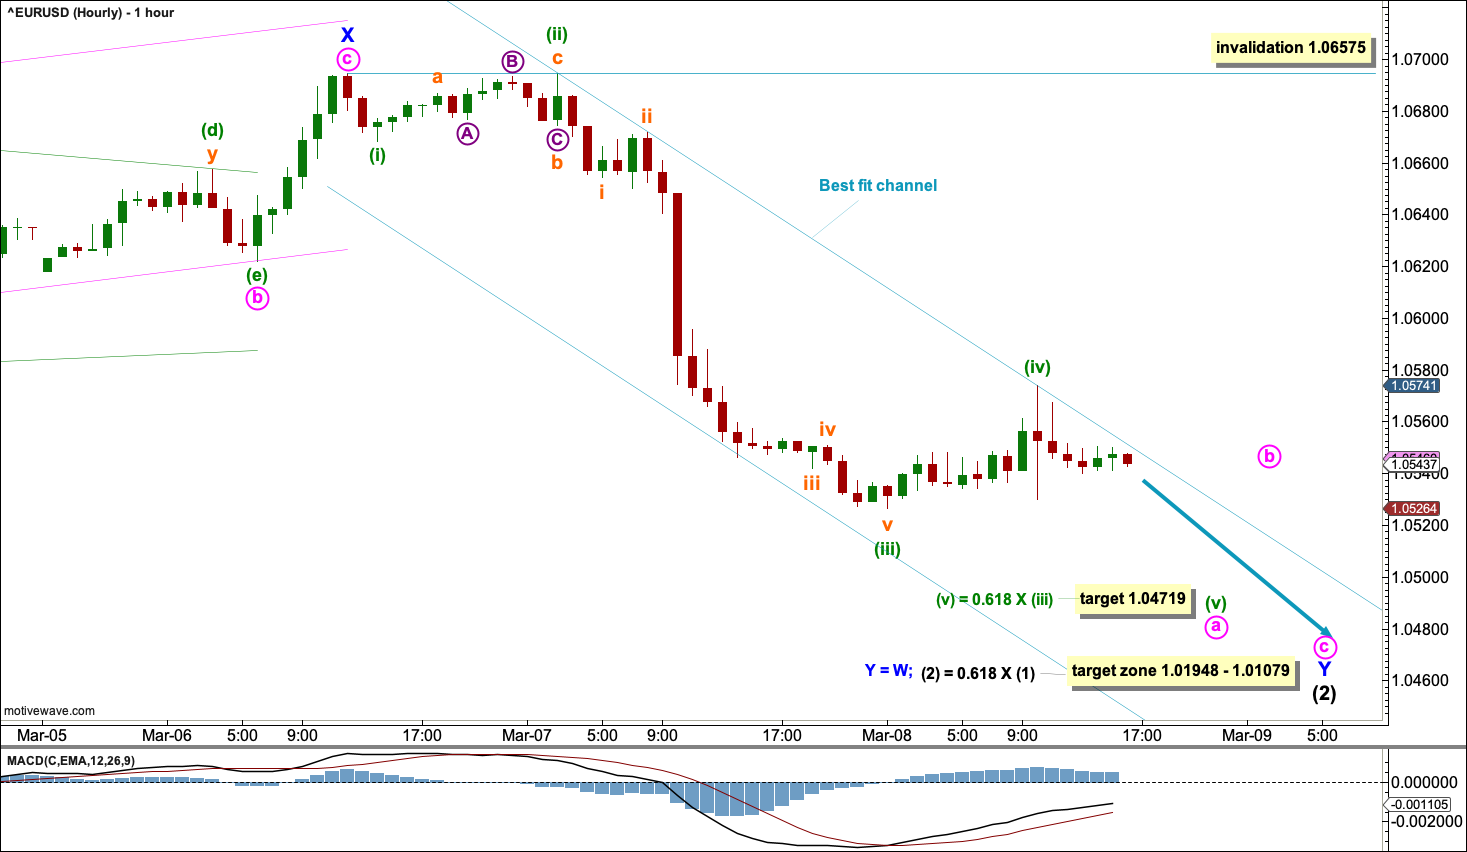
The hourly chart focusses on the start of minor wave Y.
Minor wave Y must subdivide as a zigzag. Within the zigzag, minute wave a may be incomplete. When minute wave a is complete, then a bounce or consolidation for minute wave b should unfold over a few days and may not move beyond the start of minute wave a above 1.06575.
For the short term, this wave count expects downwards movement.
A short-term target is calculated for minute wave a. If minuette wave (v) were to exhibit the most common Fibonacci ratio, equality in length with minuette wave (i), it would be truncated. A next common ratio would be for minuette wave (v) to reach 0.618 the length of minuette wave (iii) at 1.04719.
FIRST ALTERNATE QUARTERLY CHART
Click chart to enlarge.
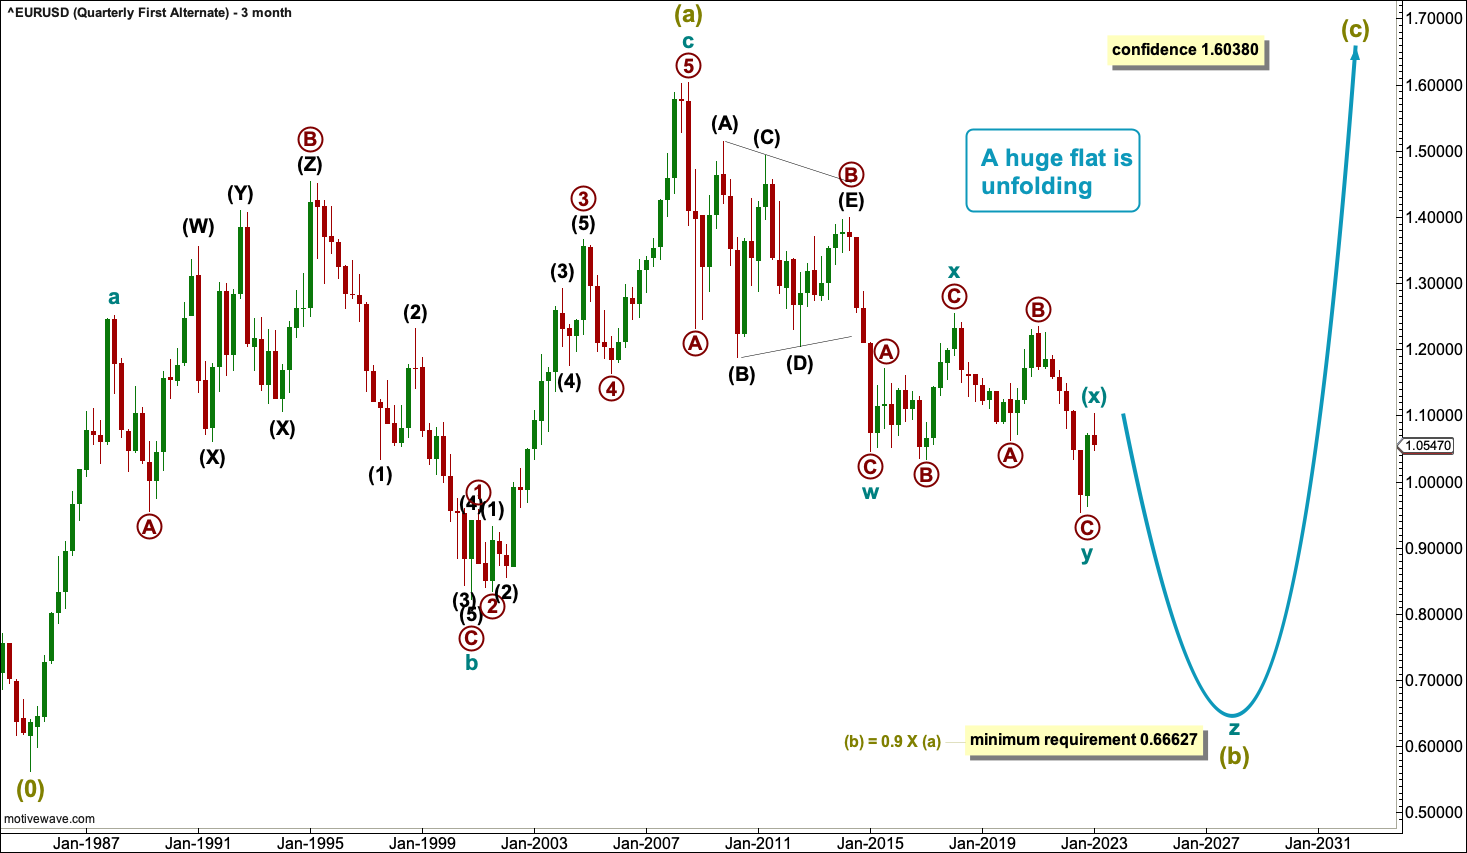
Because the first large upwards wave from 1985 to 2008 subdivides as a corrective structure, the larger picture for Euro must consider alternate Elliott wave corrective structures.
If a large flat is unfolding, then within it Super Cycle wave (a) would be a complete zigzag. Super Cycle wave (b) within a flat must continue lower to retrace a minimum 0.9 length of Super Cycle wave (a) at 0.66627. Super Cycle wave (b) may make a new low below the start of Super Cycle wave (a) at 0.56210, as in an expanded flat.
For Super Cycle wave (b) to continue lower, it may now only continue as a triple zigzag. While triple zigzags are not rare, they are uncommon and this reduces the probability of this wave count to an alternate.
SECOND ALTERNATE QUARTERLY CHART
Click chart to enlarge.
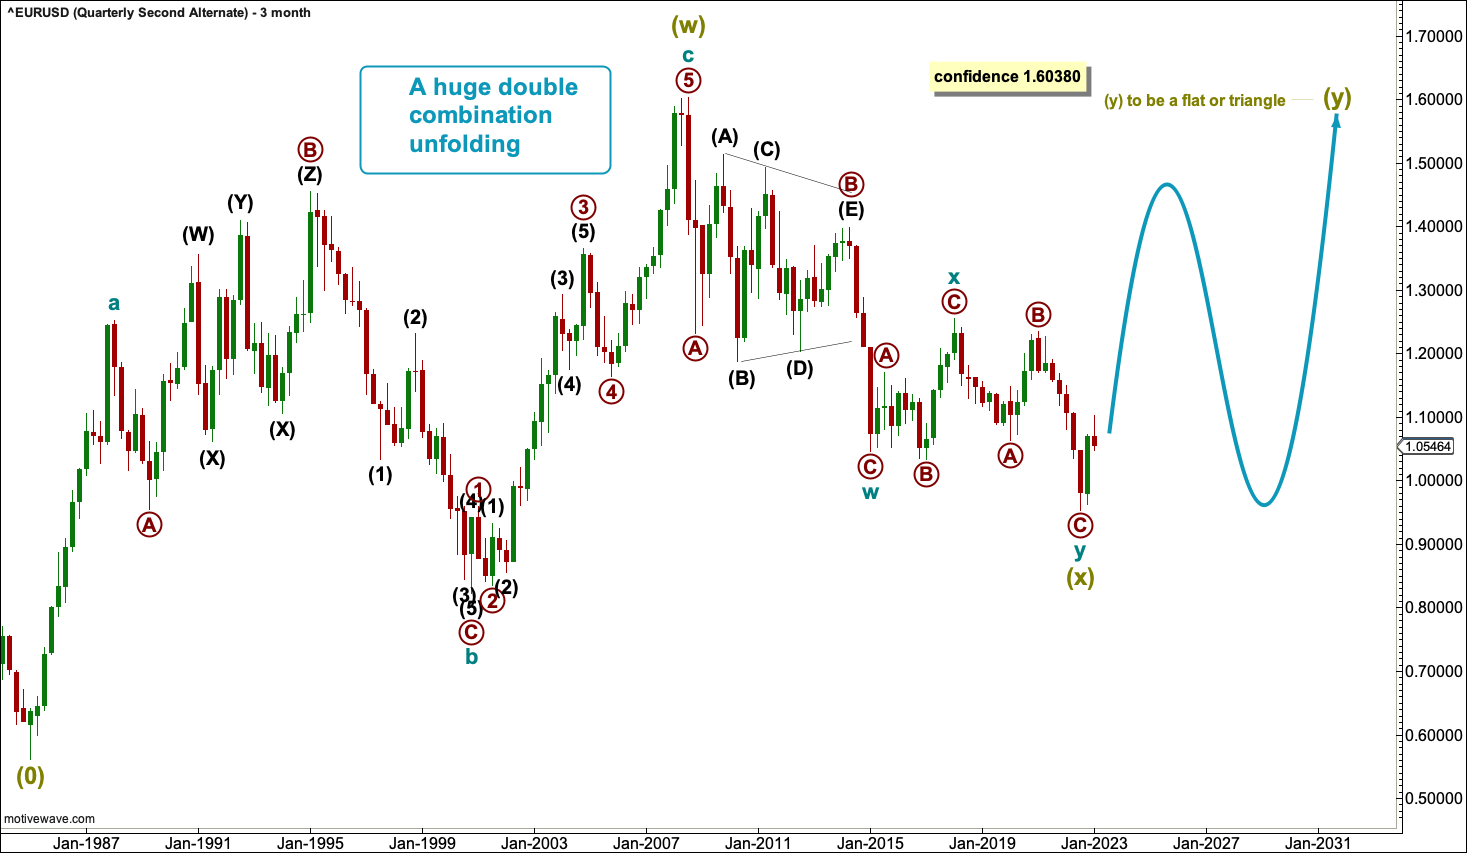
It is also possible that a huge double combination may be unfolding. Within the double combination, the first structure may be a complete zigzag labelled Super Cycle wave (w).
The double may be joined by a now complete three in the opposite direction labelled Super Cycle wave (x).
The maximum number of corrections in a multiple is three. This number applies to W, Y and Z within combinations. W, Y and Z may themselves only subdivide as simple corrective structures, but they may not subdivide as multiples as that would multiply the number of corrections within the multiple beyond three and violate the rule. The rule does not apply to X waves; they may subdivide as multiples and the rule is met. However, X waves almost always subdivide as simple corrective structures. Here, Super Cycle wave (x) is labelled as a double zigzag. This reduces the probability of this wave count to an alternate.
Super Cycle wave (y) must now unfold as either a flat (most likely) or a triangle.
TECHNICAL ANALYSIS
VOLUME
VOLUME WEEKLY CHART
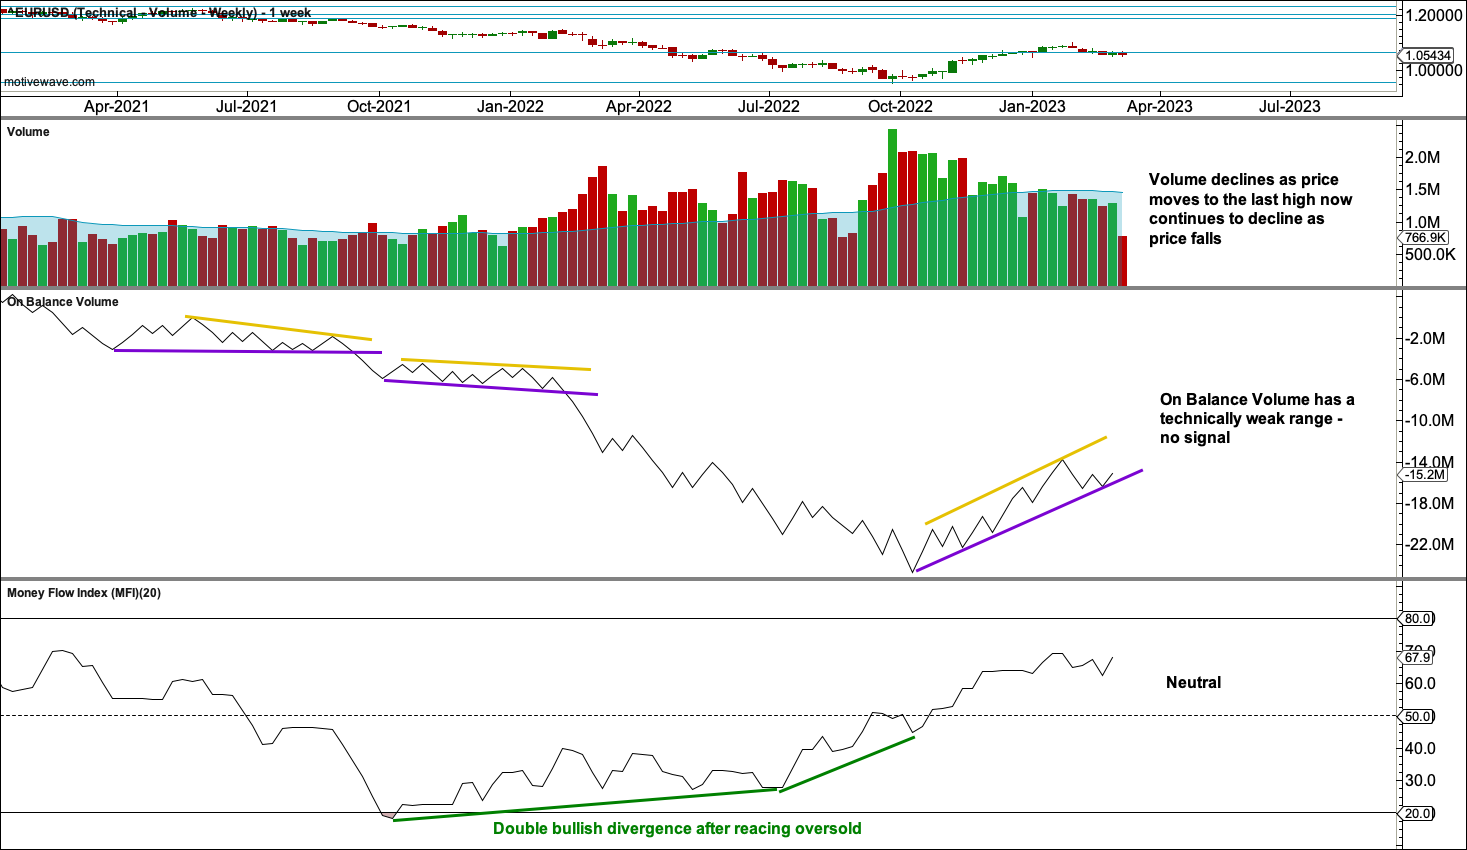
Click chart to enlarge.
The volume profile is slightly bearish.
Strong double bullish divergence between price and Money Flow Index after MFI reached oversold is bullish and supports the Elliott wave count.
VOLUME DAILY CHART
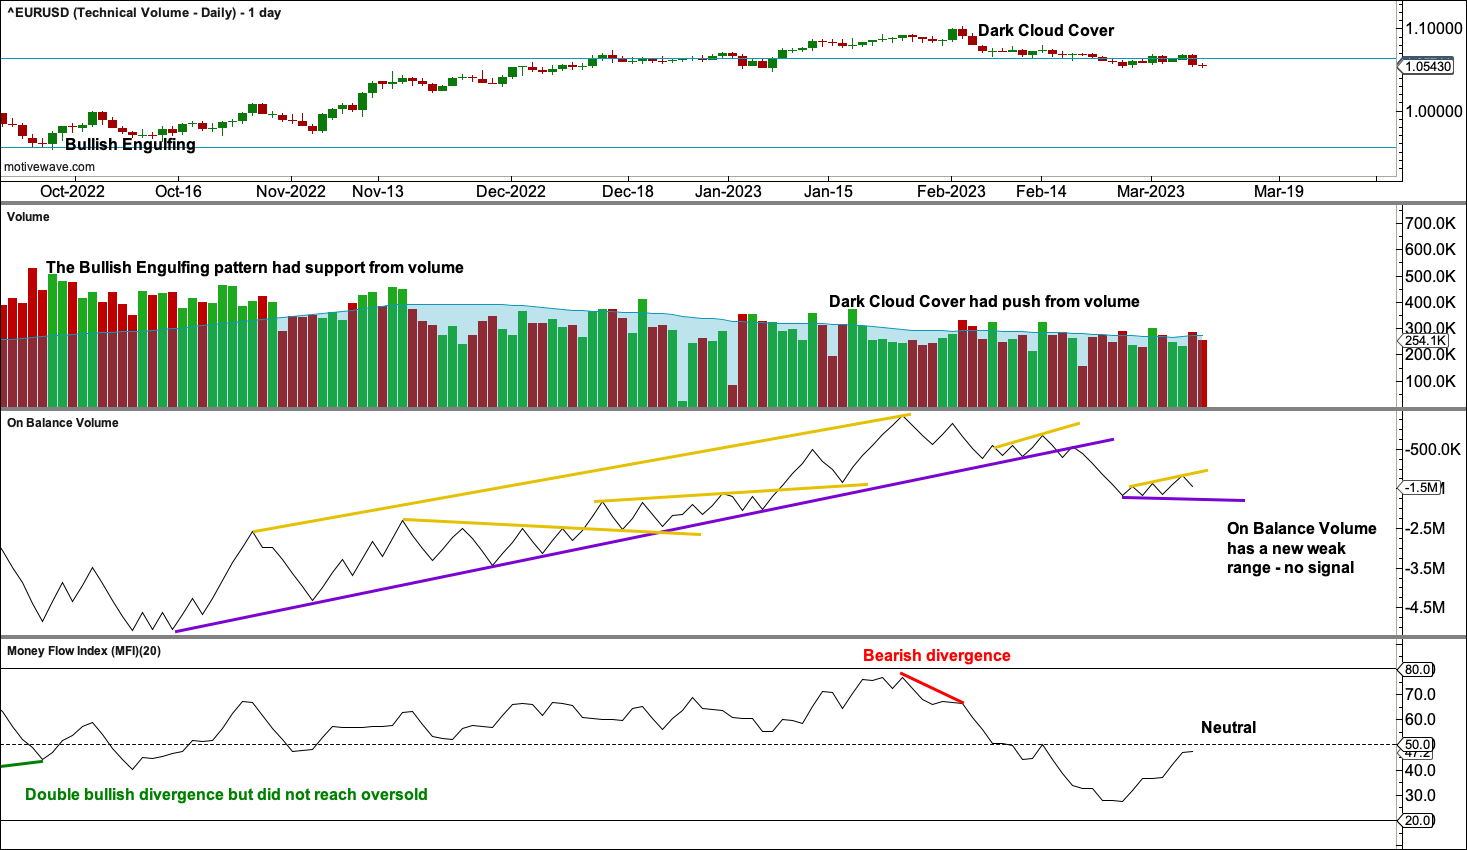
Click chart to enlarge.
Short single bearish divergence at the high of February 2, 2023, may be resolved by a little more downwards movement, but it is not strong enough to expect it indicates a major trend change.
WEEKLY CHART
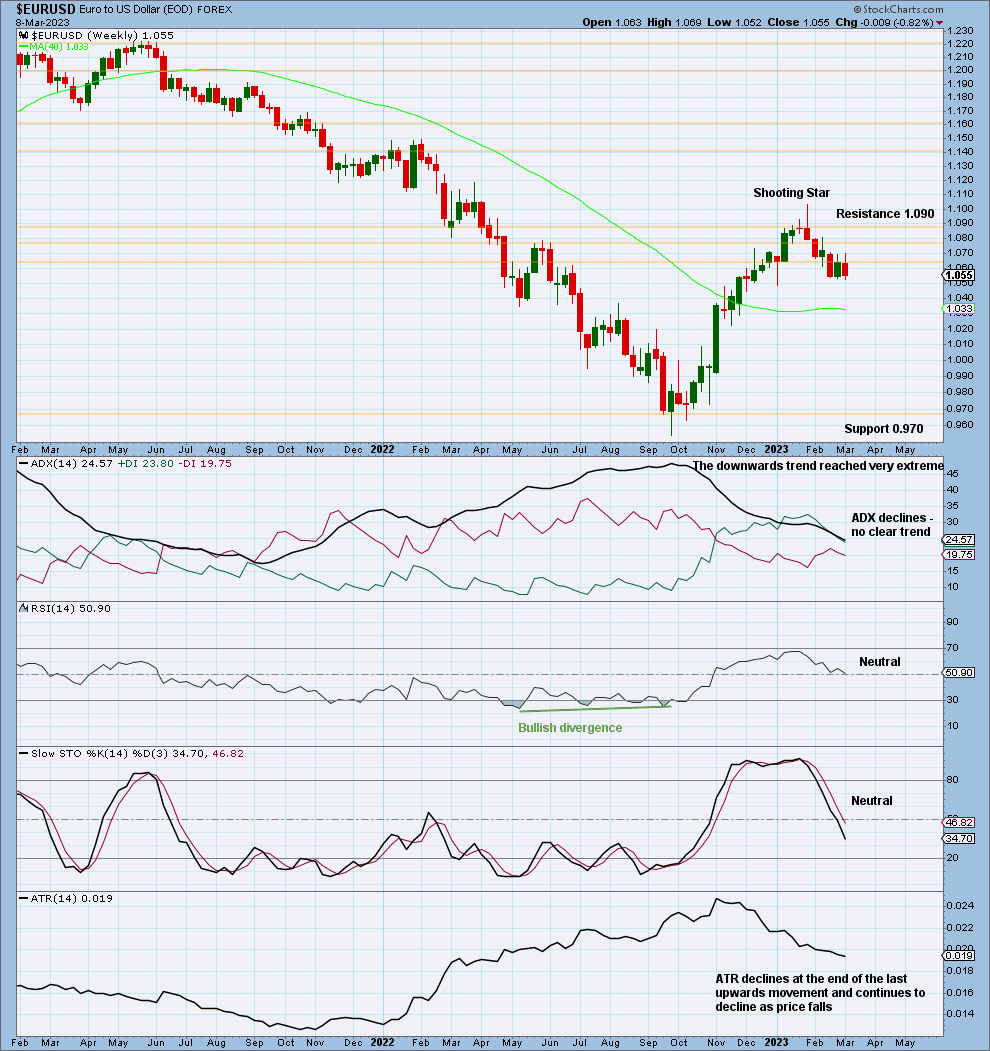
Click chart to enlarge.
Price is below resistance about 1.060. Support below is thin until 0.970. Expect price to fall until it finds support and Stochastics reaches oversold. If Stochastics reaches oversold before price finds support, then price may not reach as low as 0.970.
DAILY CHART
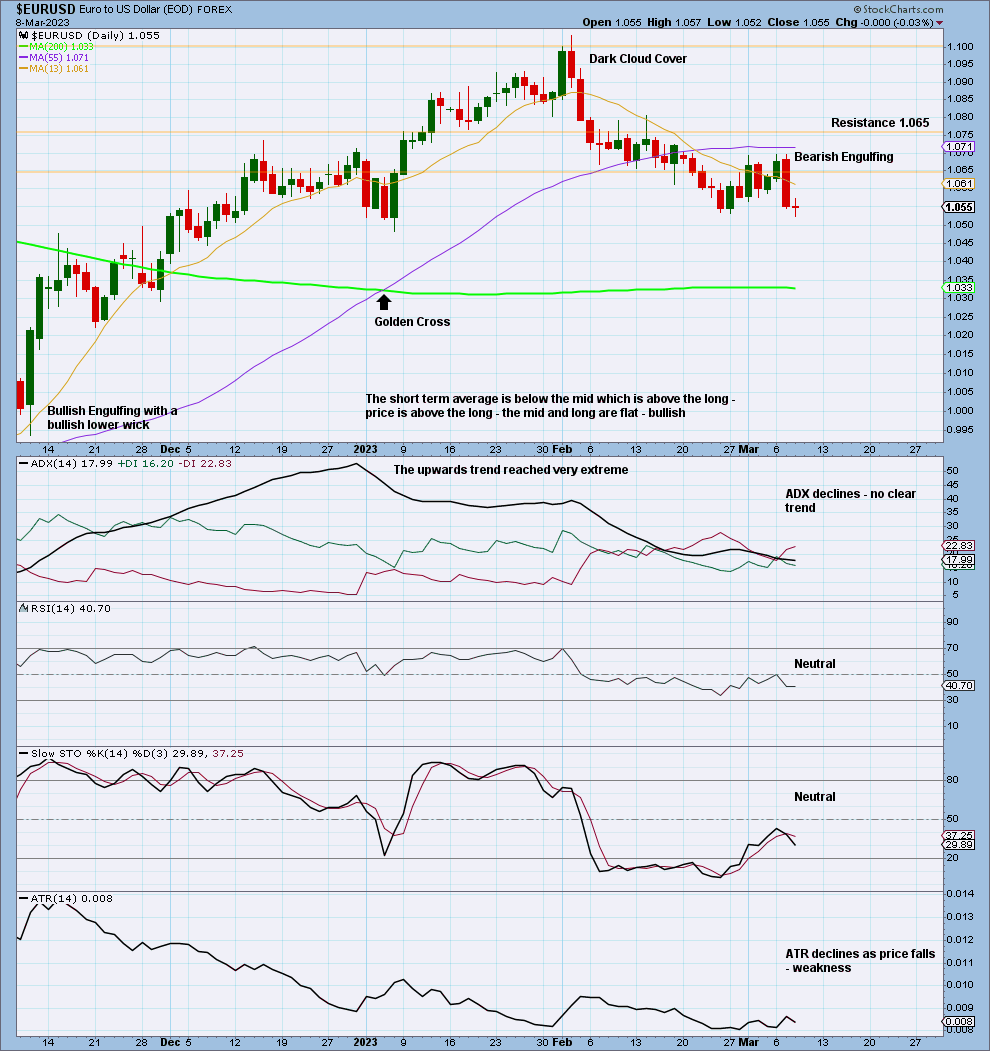
Click chart to enlarge.
There is no clear trend at either the daily or weekly time frame.
Price has moved down from resistance with a strong Bearish Engulfing candlestick. Support below is thin. Stochastics did not reach overbought; it may not on that upwards swing.
Published @ 07:56 p.m. ET.
—
Careful risk management protects your trading account(s).
Follow my two Golden Rules:
1. Invest only funds you can afford to lose.
2. Have an exit strategy for both directions; when to take profit and when to exit a losing investment.
—
New updates to this analysis are in bold.
—
 Save as PDF