June 8, 2023: AUDUSD Elliott Wave and Technical Analysis – Charts and Video
Summary: The bigger picture for the Australian Dollar expects overall upwards movement for the long term to a target at 1.04438.
For the short term, the recent downwards trend is expected to continue, but not below 0.61705. Thereafter, a strong bullish third wave may unfold.
An alternate count sees the recent downwards trend possibly over, but it has a lower probability unless a level is broken.
Technicals support the current 2 year corrective structure. A break above resistance at 0.7150 could signal a strong bull market.
QUARTERLY CHART
Click chart to enlarge.
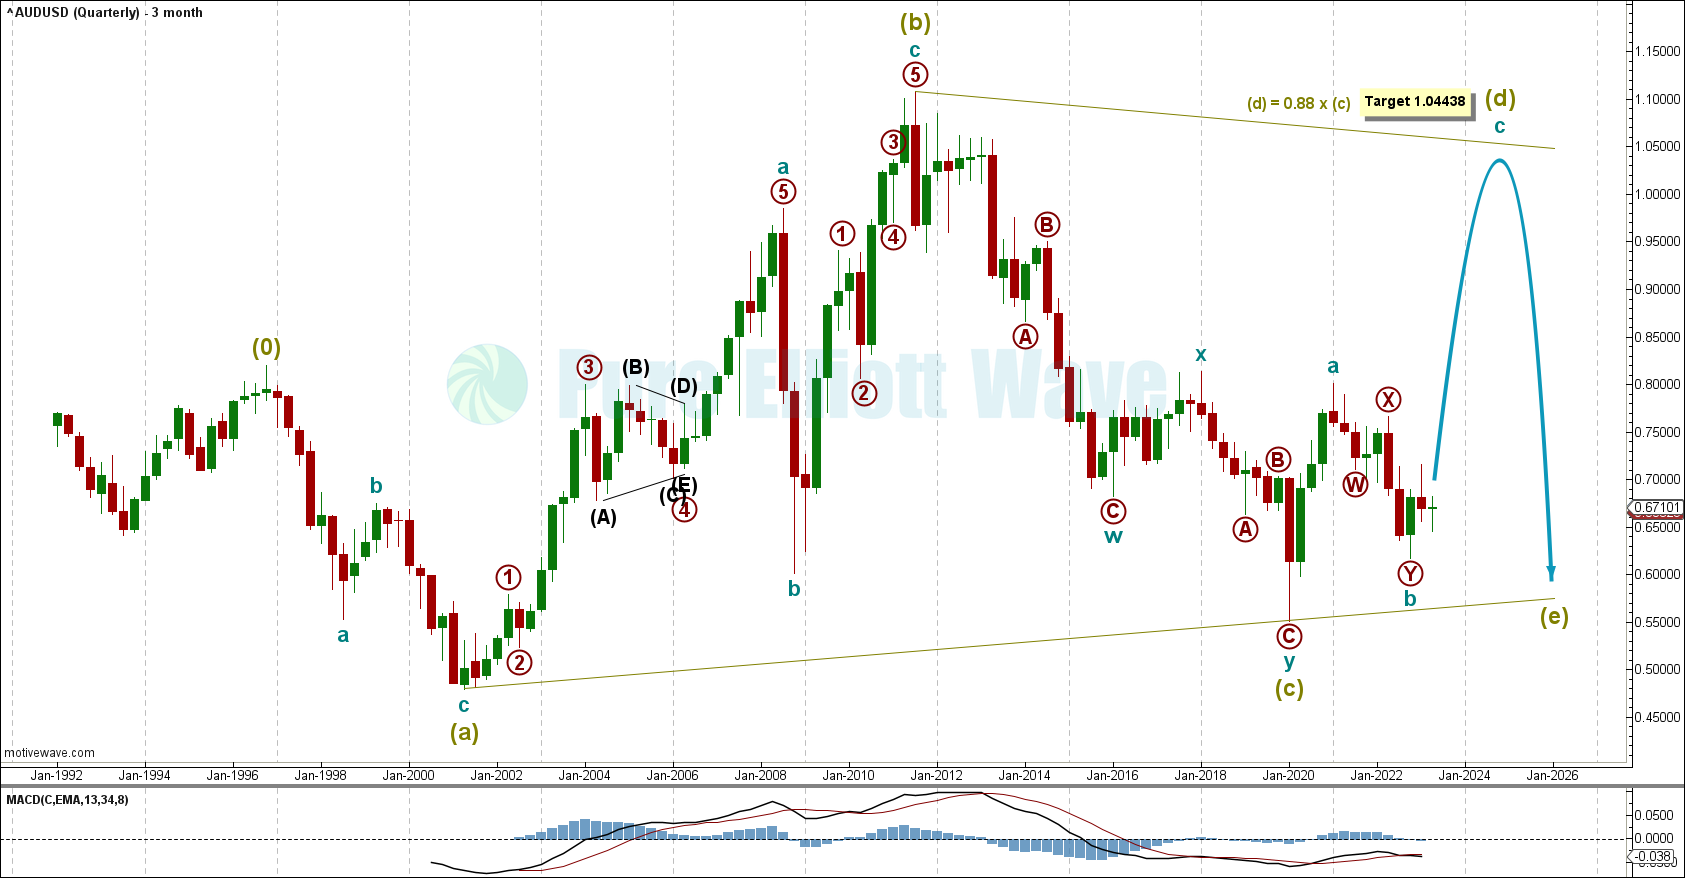
The quarterly chart shows most of the price history of the AUDUSD.
With supercycle wave (b) being a clear zigzag corrective structure, and supercycle wave (c) also being a 7 wave structure that did not make new lows, a contracting triangle is shown for our main AUDUSD count.
With supercycle wave (c) likely complete, supercycle wave (d) may be underway upwards and must subdivide as a zigzag.
This correlates well with the overall negative relationship with the U.S. Dollar index that only shows negative 20-90% correlation (see monthly technical chart). While this is not reliable for monthly, weekly, and daily candlesticks, it gives us a general negative correlation that fits with the current DXY and EURUSD forecasts.
Within a regular contracting triangle, waves c, d and e often retrace the same percentage as the preceding wave. With supercycle wave (c) retracing 88% of supercycle wave (b), this gives us a target for supercycle wave (d) of 1.04438.
MONTHLY CHART
Click chart to enlarge.
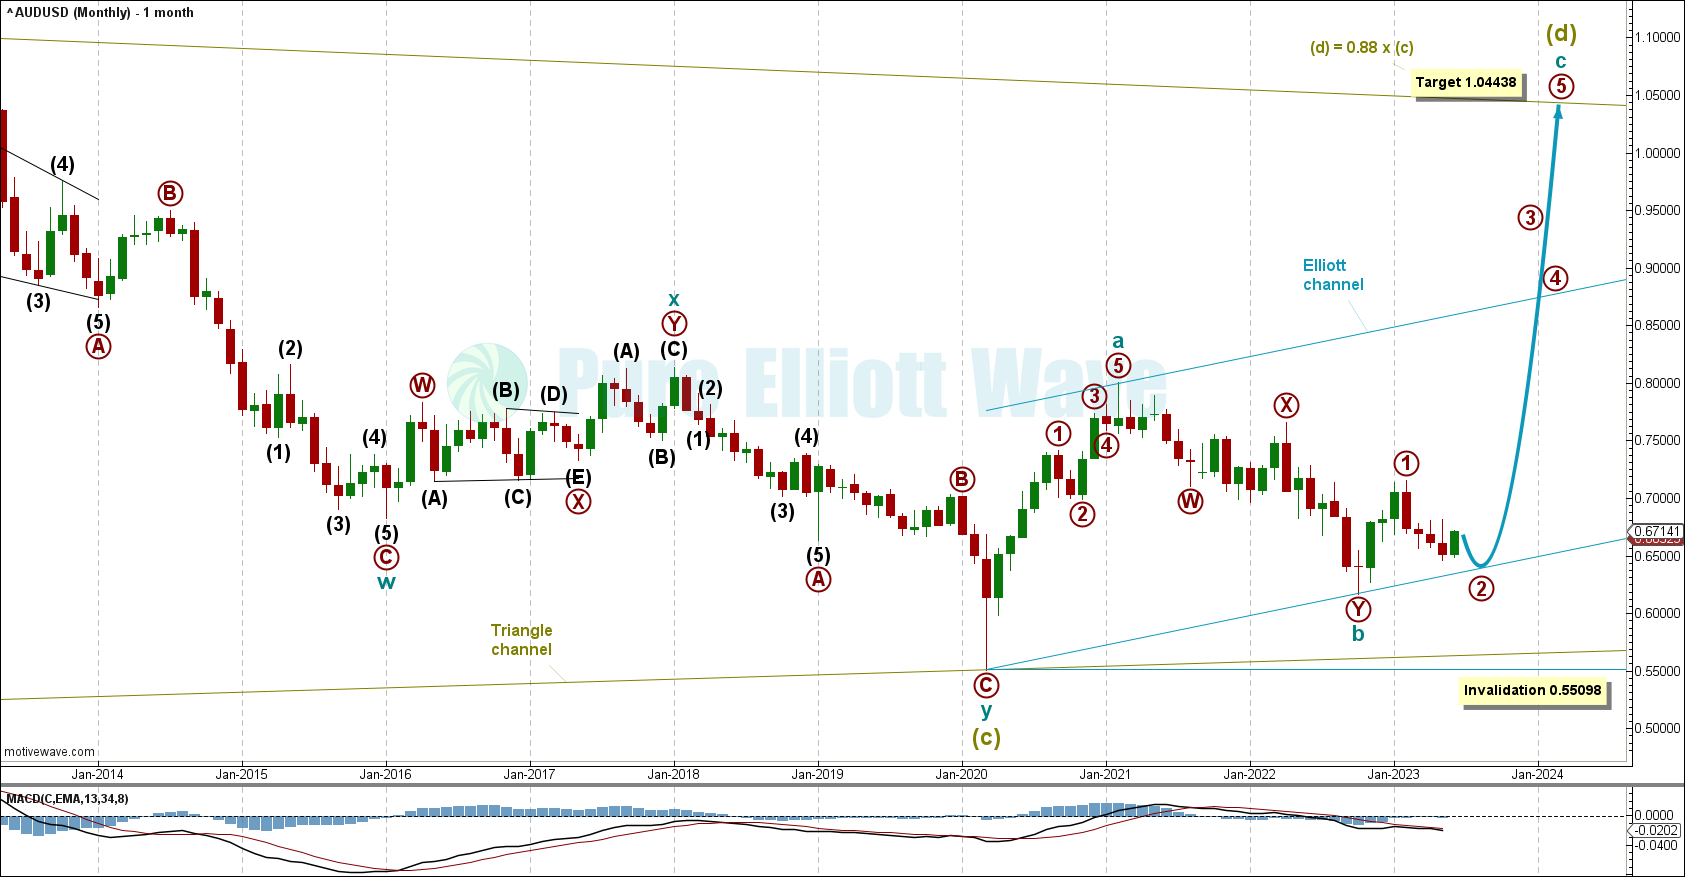
The monthly chart focuses on supercycle wave (c) and the start of suspercycle wave (d).
With supercycle wave (c) possibly complete as a double zigzag, supercycle wave (d) must subdivide as a zigzag. Only one triangle sub-wave may subdivide as a multiple.
Within supercycle wave (d): Cycle waves a and b may be complete with cycle wave c having primary wave 1 complete and primary wave 2 expected to pull back further. The target of 1.04438 may seem far off, but that level also corresponds well with the 1.618 fibonacci extension of cycle wave a at 1.02106 (not pictured on chart), which shows a target is realistic above 1.00000.
An Elliott channel is drawn around cycle waves a and b. The bottom edge of the channel may act as support for primary wave 2.
WEEKLY CHART
Click chart to enlarge.
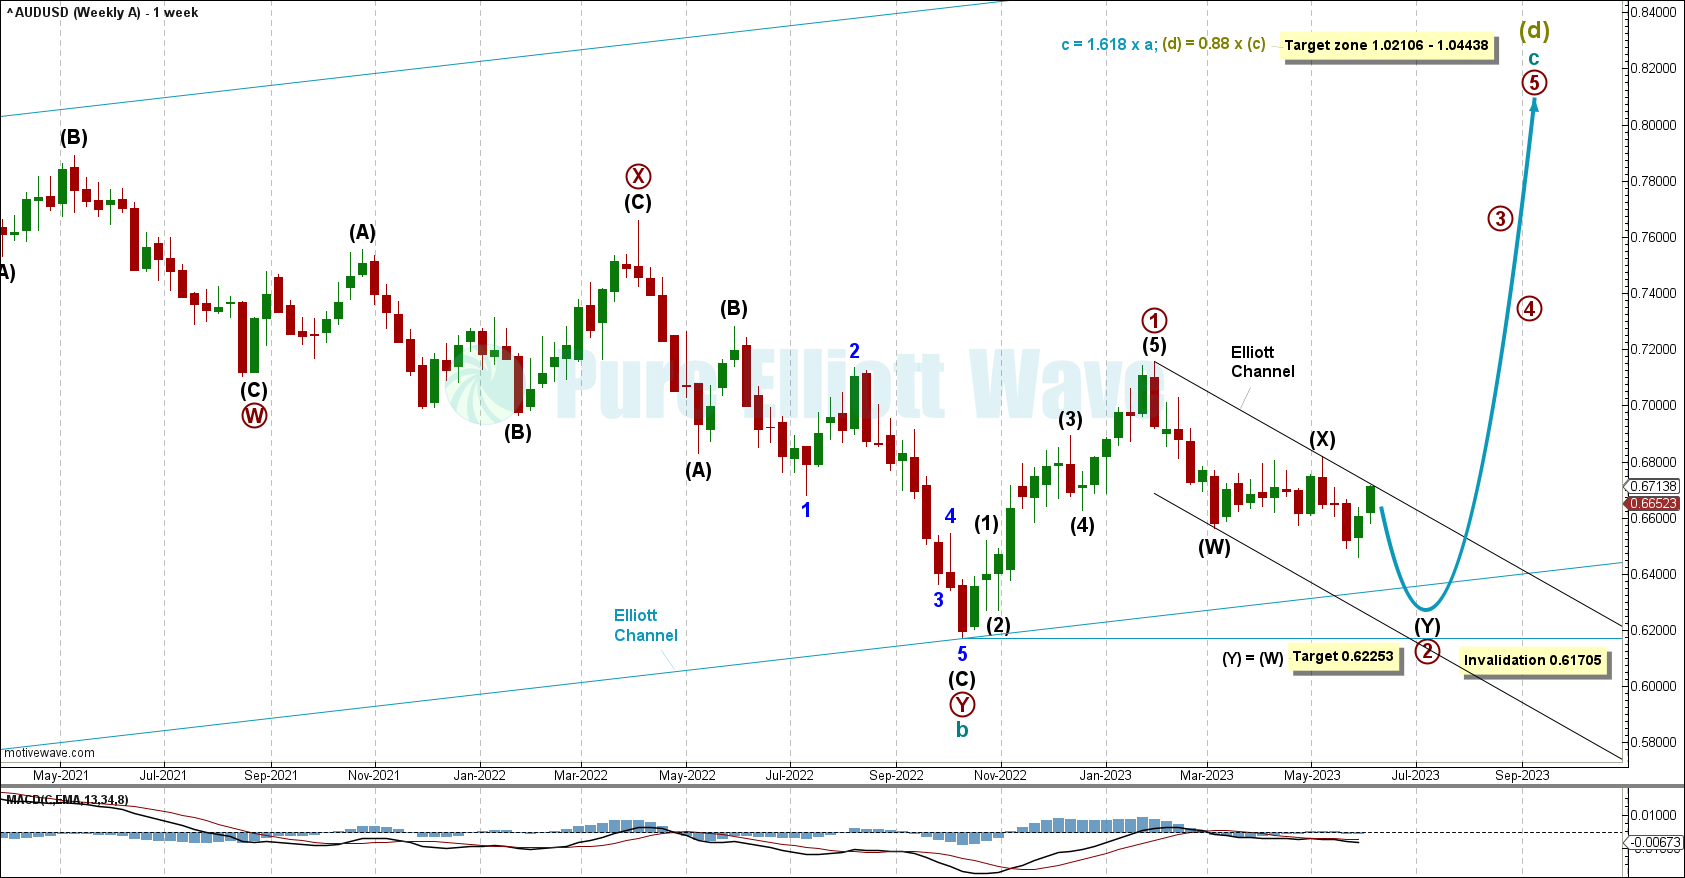
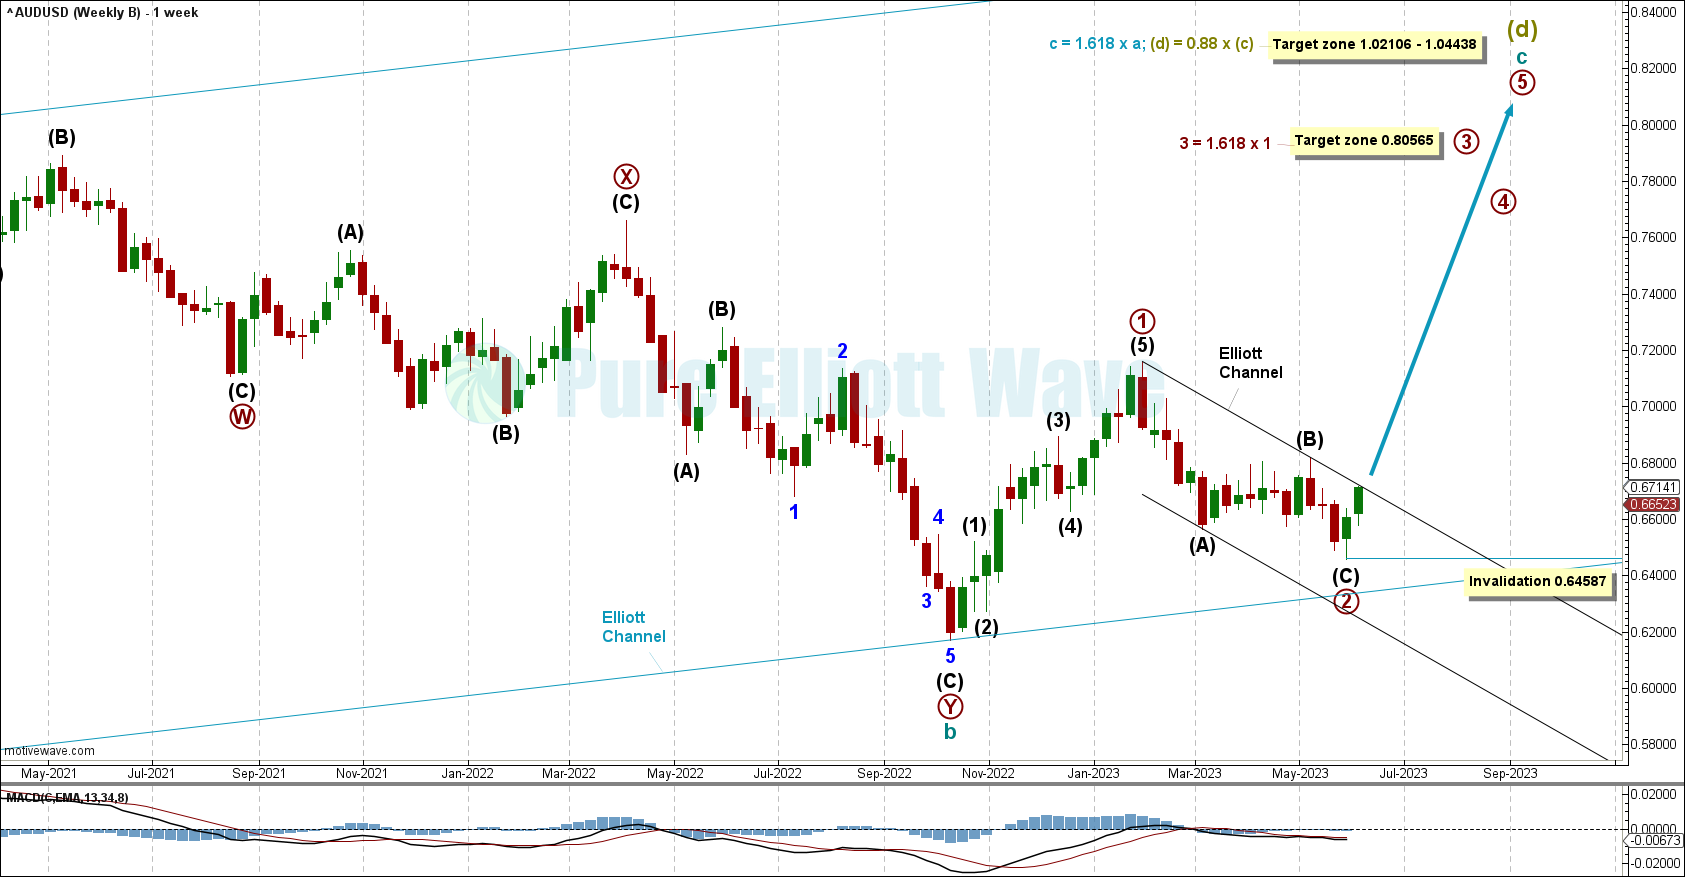
The weekly chart focuses on cycle wave b and the start of cycle wave c within Super Cycle wave (d).
Cycle wave b is a countertrend corrective movement best labeled here as a W-X-Y double zigzag. From its bottom a clean impulse can be see from October 2022 to late January 2023, which is labeled as primary wave 1 of cycle wave c.
Within cycle wave c, primary wave 2 appears to be unfolding as a sharp double zigzag correction with intermediate waves (W) and (X) complete and (Y) likely to continue down.
Intermediate wave (Y) may find support along the lower edge of the black Elliott Channel, which may bring it close to the invalidation point. A longer-term Elliott channel is in blue, which could also act as support for primary wave 2. A target has also been calculated for intermediate wave (Y) to reach equality in length with intermediate wave (W) at 0.62253.
The depth of this correction is common for wave 2 positions in a new impulse.
An invalidation for this medium-term wave count is at 0.61705 where primary wave 2 may not move beyond the start of primary wave 1.
DAILY CHART
Click chart to enlarge.
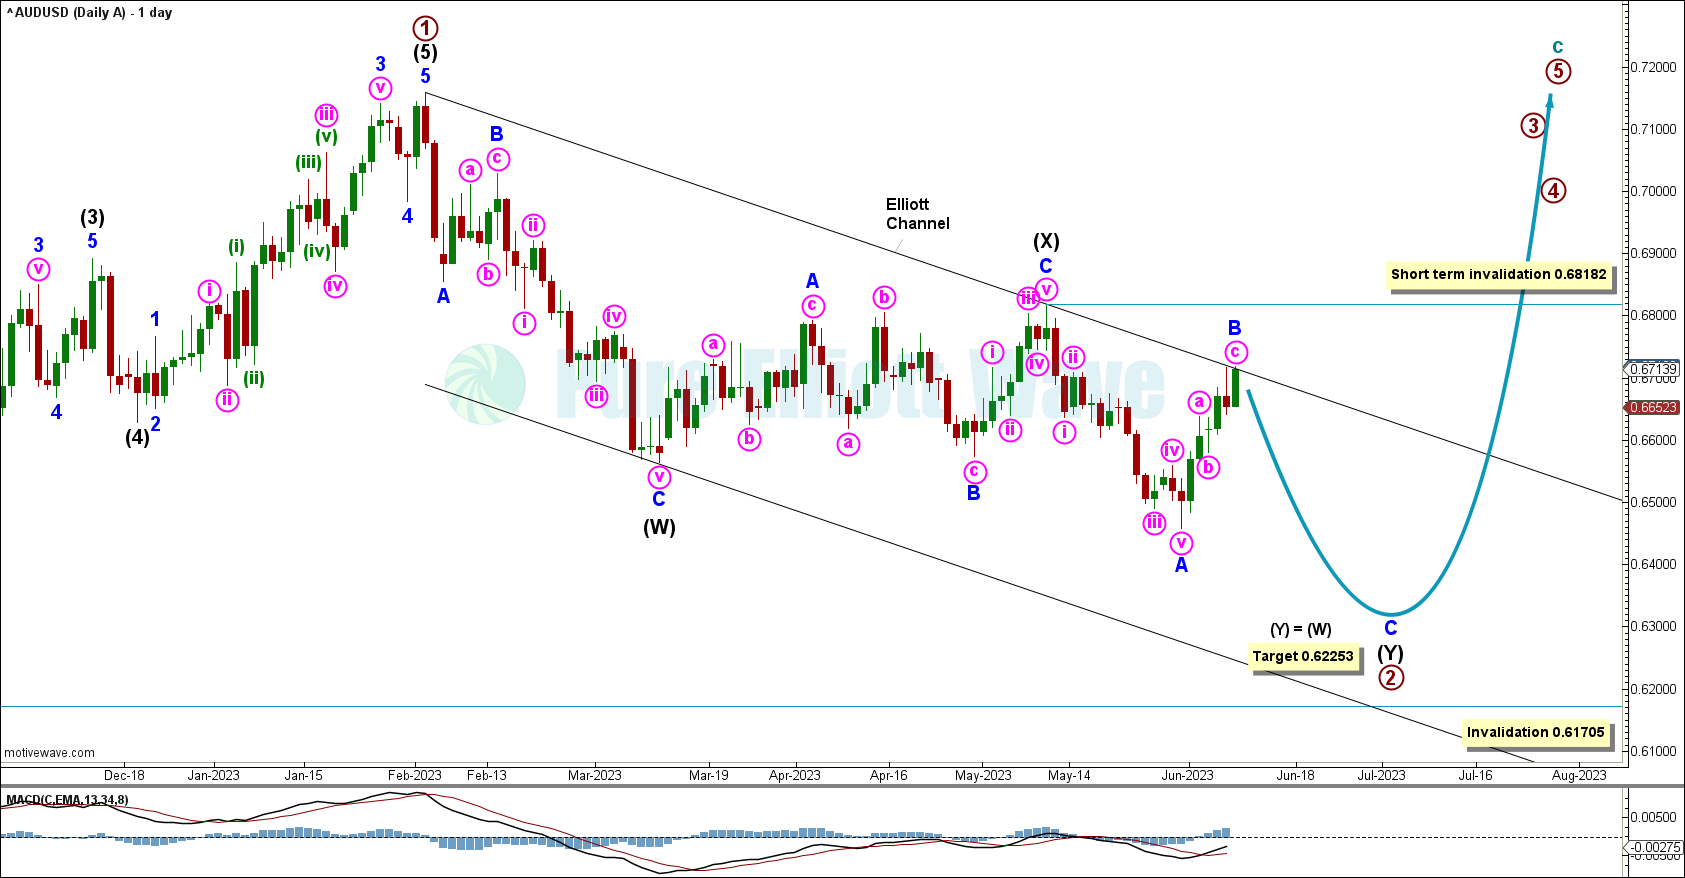
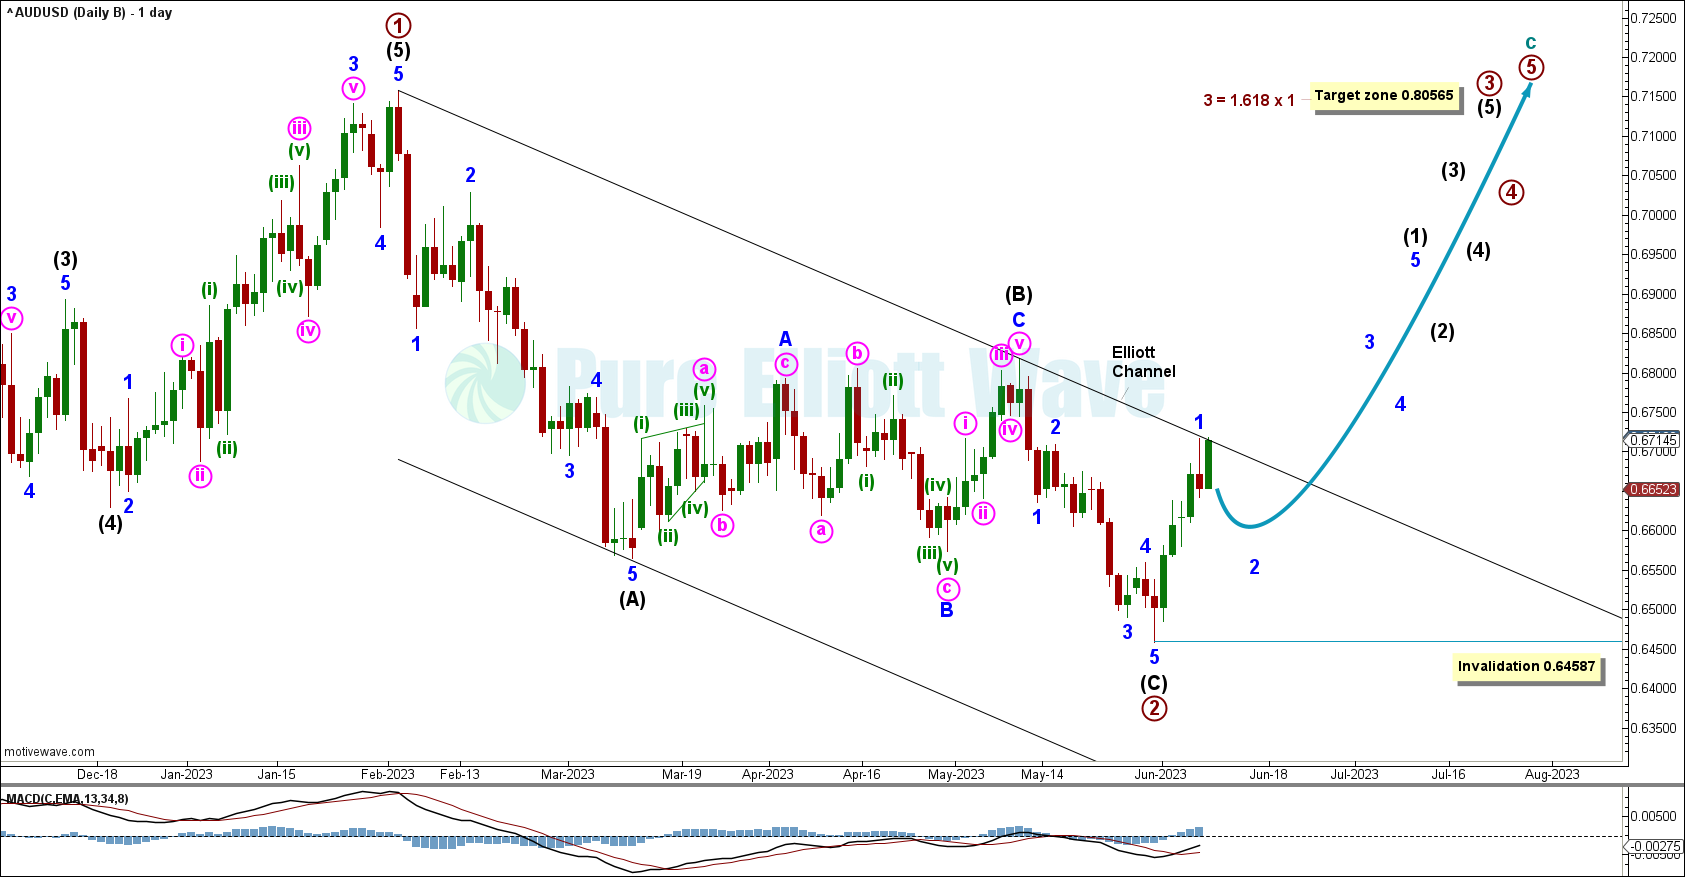
The daily chart focuses primary wave 2.
On this daily chart we can see a W-X-Y double zigzag unfolding so far inside primary wave 2. Intermediate wave (W) subdivides as a zigzag, intermediate wave (X) as an expanded flat, and intermediate wave (Y) may be underway as a zigzag.
Within intermediate wave (Y): Minor waves A and B may be complete and with C yet to unfold. Price is expected to continue falling overall until minor wave C is complete.
A breach of this Elliott channel, with price above and not touching the channel, would make this count much less likely.
Price moving over 0.68182 would invalidate the double zigzag count. At that point, minor wave B may not move beyond the start of minor wave A in this zigzag.
A target is calculated for intermediate wave (W) to reach equality with intermediate wave (A) at 0.62252, corresponding well with the edge of the black Elliott channel.
WEEKLY ALTERNATE CHART
Click chart to enlarge.
The alternate weekly chart sees primary wave 2 over and primary wave 3 unfolding upwards.
Within cycle wave c, primary wave 2 appears to be complete as a sharp zigzag correction with intermediate waves (A), (B), and (C) complete. This correction has already reached the 0.618 retracement, which sharp second waves usually meet.
A target has been calculated for primary wave 3 to reach the 1.618 Fibonacci extension of primary wave 1 at 0.80565.
An invalidation for this medium-term wave count is close by at 0.64587. A second wave correction may not move beyond the start of primary wave 3.
This count has less confidence than the main due to the technical charts.
DAILY ALTERNATE CHART
Click chart to enlarge.
The alternate daily chart focuses on primary wave 2 as complete.
With primary wave 2 complete, primary wave 3 may be underway upwards in its very early stages.
Minor wave 1 of intermediate wave (1) is possibly complete. Minor wave 2 is now likely to retrace. An invalidation for this idea sits close below at 0.64587, where minor wave 2 may not move beyond the start of minor wave 1.
Price currently sits at the Elliott channel. If price breaks above the channel, with a full daily candlestick not touching the channel, then this count would be much more likely.
A target has been calculated for primary wave 3 to reach the 1.618 Fibonacci extension of primary wave 1 at 0.80565.
TECHNICAL ANALYSIS
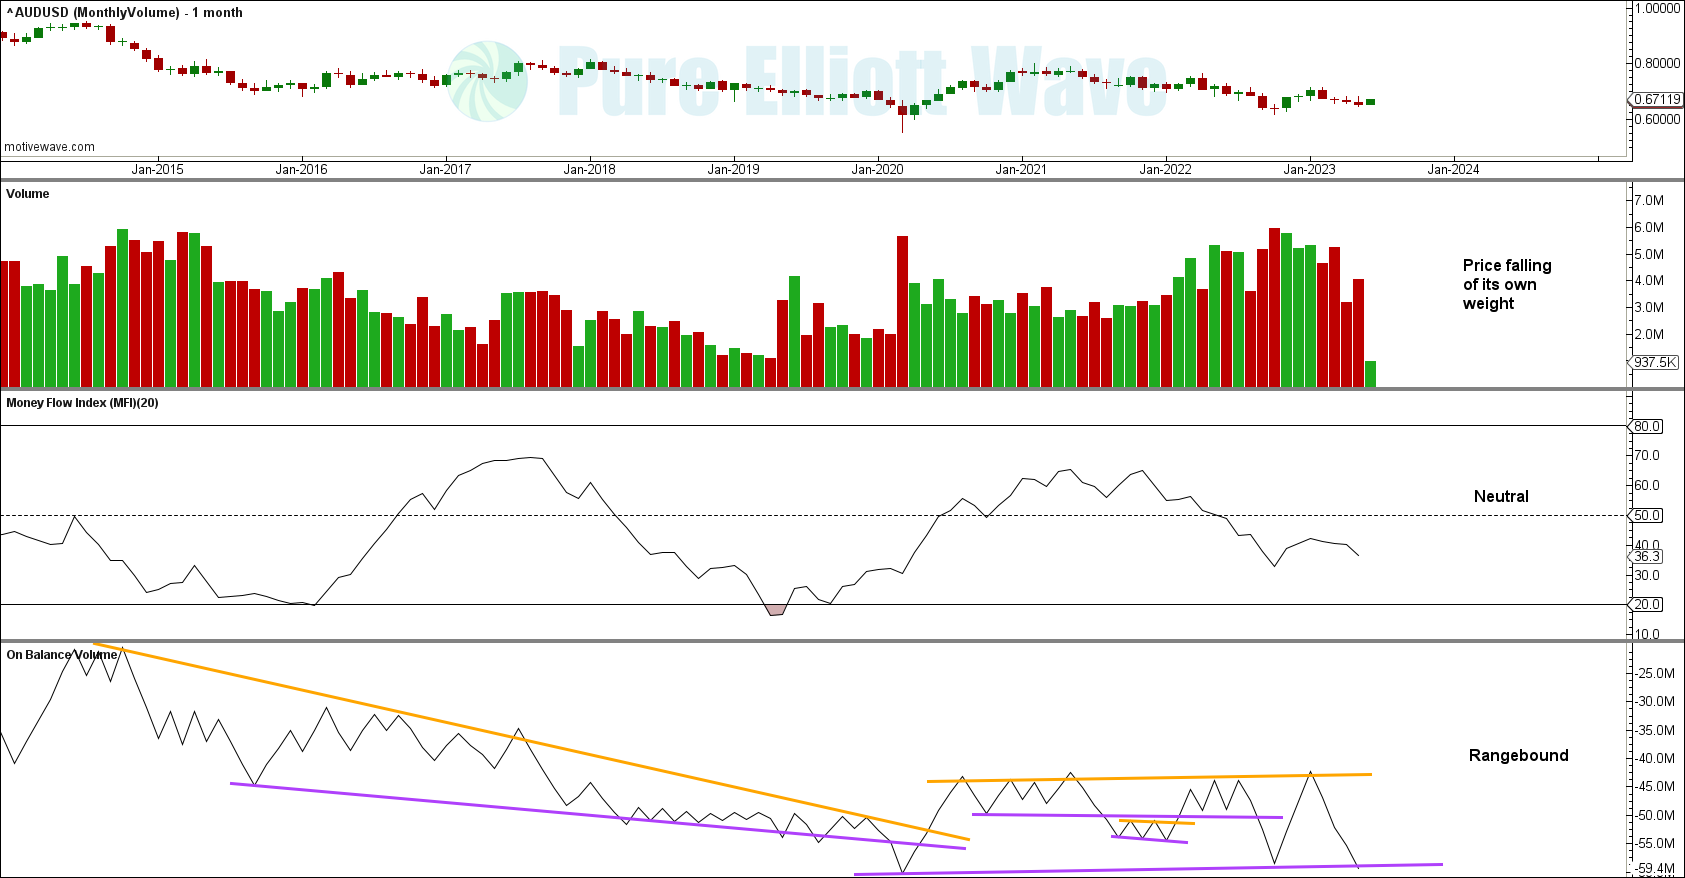
MONTHLY VOLUME
Click chart to enlarge.
On the monthly chart, price is falling of its own weight.
There is a very significant range on the On Balance Volume, with the upper orange line more significant than the lower purple. A breach of the upper orange line would support the Elliott wave count and indicate a possible price rise to over 1.0000.
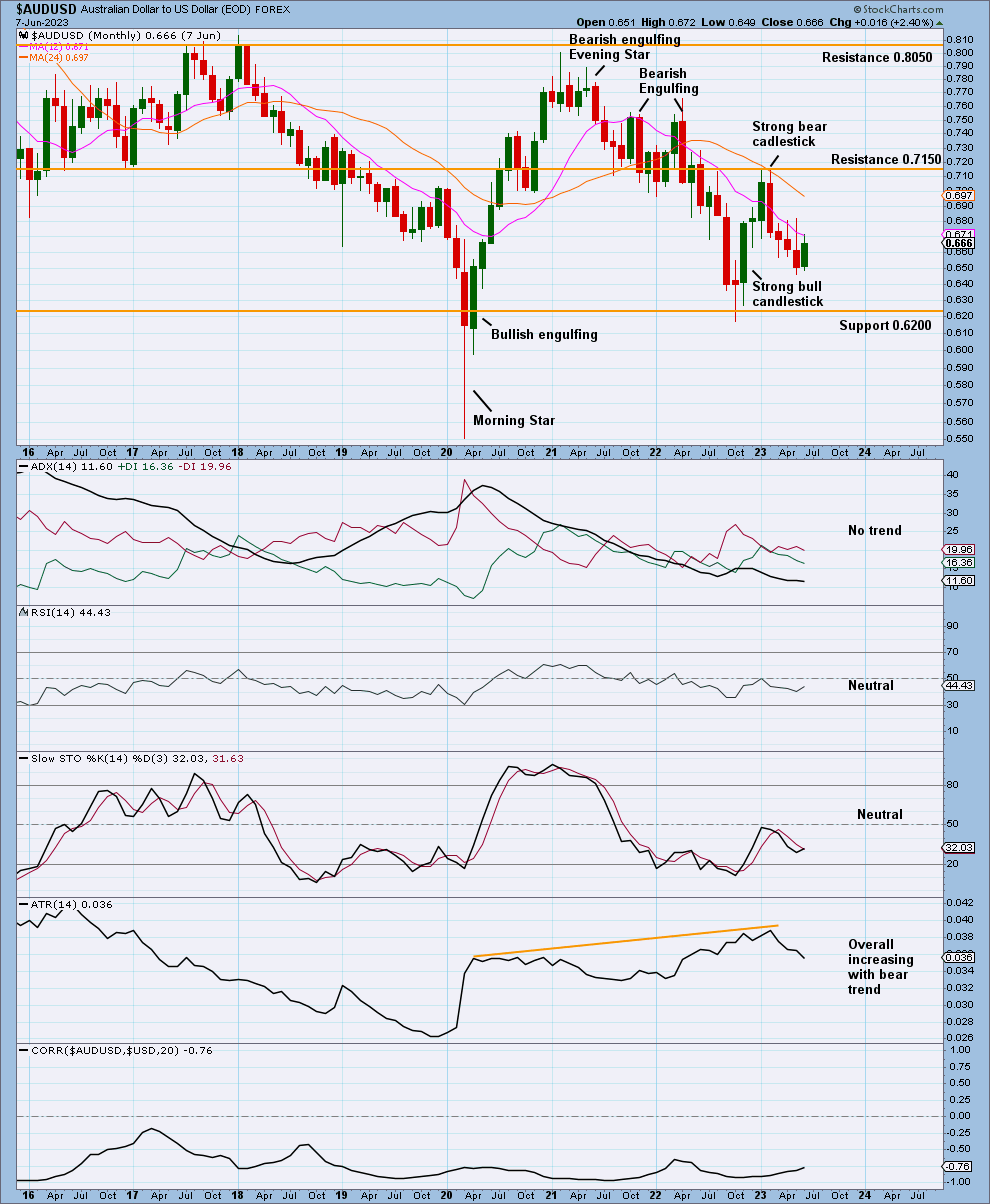
MONTHLY CHART
Click chart to enlarge.
On the monthly chart, moving averages are fully bearish.
With ADX indicating no trend, price may continue downwards until Stochastics reaches oversold and support is reached maybe at 0.6200, corresponding well with the Elliott wave counts.
While a general negative correlation can be seen between the AUDUSD and USD, it is not reliable enough to show correlated movements at monthly/weekly/daily chart levels.
WEEKLY VOLUME
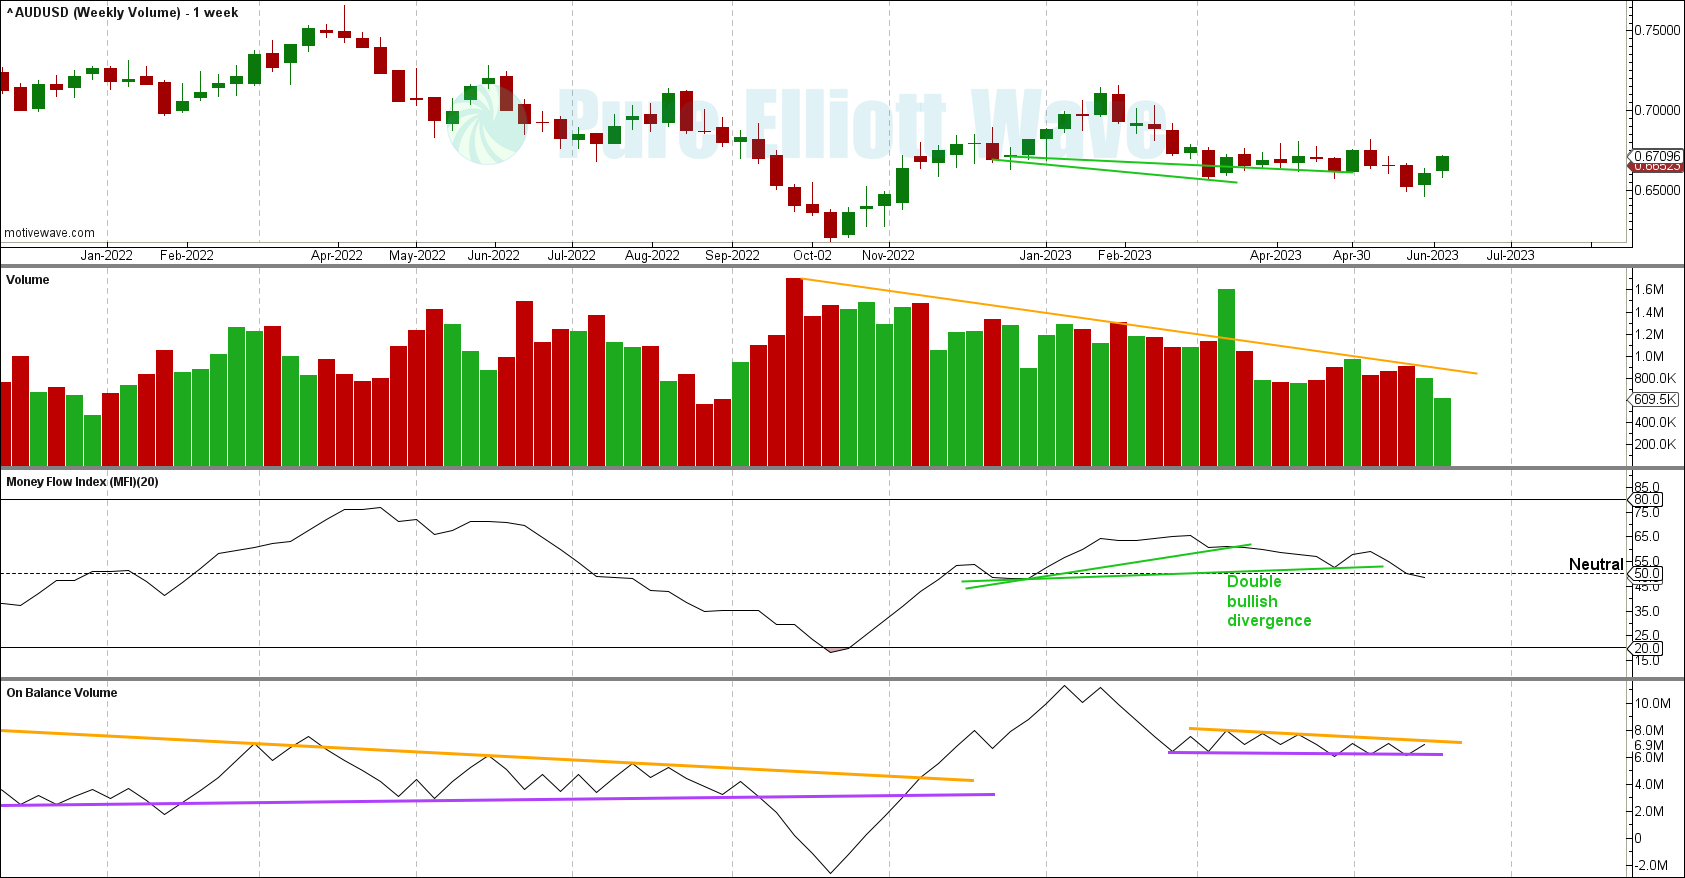
Click chart to enlarge.
Volume is decreasing with the new trend since September 2022, common for wave 1 and 2 positions. People are scared to enter the new trend, because the last bear trend is influencing their outlook of the market.
The most recent 2 weeks (new bull trend) do not have support from volume yet.
There is double bullish divergence between price and money flow, a bullish sign that this down trend could be ending soon.
On Balance Volume shows a significant range starting December 2022.
WEEKLY CHART
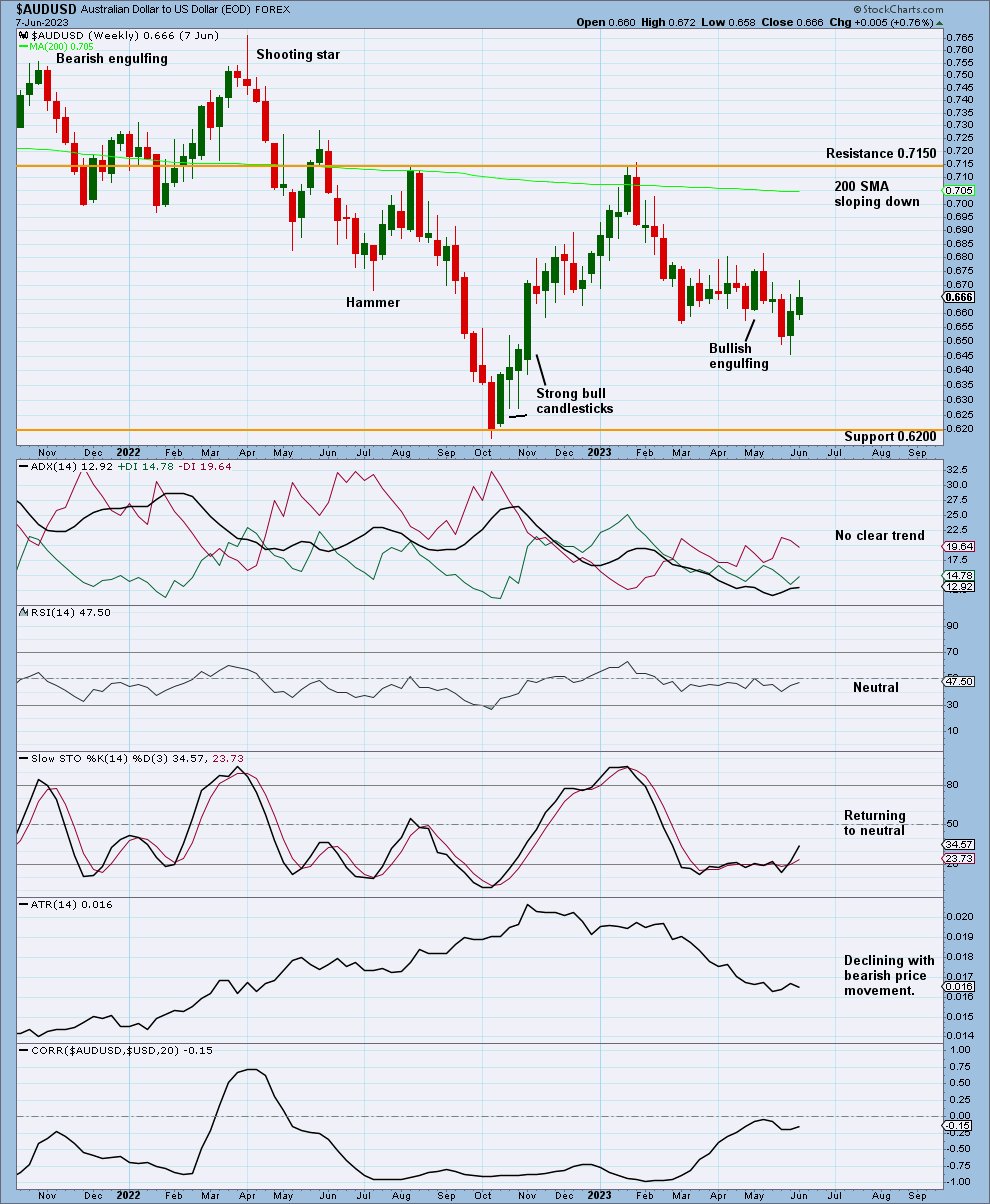
Click chart to enlarge.
The weekly chart shows the 200 day moving average sloping down and price trading below.
There has been no bottom reversal pattern to indicate a trend shift yet.
With ADX showing no clear trend, Stochastics leaving oversold, and support far away at 0.6200, price could slowly fall until support is reached at 0.6200.
If ADX rises above 15, then this would be the early stages of a bear trend, which may continue downwards until RSI reaches oversold, ADX reaches extreme, or support is reached at 0.6200
ATR suggests volatility could be limited downwards.
Correlation between the AUDUSD and DXY is unreliable at the weekly level.
DAILY VOLUME
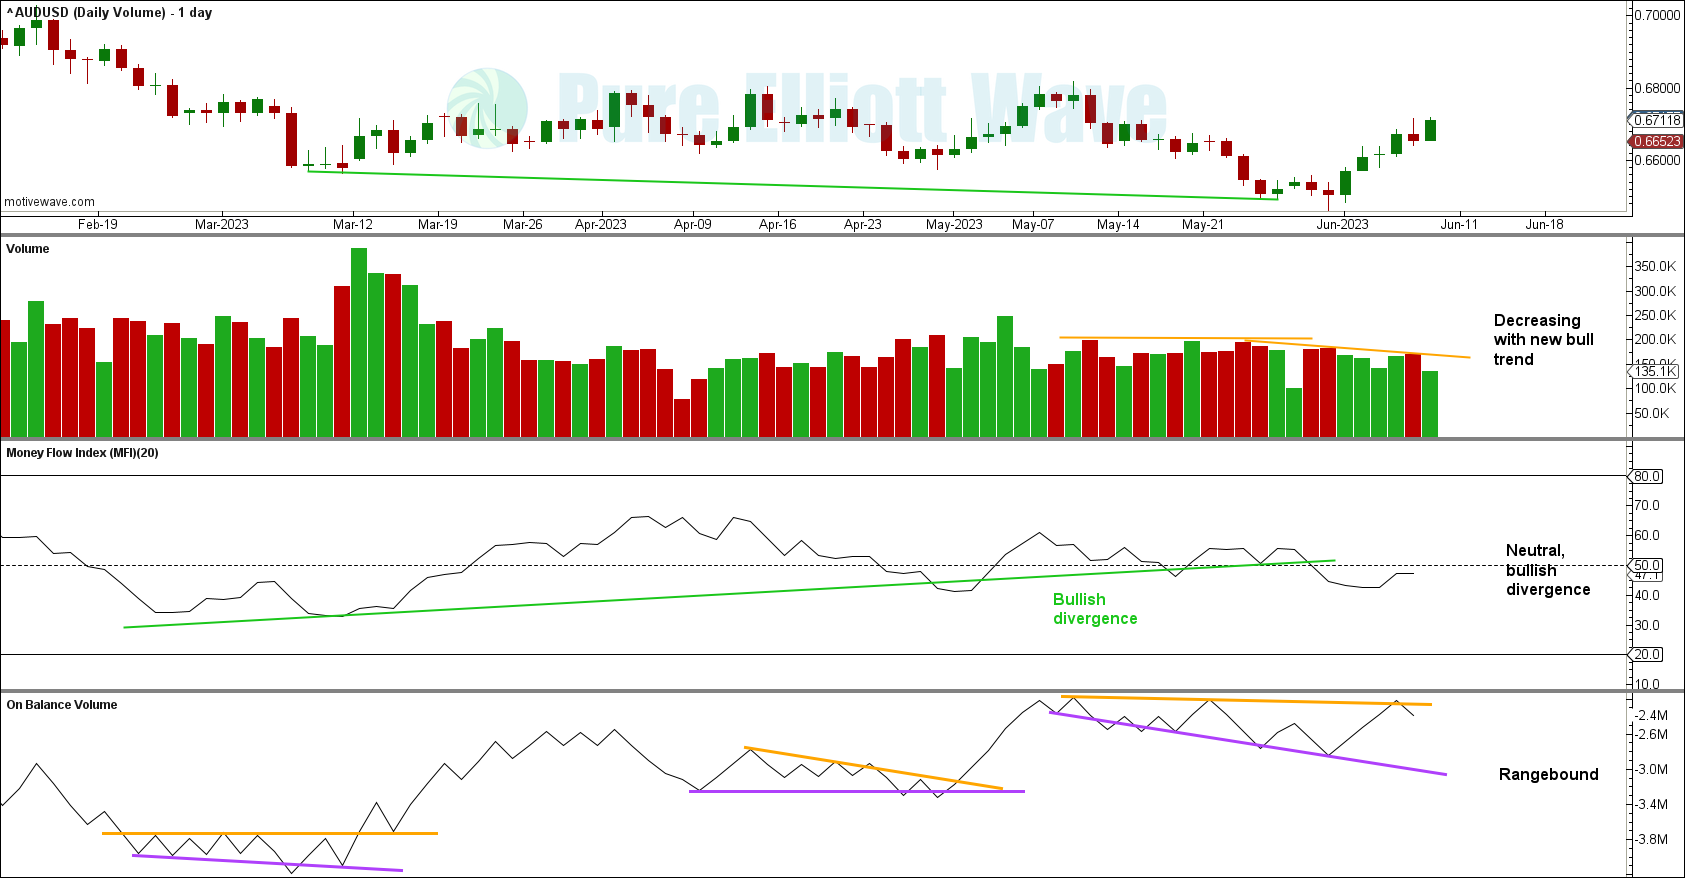
Click chart to enlarge.
Volume is decreasing with the new short term bounce.
Bullish divergence between price and money flow supports the Elliott wave count.
There is also a significant range for On Balance Volume at this time frame. On Balance Volume across all time frames indicates there could be a breakout soon.
DAILY CHART
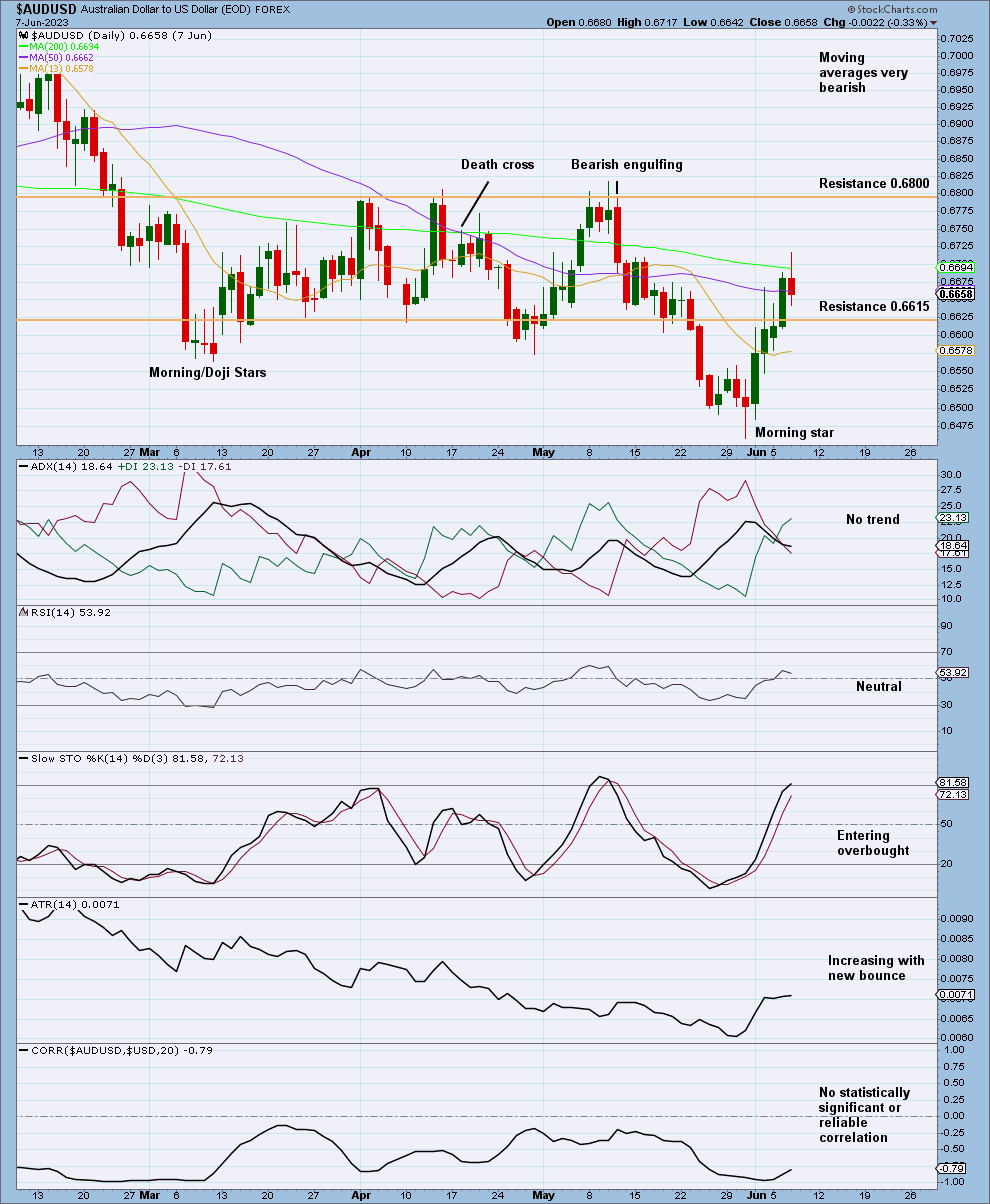
Click chart to enlarge.
A death cross happened in mid-April when the 50 day moving average crossed below the 200 day moving average, a bearish signal that had been followed through.
The recent bounce is supported by a morning star candlestick pattern at the bottom on May 31, 2023.
ADX shows no trend.
With stochastics entering overbought, upwards movement could still continue until resistance is hit at 0.6800.
The daily technicals support the alternate Elliott wave count, which expects a short-term bottom could be in with more room to move upwards.
The weekly technicals support the main Elliott wave count, showing a reversal may not yet be justified.
Key levels on both Elliott wave charts must be watched closely to choose the most likely scenario moving forward.
Published @ 08:34 p.m. ET.
—
Careful risk management protects your trading account(s).
Follow our two Golden Rules:
1. Always trade with stops.
2. Risk only 1-5% of equity on any one trade.
—
New updates to this analysis are in bold.
—
 Save as PDF