September 21, 2023: SILVER Elliott Wave and Technical Analysis – Video and Charts
Summary: Price increases as the alternate Elliott wave count expects.
Monthly charts are updated here.
BEARISH ELLIOTT WAVE COUNT
WEEKLY CHART
Click chart to enlarge.
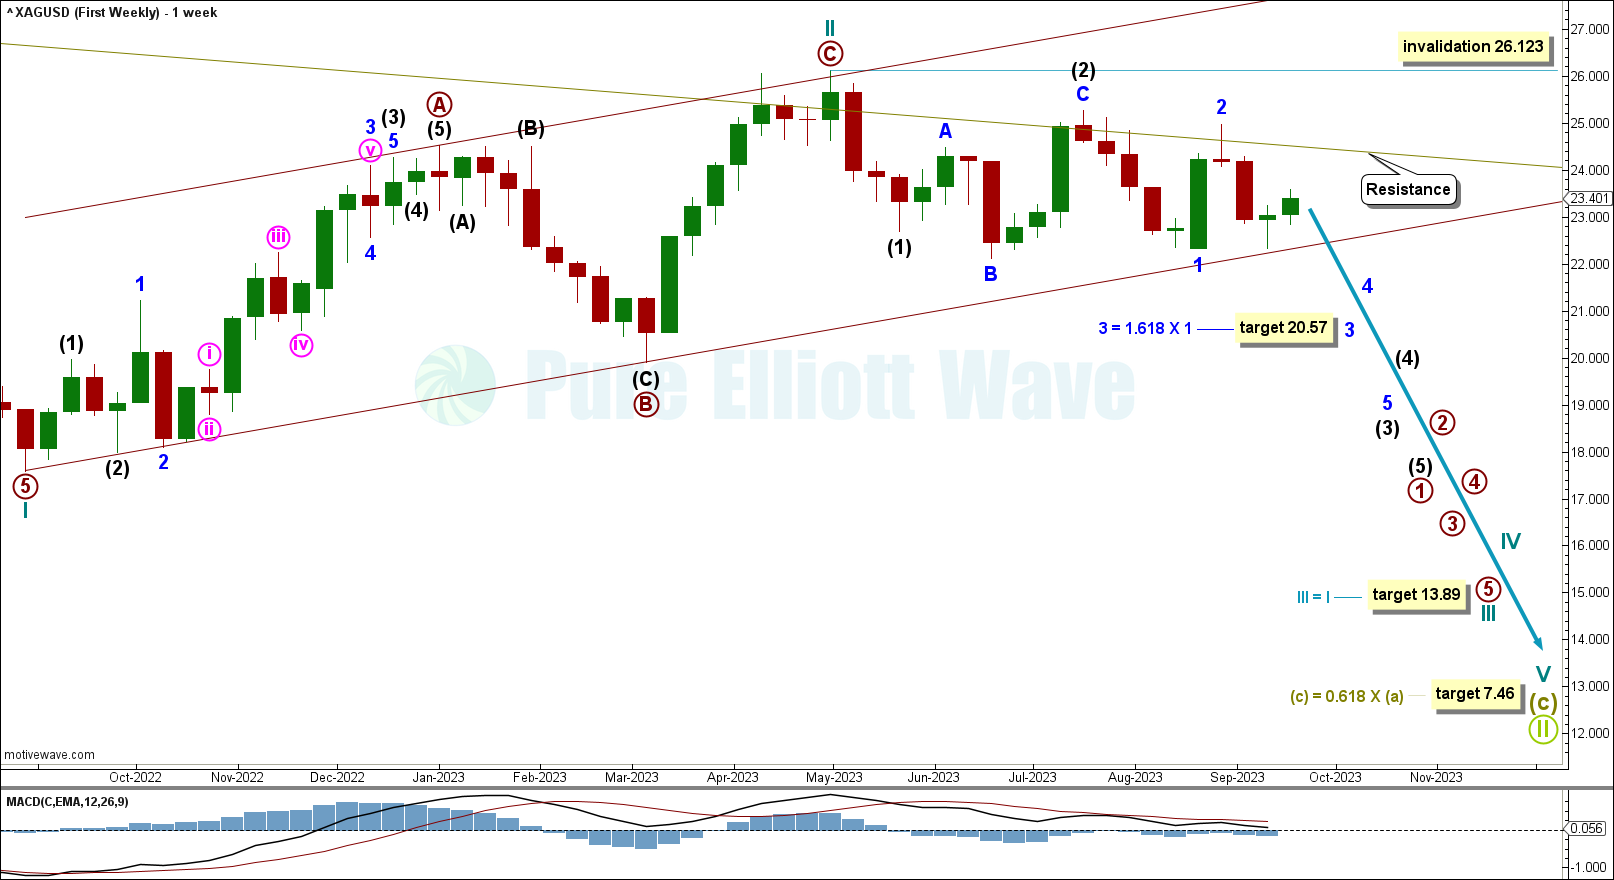
There are two possible structures that Supercycle wave (c) may subdivide as, an impulse (more likely) or an ending diagonal (less likely). An impulse requires cycle wave I to subdivide as a five wave motive structure. Cycle wave I fits well as an impulse, which indicates Supercycle wave (c) would most likely be subdividing as an impulse.
Within the impulse, cycle waves I and II may be complete, with price now moving down for cycle wave III.
Cycle wave III is expected to be in its third intermediate wave of its first primary wave. Intermediate waves (1) and (2) may be complete. It is possible that intermediate wave (2) continues higher, though it cannot move above the start of intermediate wave (1) at 26.123.
If price breaks below the lower edge of the Elliott channel drawn around cycle wave II, then there will be added confidence that cycle wave III has begun, expecting to pull price lower.
Price is now expected to move lower for third waves at minor, intermediate, and cycle degrees.
Minor wave 3 has a target calculated to reach 20.57, the 1.618 Fibonacci ratio of minor wave 1.
Cycle wave III has a target calculated at 13.89, which is equality in length with cycle wave I.
Supercycle wave (c) has a target calculated at 7.46, the 0.618 Fibonacci ratio of Supercycle wave (a).
DAILY CHART
Click chart to enlarge.
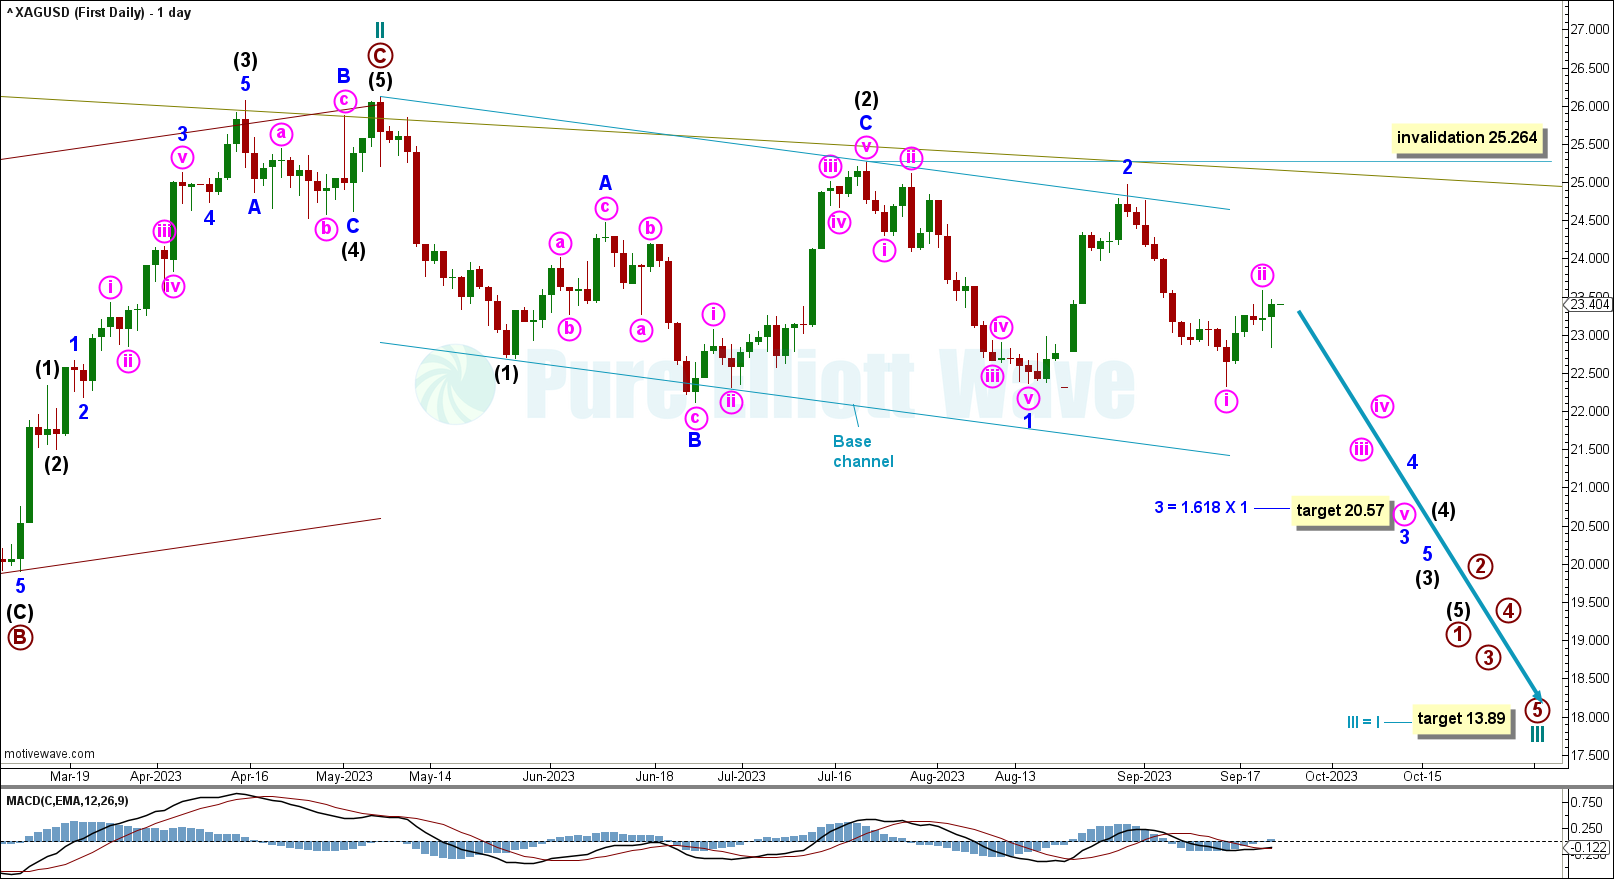
Cycle wave III has to unfold as an impulse.
Within primary wave 1: Intermediate waves (1) and (2) may be complete and intermediate wave (3) must move lower and can only subdivide as an impulse.
Within intermediate wave (3): Minor waves 1 and 2 may be complete.
Minor wave 3 is expected to pull price lower, with minute wave iii in its early stages.
If minute wave ii continues higher, it may reach 23.968, the 0.618 Fibonacci ratio of minute wave i.
This wave count expects overlapping third waves at minute, minor, and intermediate degrees, which should unfold with increased downwards momentum. At these degrees, the third waves should be unmistakable.
Within intermediate wave (3), a second wave corrective movement cannot move above 25.264.
If price moves below the last low of primary wave B within cycle wave II at 19.909, then there will be added confidence to this wave count as at that point the alternate wave count below would be invalidated.
A base channel is drawn about intermediate waves (1) and (2). The first trend line is drawn from the start of intermediate wave (1) to the end of intermediate wave (2), then a parallel copy is placed on the end of intermediate wave (1). Minor wave 2 has found resistance perfectly at the upper edge of this base channel. Intermediate wave (3) should have the power to breach the lower edge of the base channel. Prior to a breach, the lower edge may provide support for a bounce. After a breach, the lower edge may provide resistance for a back test.
BULLISH ELLIOTT WAVE COUNT.
WEEKLY CHART
Click chart to enlarge.
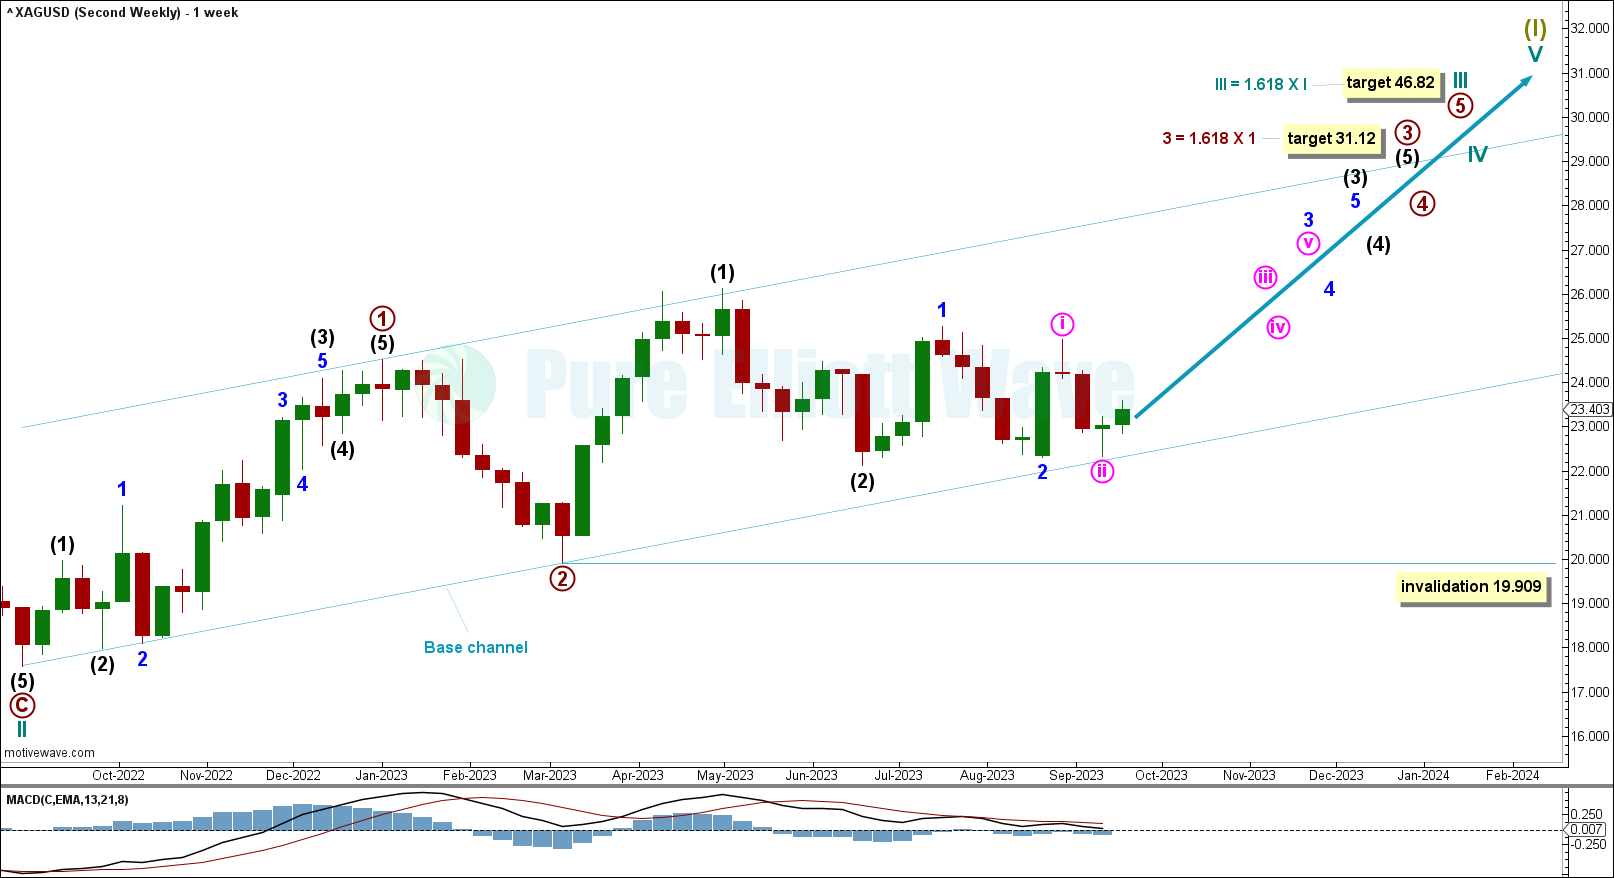
Within the trend of Supercycle wave (I), cycle wave III may have begun. Cycle wave III may only subdivide as an impulse. Within the impulse, primary waves 1 and 2 may be complete. Within primary wave 3, a second wave correction may not move below 19.909.
Primary wave 3 is expected to move price higher with a target calculated at 31.12, the 1.618 Fibonacci ratio of primary wave 1.
Overlapping third waves at minute, minor, intermediate, and primary degrees are expected to pull price higher.
Overlapping third waves at these degrees should be unmistakable, and should come with increased range and momentum.
Draw a base channel about primary waves 1 and 2. Draw the first trend line from the start of primary wave 1 to the end of primary wave 2, then place a parallel copy on the end of primary wave 1. The lower edge of the base channel may show where deep corrections may find support. The current third wave movements should break out of this base channel in the direction of the trend. If the base channel is breached by downwards movement, then the probability of this alternate wave count would further reduce.
At 46.82 cycle wave III would reach 1.618 the length of cycle wave I. This target may be met in some years.
DAILY CHART
Click chart to enlarge.
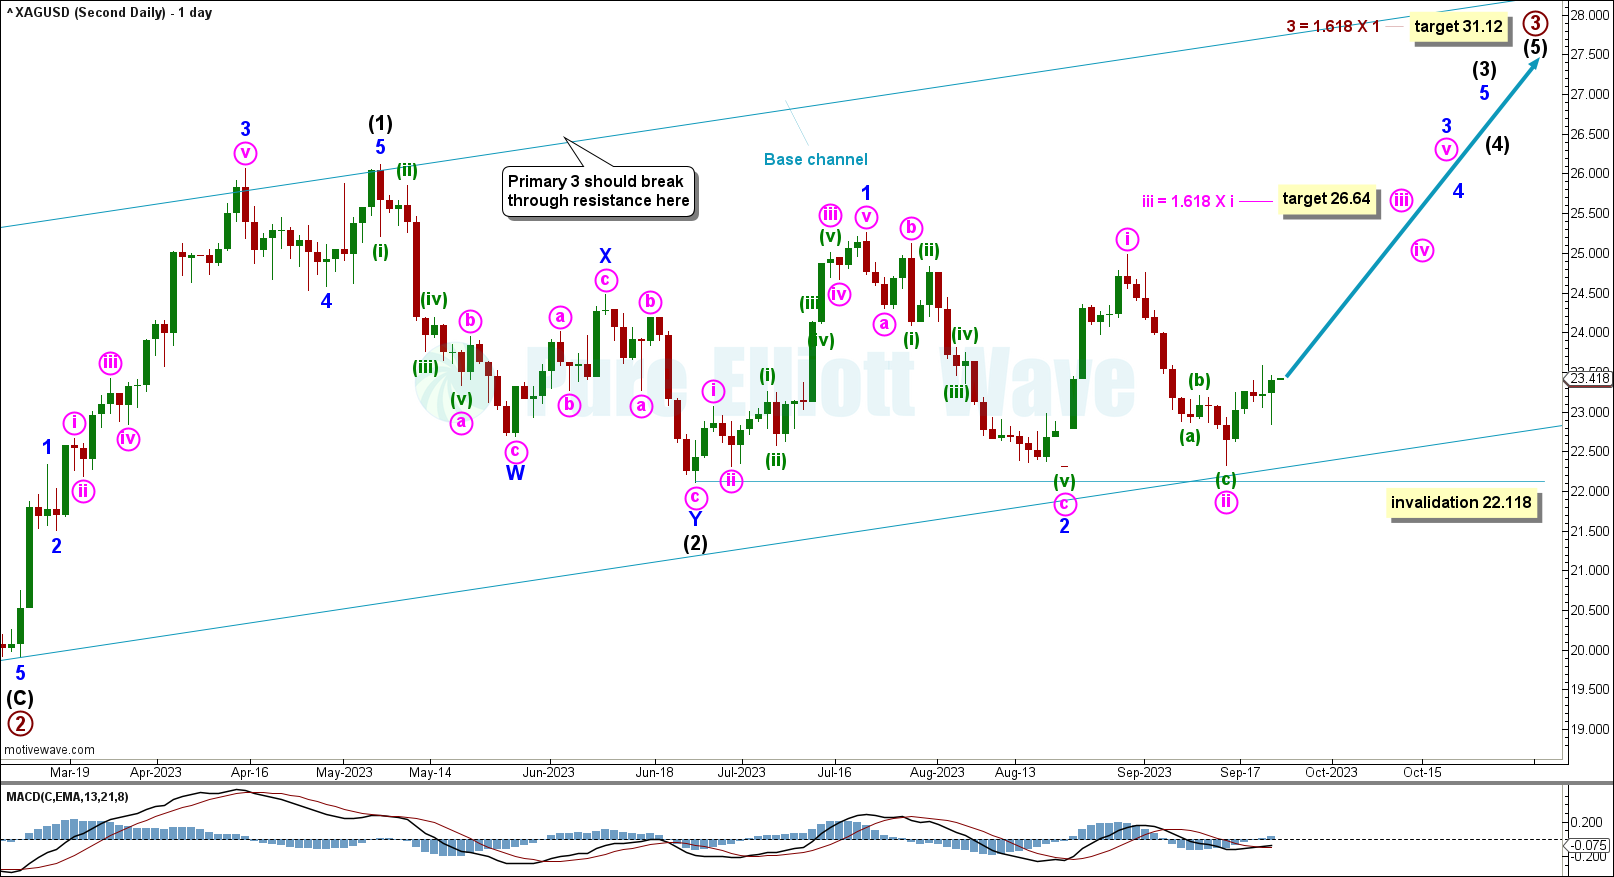
Intermediate wave (2) subdivides well as a complete zigzag; it reached the 0.618 Fibonacci ratio perfectly.
Minor wave 1 subdivides well as a complete impulse, with an extended third wave. Minor wave 2 subdivides as a complete zigzag.
Within intermediate wave (3), a second wave corrective movement cannot move below 22.118.
Minute wave ii within minor wave 3 may be complete at the low on September 14th. At this point, minute wave iii within minor wave 3 is expected to push price higher.
Minute wave iii has a target calculated at 26.64, the 1.618 Fibonacci ratio of minute wave i.
TECHNICAL ANALYSIS
WEEKLY CHART
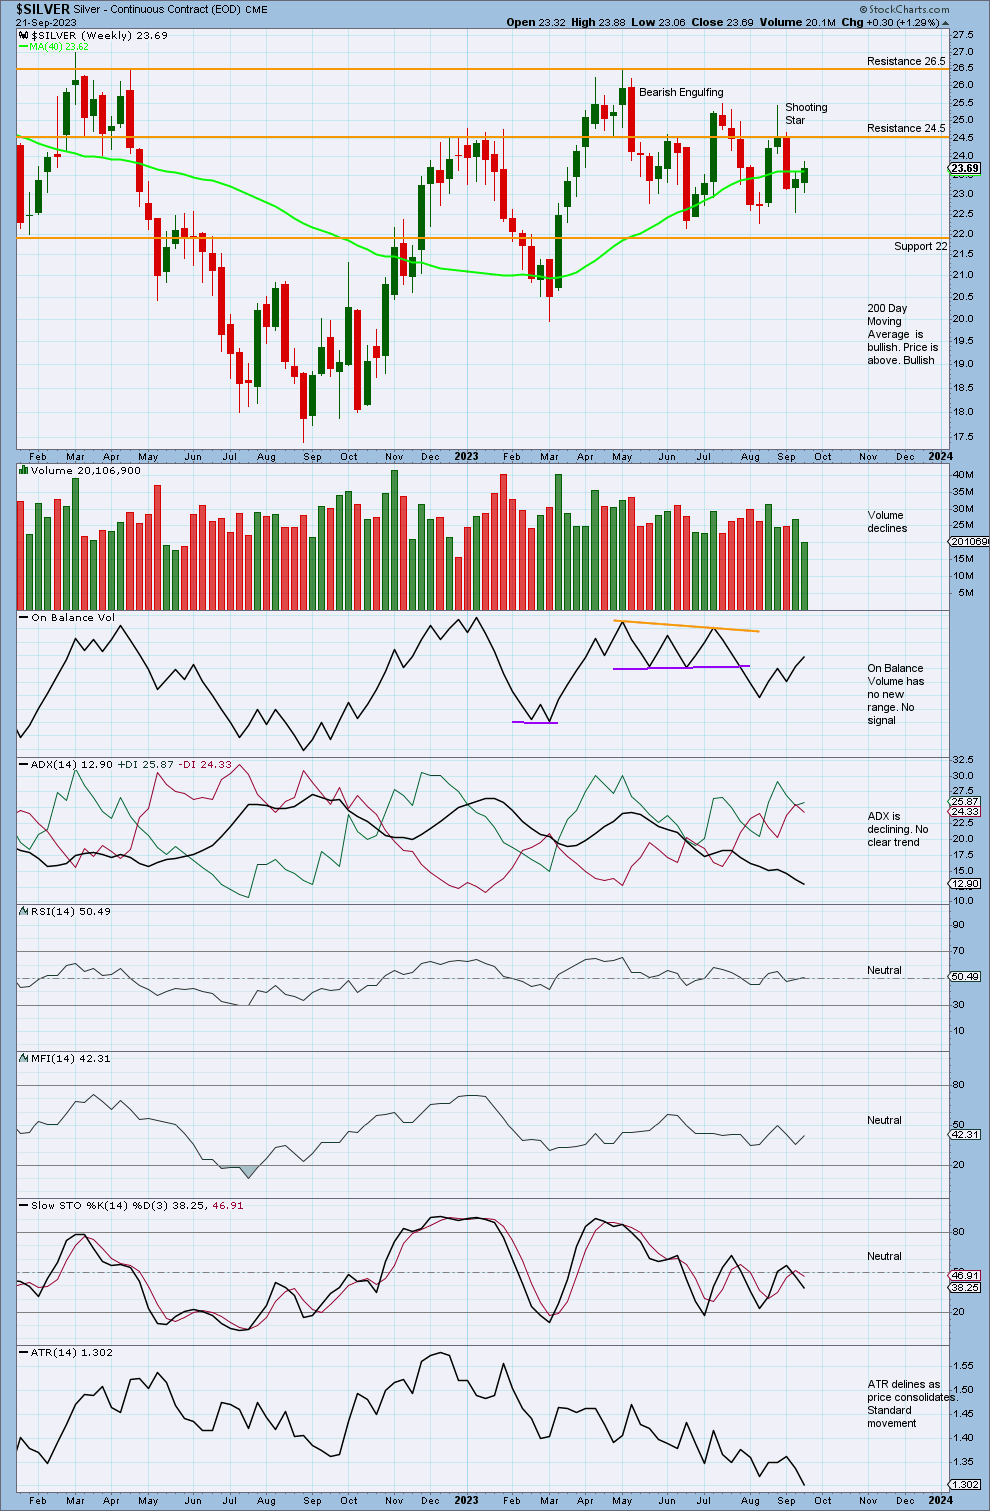
Click chart to enlarge.
Price consolidates within support at 22 and resistance at 24.5.
Volume declines, though there is overall increased volume on bullish candlesticks.
DAILY CHART
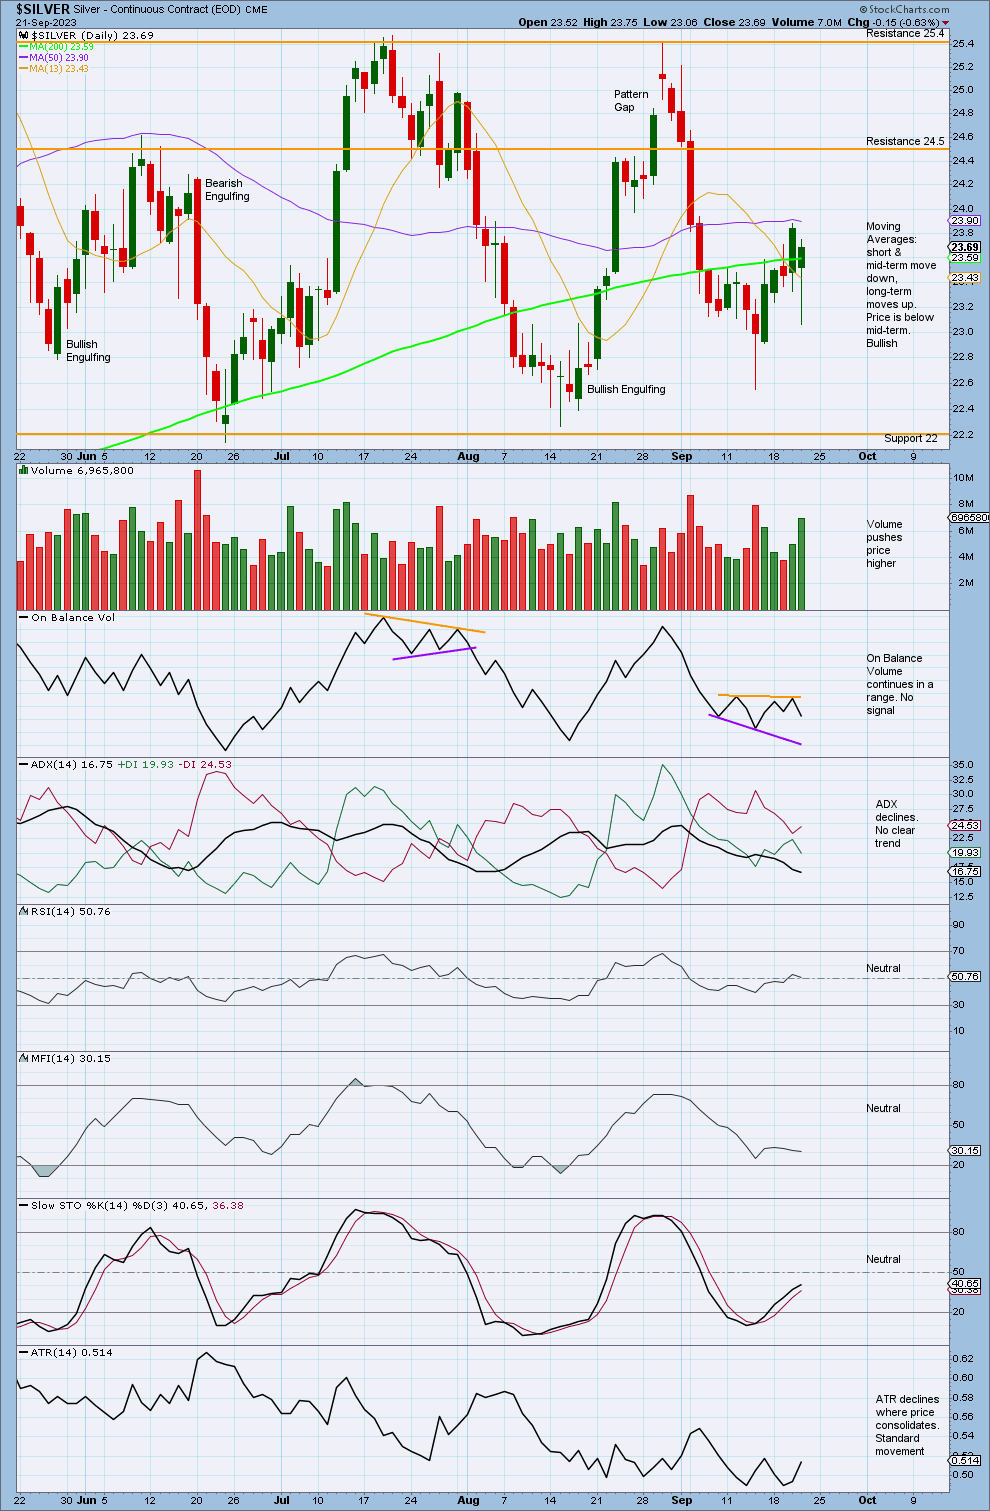
Click chart to enlarge.
Price continues to consolidate, with volume pushing price higher.
Stochastics was oversold when price fell short of support at 22 and has since then returned to neutral as the upwards price swing from mid September has continued towards resistance at 24.5.
Published @ 11:33 p.m.
—
Careful risk management protects your trading account(s).
Follow my two Golden Rules:
1. Invest only funds you can afford to lose.
2. Have an exit strategy for both directions; when to take profit and when to exit a losing investment.
—
New updates to this analysis are in bold.
—
 Save as PDF