November 28, 2023: NASDAQ Elliott Wave and Technical Analysis – Video and Charts
Summary: Price is expected to increase. The next target is at 15,019.
Note that the S&P 500 and NASDAQ do not always find highs and lows together. The last all-time high for the S&P 500 was on January 4, 2022, whereas the last all-time high for NASDAQ was November 22, 2021.
Last updated monthly charts are here.
BULLISH WAVE COUNT
WEEKLY CHART

Click chart to enlarge.
Primary wave 2 within cycle wave V is labelled complete at the October 22nd low.
Price overall increases for primary wave 3.
Primary wave 3 has a target calculated at 19,588, the 1.618 Fibonacci ratio of primary wave 1.
Within primary wave 3, any corrective movement cannot move below 12,543.86.
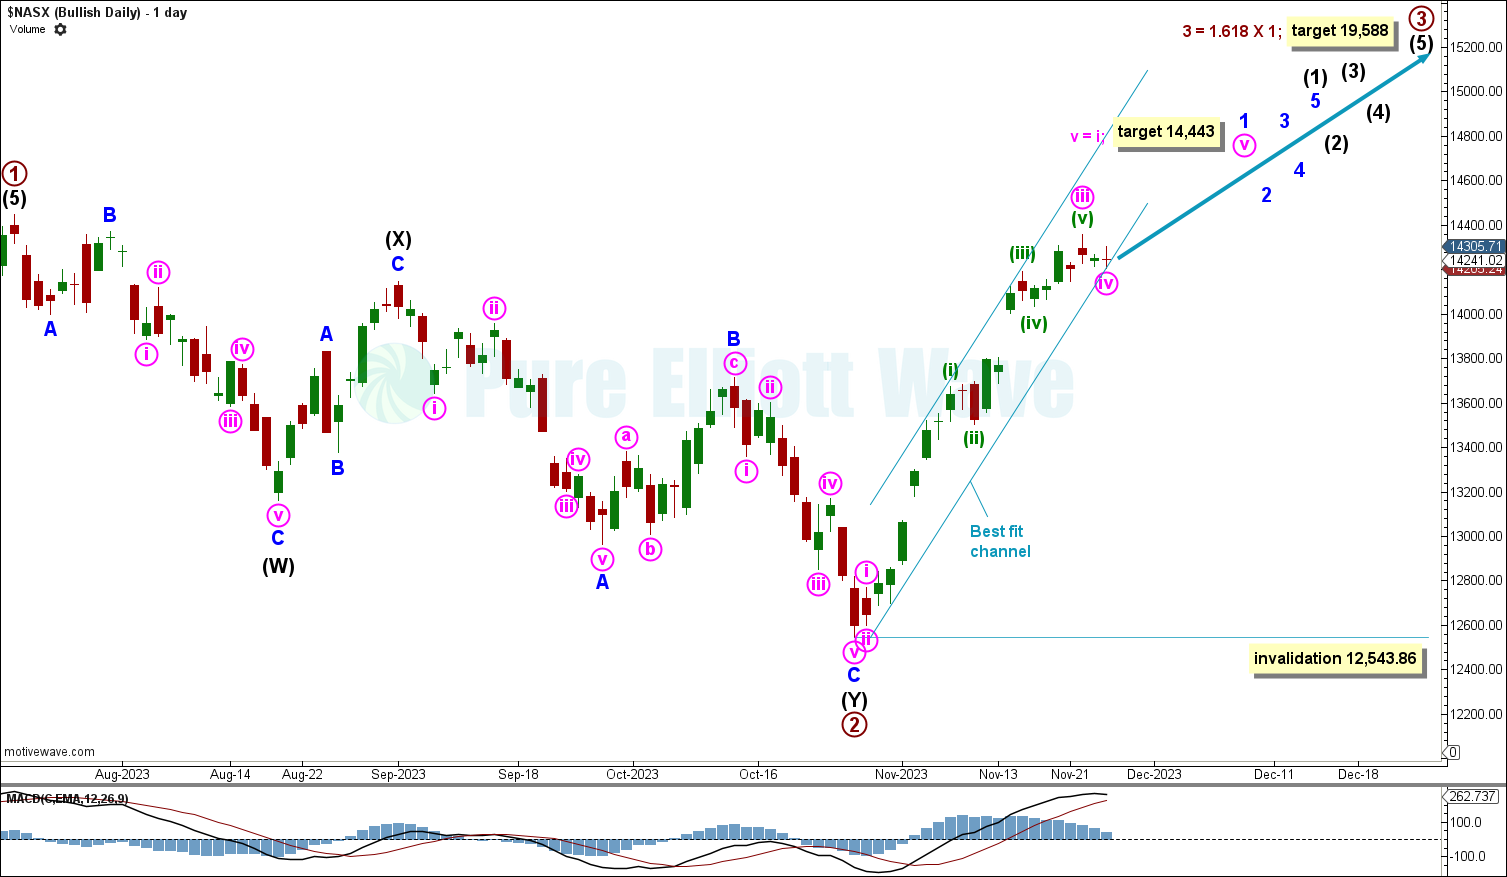
DAILY CHART
Click chart to enlarge.
Price declined recently for minute wave iv within minor wave 1.
Price is now expected to increase for minute wave v and the end of minor wave 1.
Minute wave v has a target calculated at 14,443, where it would reach equality in length with minute wave i.
A best fit channel is drawn around minor wave 1. If minute wave v increases past its target, then it may find resistance at the upper edge of this channel. Additionally, a break below this channel would give an early indication that minor wave 1 may be complete and minor wave 2 may have begun.
When minor wave 2 arrives, it cannot move below the start of minor wave 1 at 12,543.86.
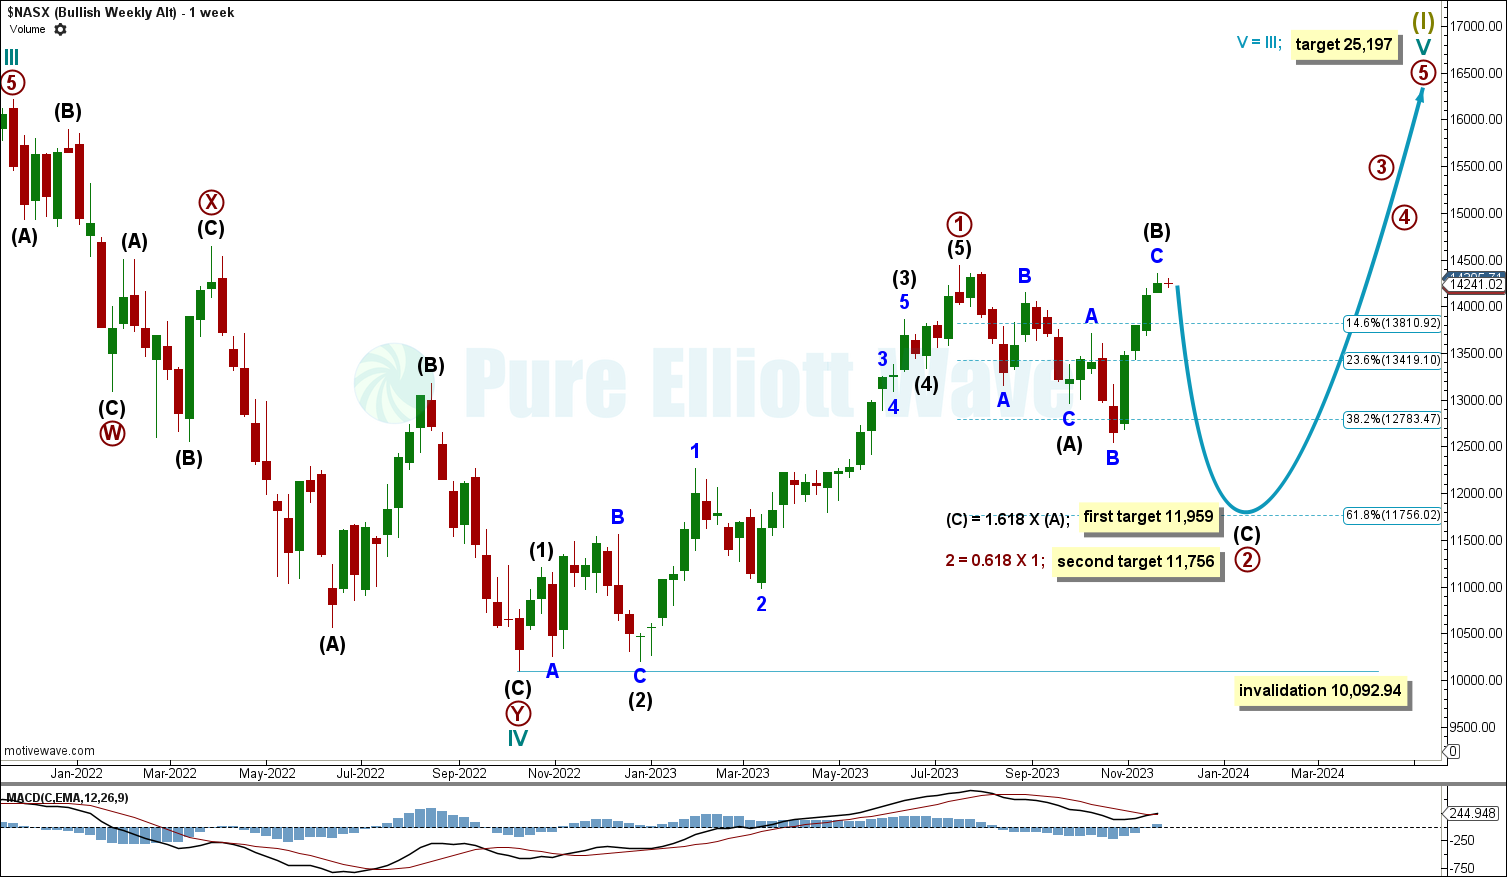
WEEKLY ALTERNATE CHART
Click chart to enlarge.
This alternate sees primary wave 2 continuing lower. It currently subdivides as a regular flat.
Intermediate wave (B) is labelled complete at the November 22nd high. Price is now expected to decline for intermediate wave (C).
Intermediate wave (B) may continue higher, however, if primary wave 2 continues as an expanded flat. Currently, intermediate wave (B) retraces 94% of intermediate wave (A) (just above the minimum retracement of 90% for a flat), though it may continue up to twice the length of intermediate wave (A).
Intermediate wave (C) has a target calculated at 11,959, the 1.618 Fibonacci ratio of intermediate wave (A). If this target is reached and price continues to decline, then the second target (for primary wave 2) will be used. At 11,756.02 primary wave 2 would reach the 0.618 Fibonacci ratio of primary wave 1.
Primary wave 2 is expected to pull price lower. A target is calculated at 11,756.02, the 0.618 Fibonacci ratio of primary wave 1.
Primary wave 2 cannot move below the start of primary wave 1 at 10,092.94.
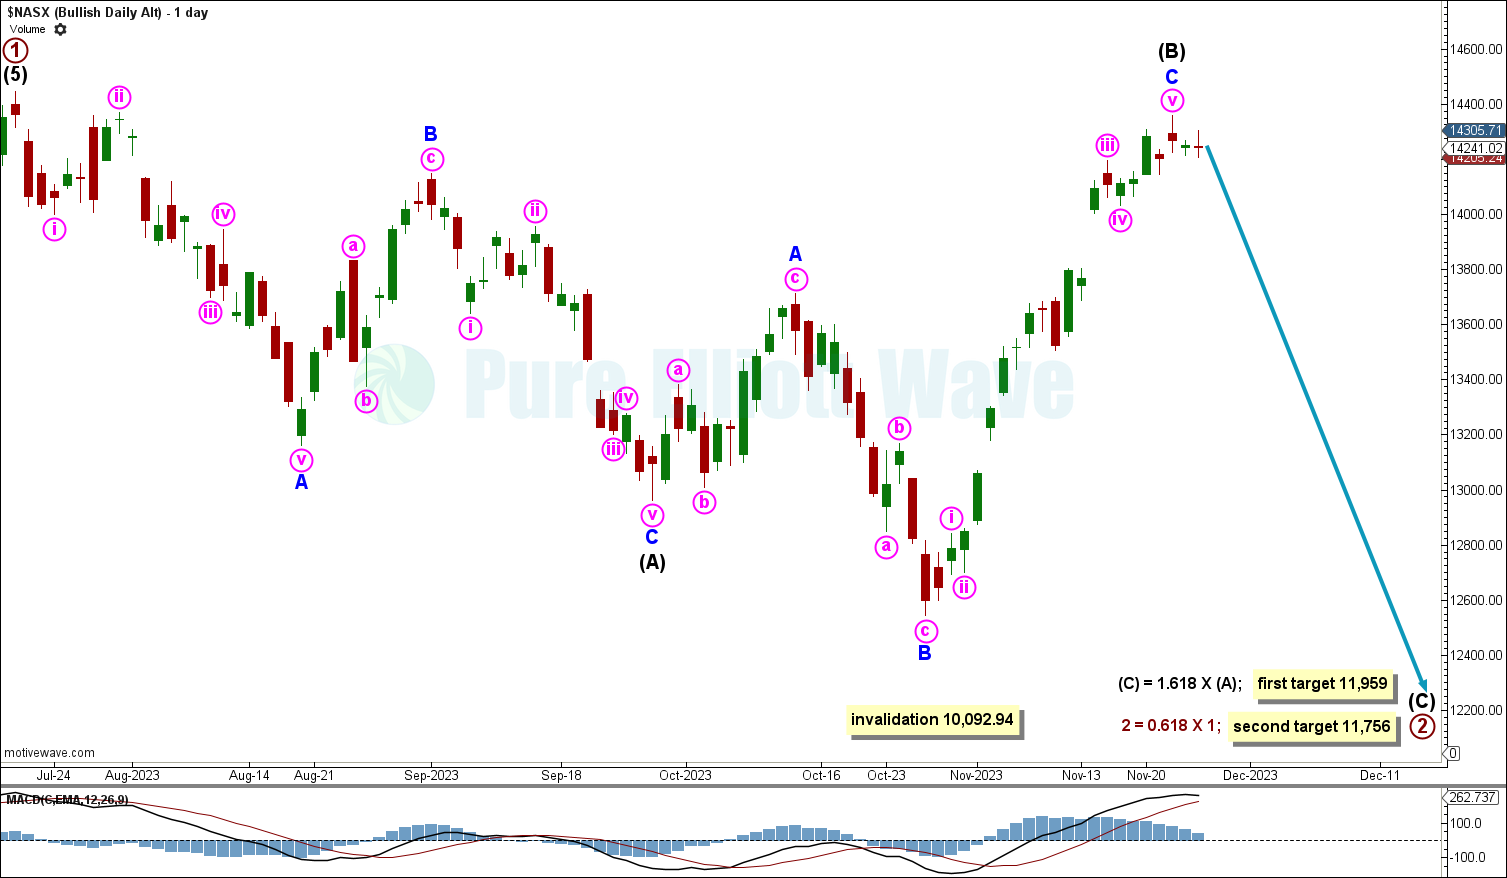
DAILY ALTERNATE CHART
Click chart to enlarge.
Intermediate wave (B) subdivides well as a complete expanded flat.
If price continues to increase, then this structure may have to be relabelled.
Price is now expected to decline for intermediate wave (C) and the end of primary wave 2.
BEARISH ELLIOTT WAVE COUNT
This wave count has been discarded due to low probability.
TECHNICAL ANALYSIS
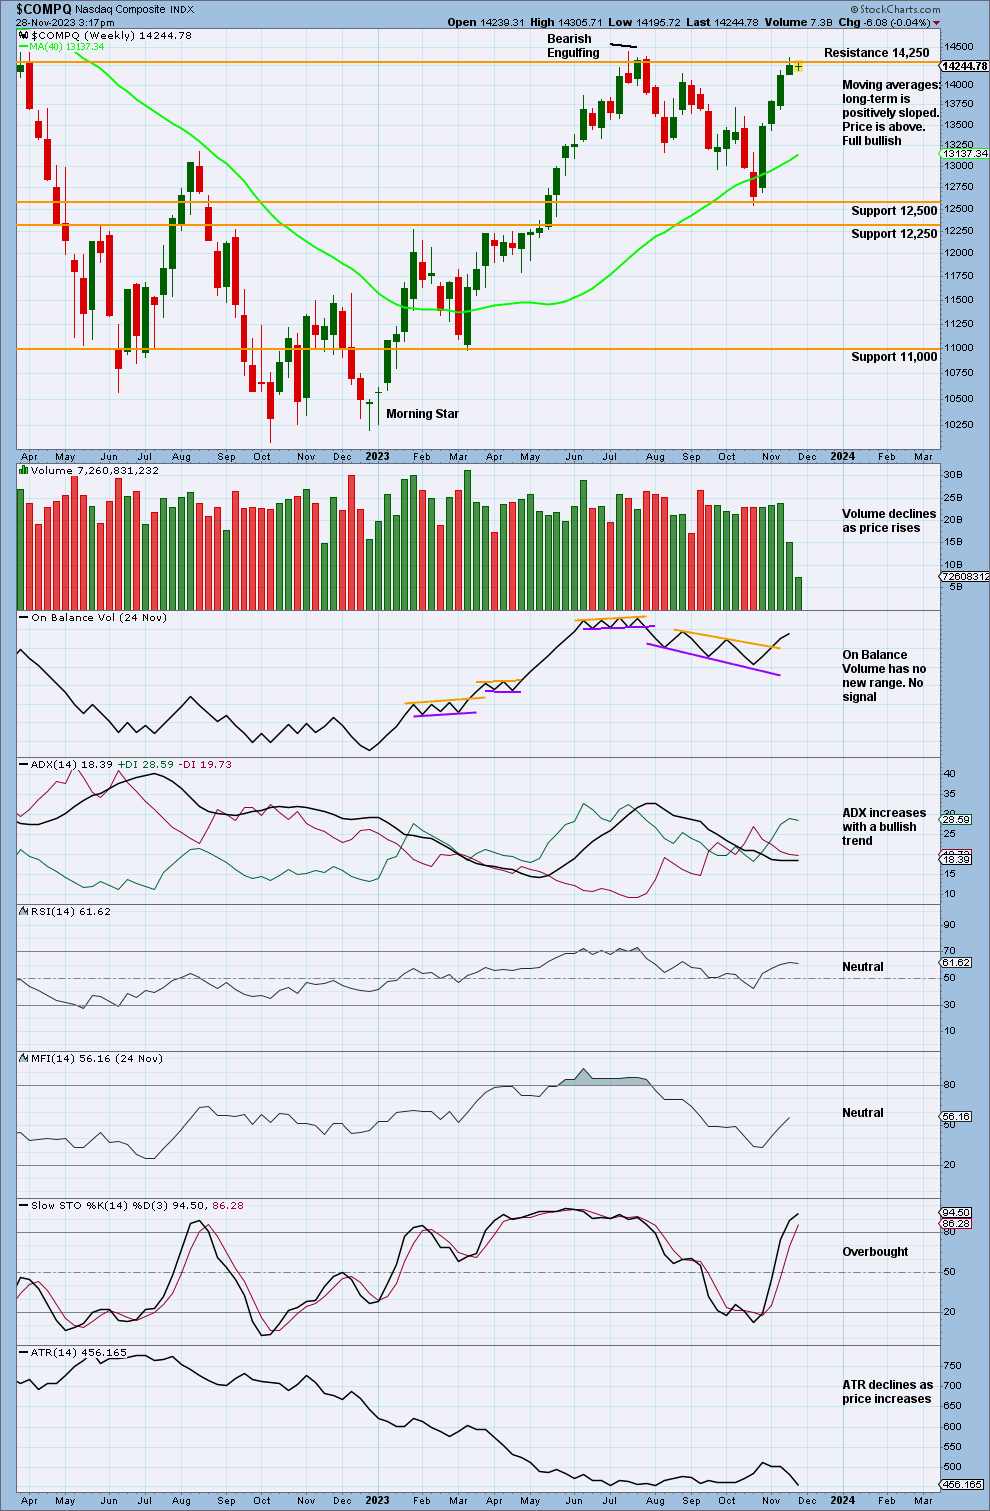
WEEKLY CHART
Click chart to enlarge.
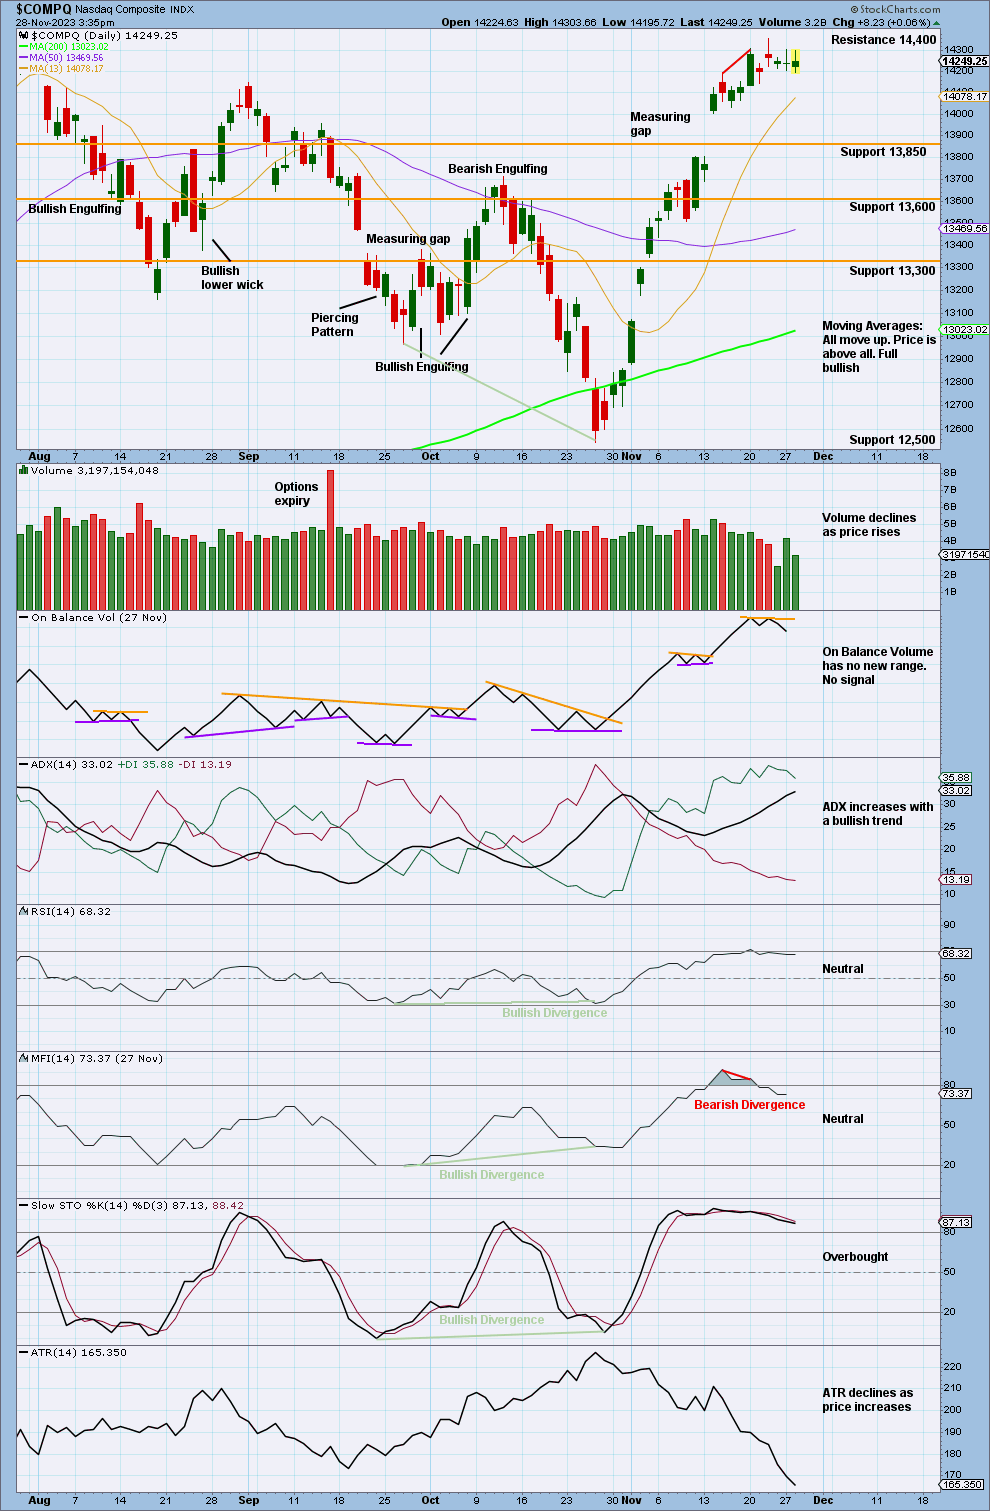
Price has found strong resistance at 14,250.
Volume declines as price increases.
ADX now increases with a bullish trend. This trend is not extreme and is not in danger of ending at this time frame.
DAILY CHART
Click chart to enlarge
Price increases, finding resistance at 14,400 with overall declining volume.
The previous measuring gap has a target calculated at 14,463.51. Price has not reached this target yet.
Money Flow Index exhibits some bearish divergence as price increases. The trend indicated by ADX continues, but is not yet extreme. A corrective movement may occur soon to resolve the bearish divergence.
NAAD WEEKLY CHART
Click chart to enlarge
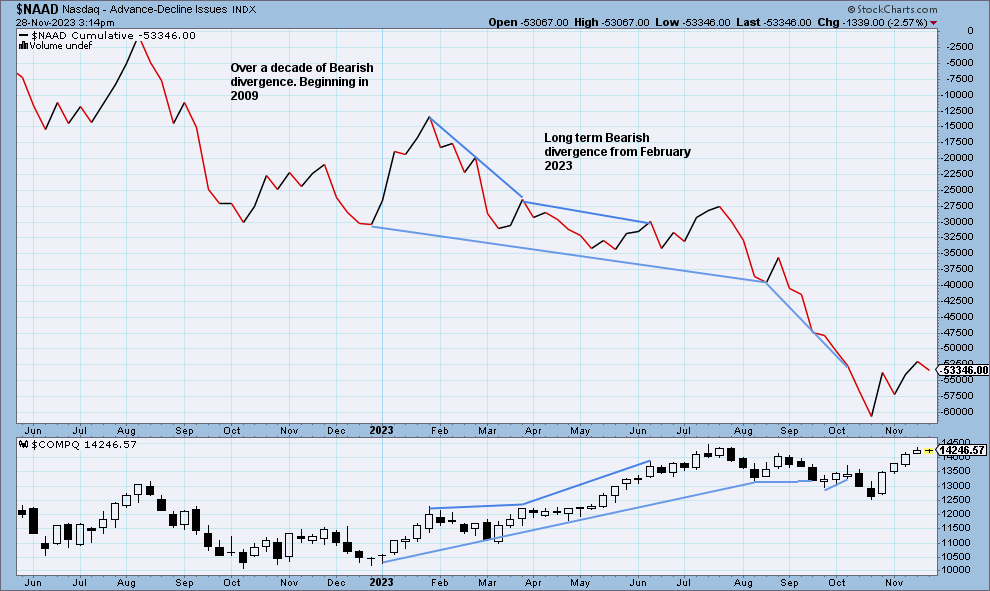
Nasdaq price is making higher highs, but the Nasdaq AD line has made lower highs. This divergence is bearish, and it shows that the rise in price does not have support from rising market breadth.
Nasdaq AD line is making new lows while price makes higher lows. This bearish divergence continues back to 2009.
Published @ 07:39 p.m. ET.
—
Careful risk management protects your trading account(s).
Follow my two Golden Rules:
1. Always trade with stops.
2. Risk only 1-5% of equity on any one trade.
—
New updates to this analysis are in bold.
—
 Save as PDF