July 14, 2023: NASDAQ Elliott Wave and Technical Analysis – Video and Charts
Analysis of Nasdaq considers the possibility that it may have found a low.
Summary: Price is expected to increase within primary wave 1, currently within minor wave 3 of intermediate wave (3).
Note that the S&P 500 and NASDAQ do not always find highs and lows together. The last all-time high for the S&P 500 was on January 4, 2022, whereas the last all-time high for NASDAQ was November 22, 2021.
MAIN ELLIOTT WAVE COUNT
MONTHLY CHART
Click chart to enlarge.
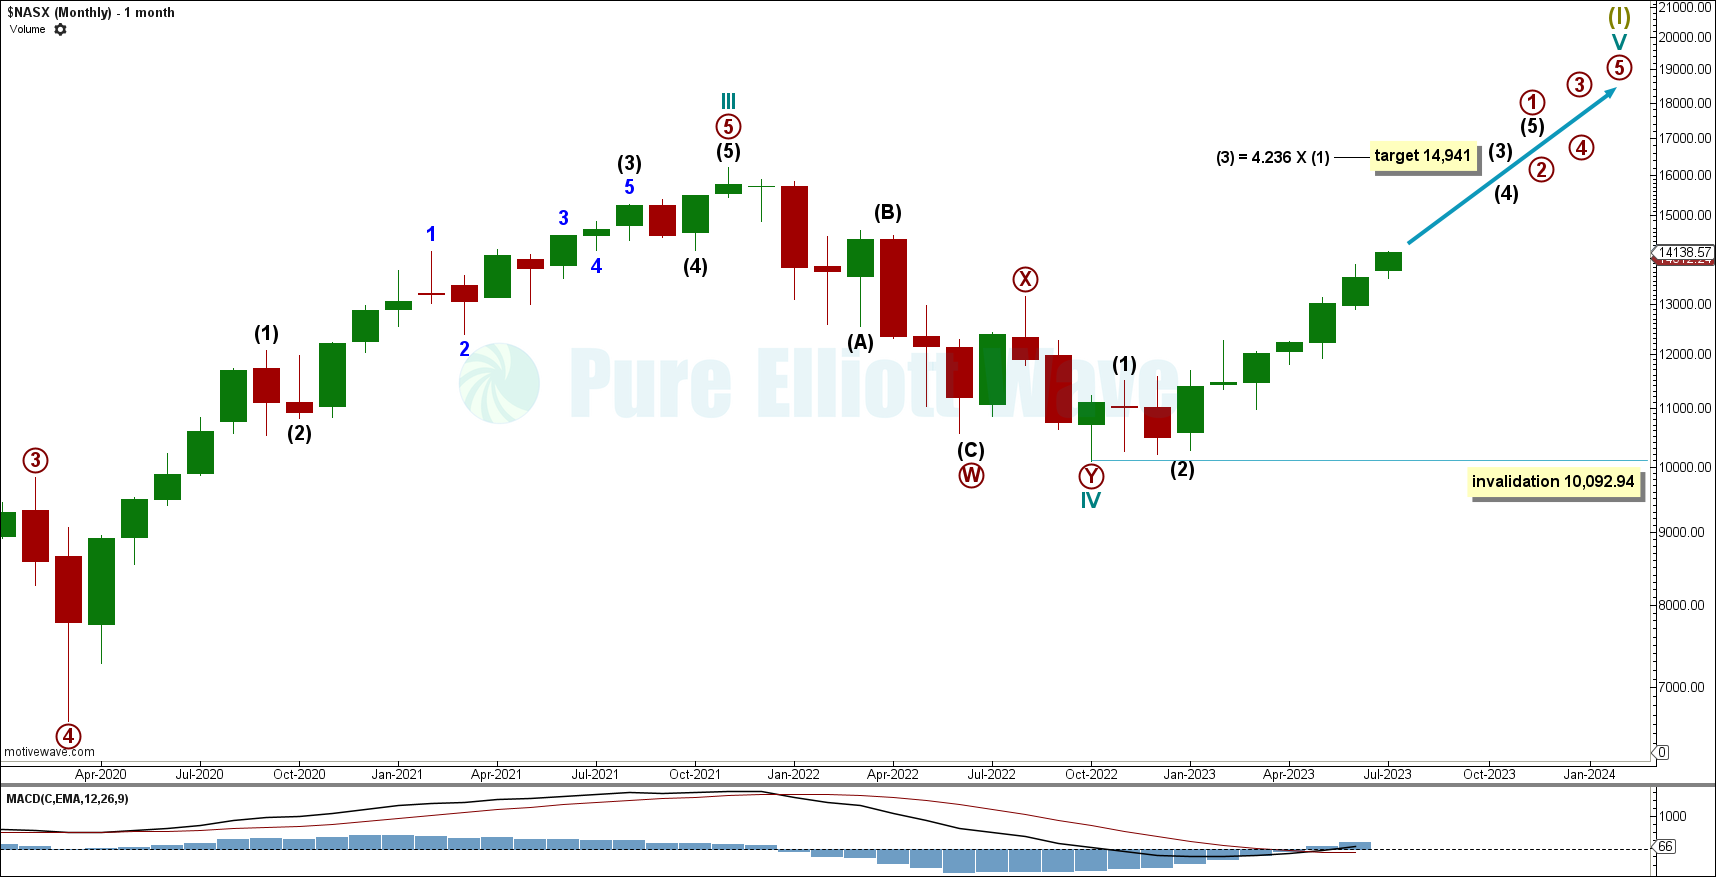
Cycle wave IV may be complete at the last low.
Now cycle wave V within Supercycle wave (I) is pushing price higher. Primary wave 1 is an incomplete impulse, with intermediate wave (3) expected to reach higher before a corrective wave for intermediate wave (4).
Intermediate wave (3) has a target calculated to reach the 4.236 fibonacci ratio of intermediate wave (1) at 14,941.
A corrective movement within cycle wave V cannot move below its start at 10,092.94 or the wave count will be invalidated.
WEEKLY CHART
Click chart to enlarge.
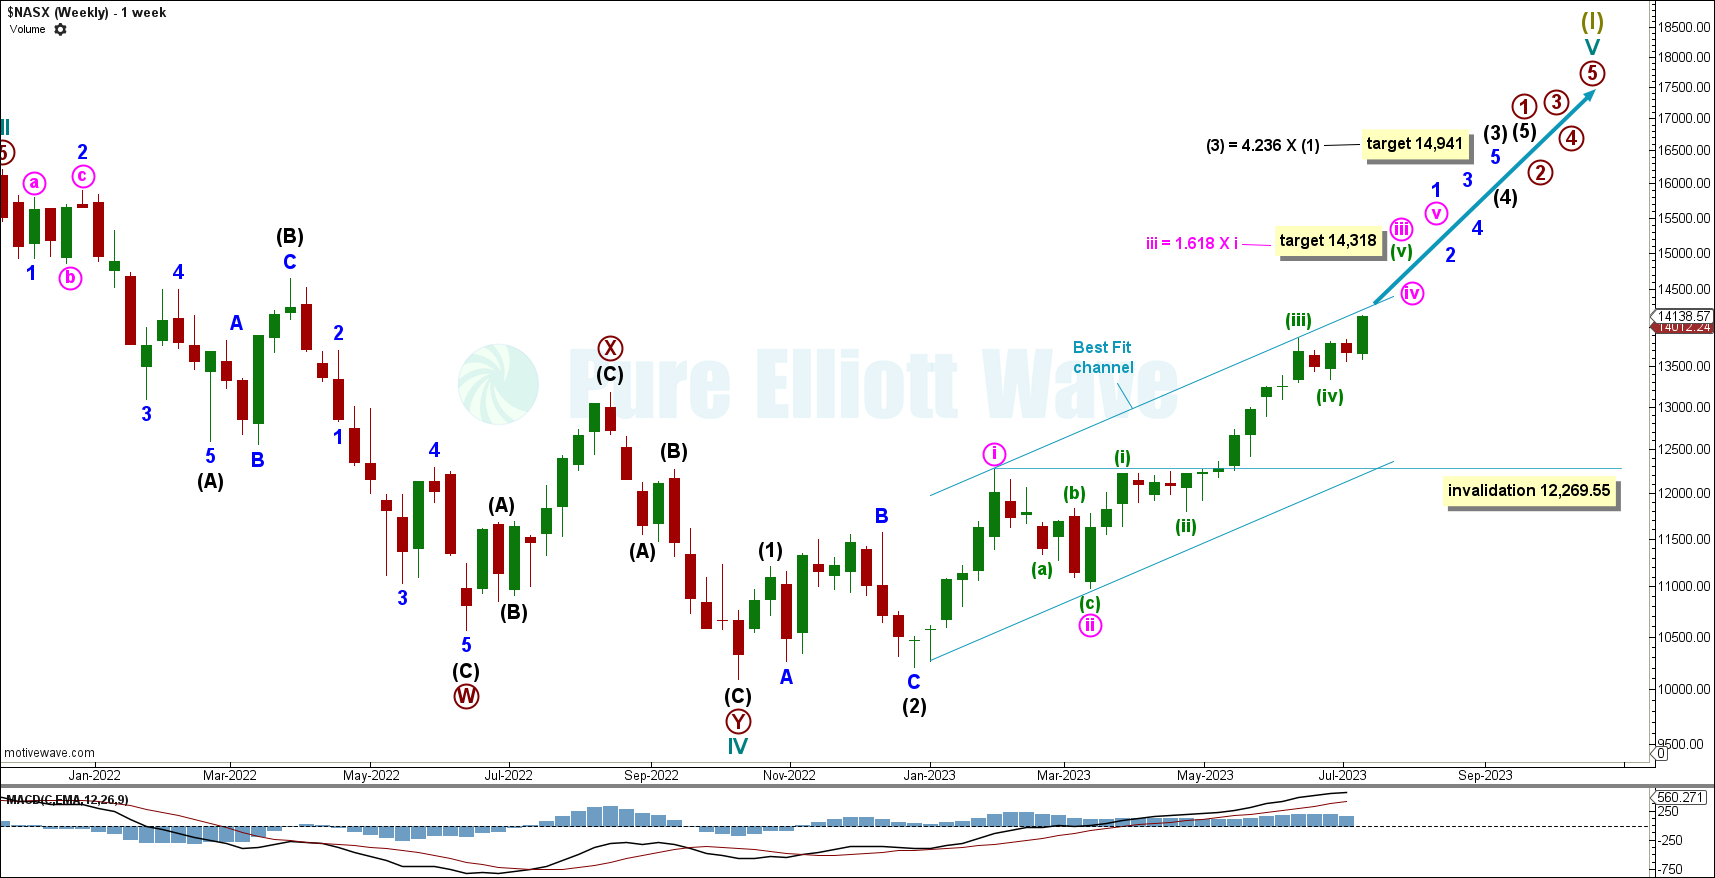
Within primary wave 1 of cycle wave V: Intermediate waves (1) and (2) may be complete and intermediate wave (3) has begun.
Within intermediate wave (3): Minute waves i and ii may be complete and now minute wave iii is unfolding.
This Elliott wave count expects minute wave iii to continue upwards to reach 1.618 times the length of minute wave i at 14,318 before minute wave iv moves down.
It is possible that minute wave iii is complete at the last high. If minute wave iii is complete, then minute wave iv cannot move into minute wave i price territory below 12,269.55.
Intermediate wave (3) has a target calculated at 4.236 times the length of intermediate wave (1) at 14,941.
DAILY CHART
Click chart to enlarge.
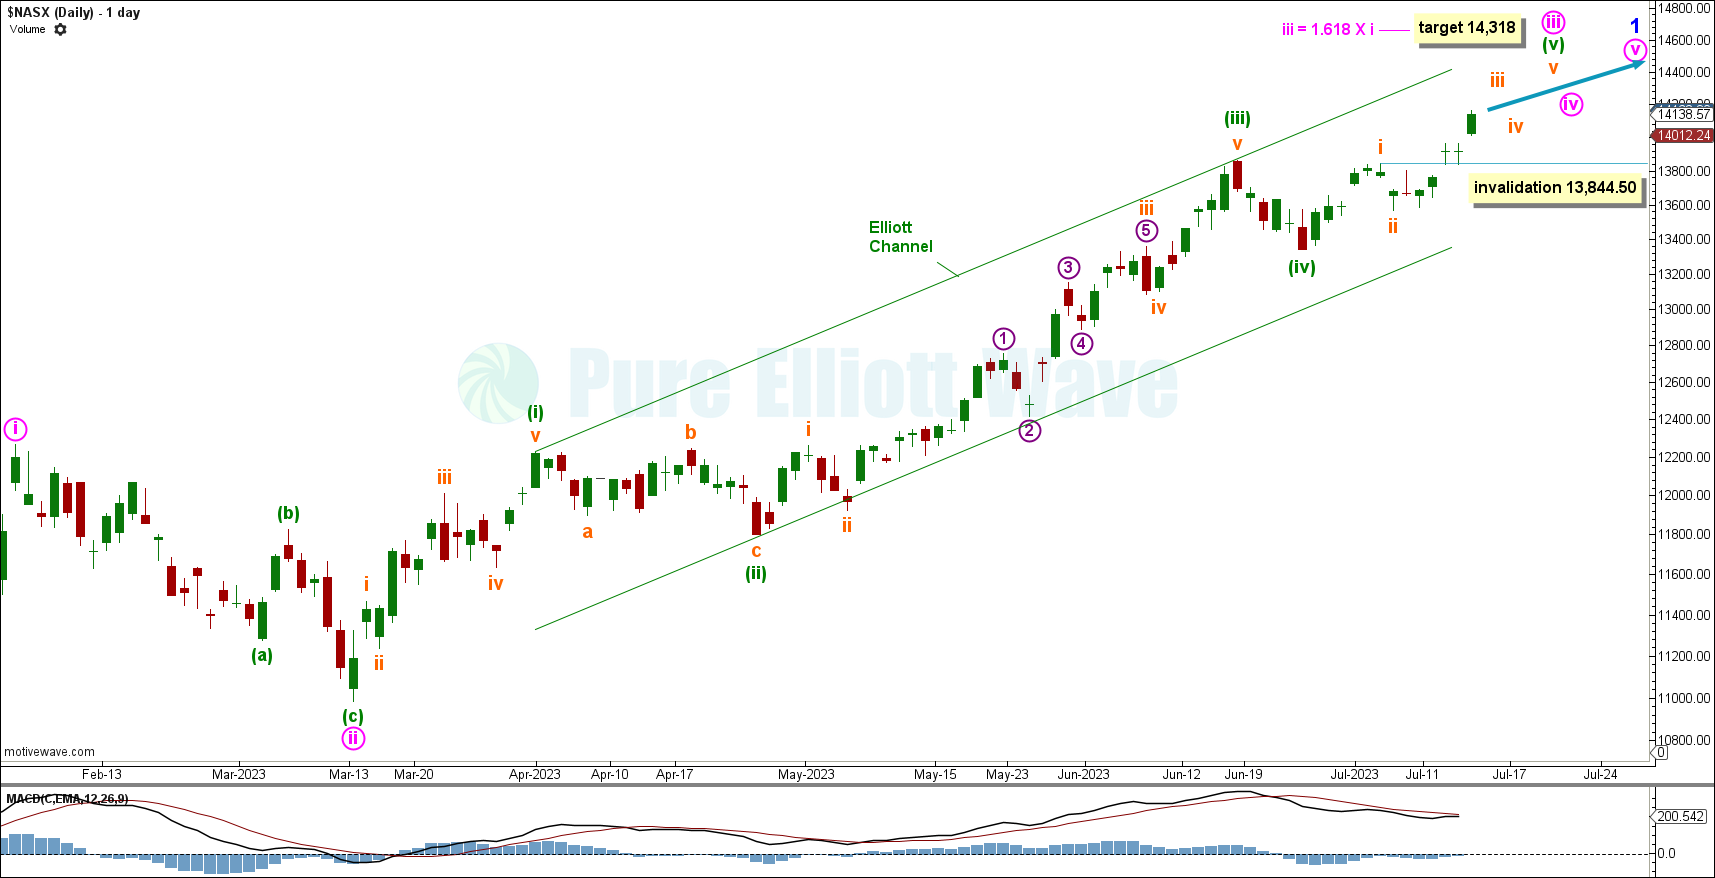
Within intermediate wave (3), minor wave 1 looks likely to be an incomplete impulse, with minute waves i and ii complete.
An Elliott channel is drawn about minute wave iii. The first trend line is drawn from the end of minuette wave (i) to the end of minuette wave (iii), then a parallel copy is placed on the end of minuette wave (ii). Minuette wave (v) may find resistance about the upper edge. When this channel is breached by downwards movement, then that may be used as indication that minute wave iii may be complete.
Subminuette wave iii is expected to push price higher, though it may be complete at the last high. If it is complete, subminuette wave iv cannot move into subminuette wave i price territory at 13,844.50
ALTERNATE ELLIOTT WAVE COUNT
ALTERNATE MONTHLY CHART
Click chart to enlarge.
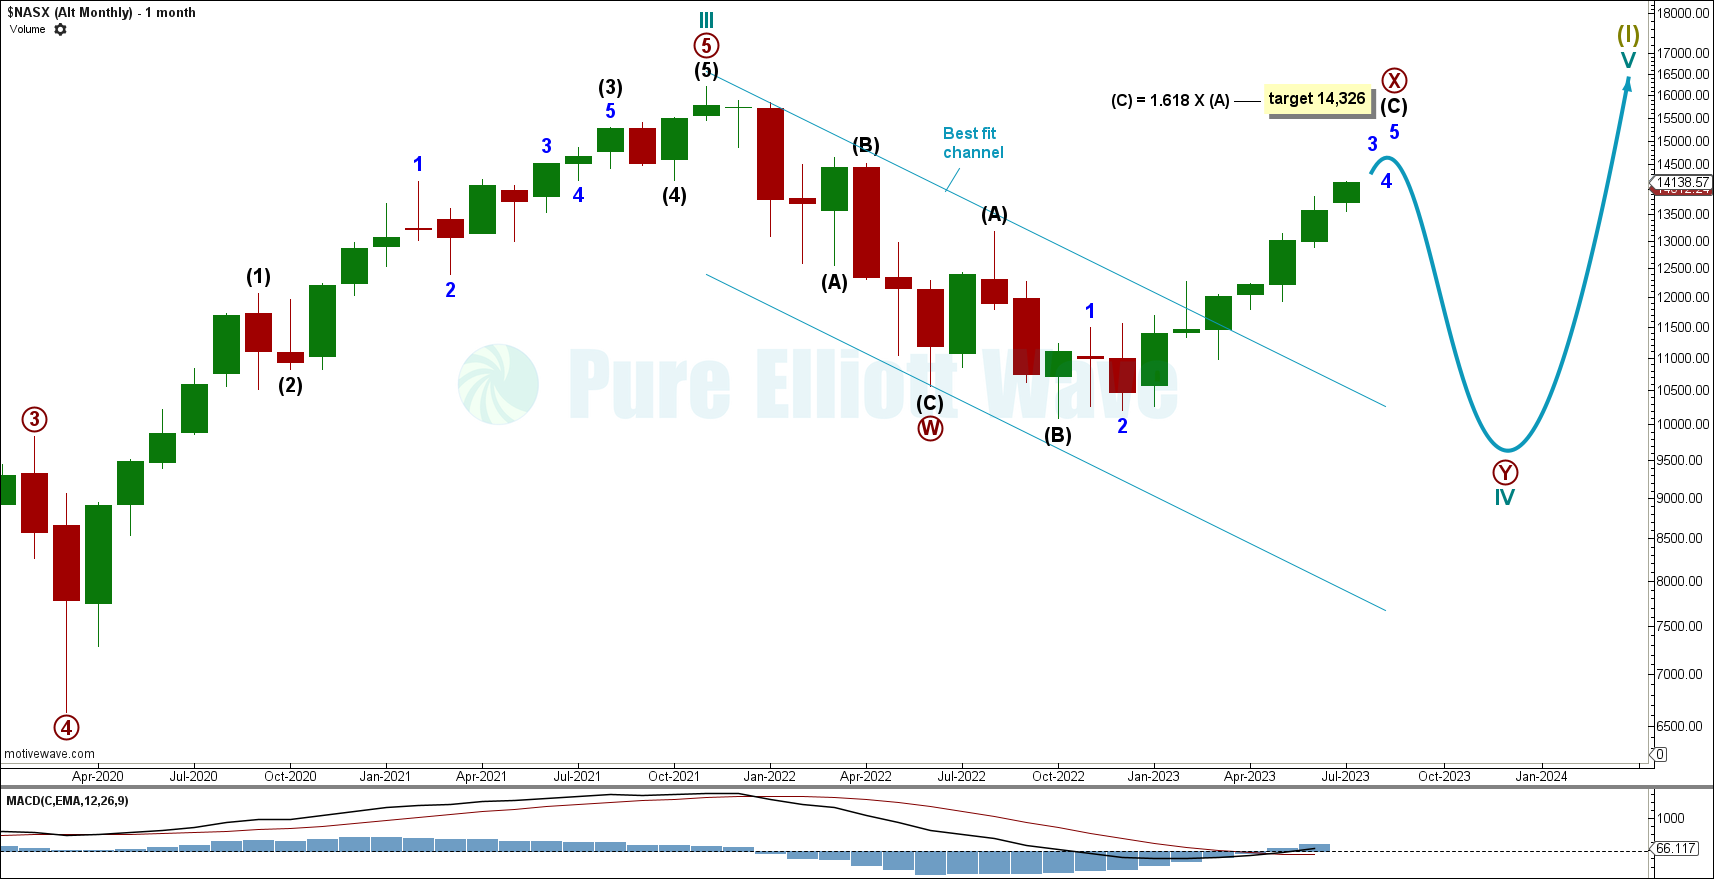
This alternate Elliott wave count expects the current bullish movement to be a rally within a larger bear market. It is expected to reach just over 14,000 at the end of intermediate wave (C) and primary wave X before continuing the bearish trend for the end of primary wave Y and cycle wave IV.
Price has continued to increase, expecting to be near the end of minor wave 3 within intermediate wave (C).
Intermediate wave (C) has a target calculated to reach 1.618 times the length of intermediate wave (A) at 14,326.
ALTERNATE WEEKLY CHART
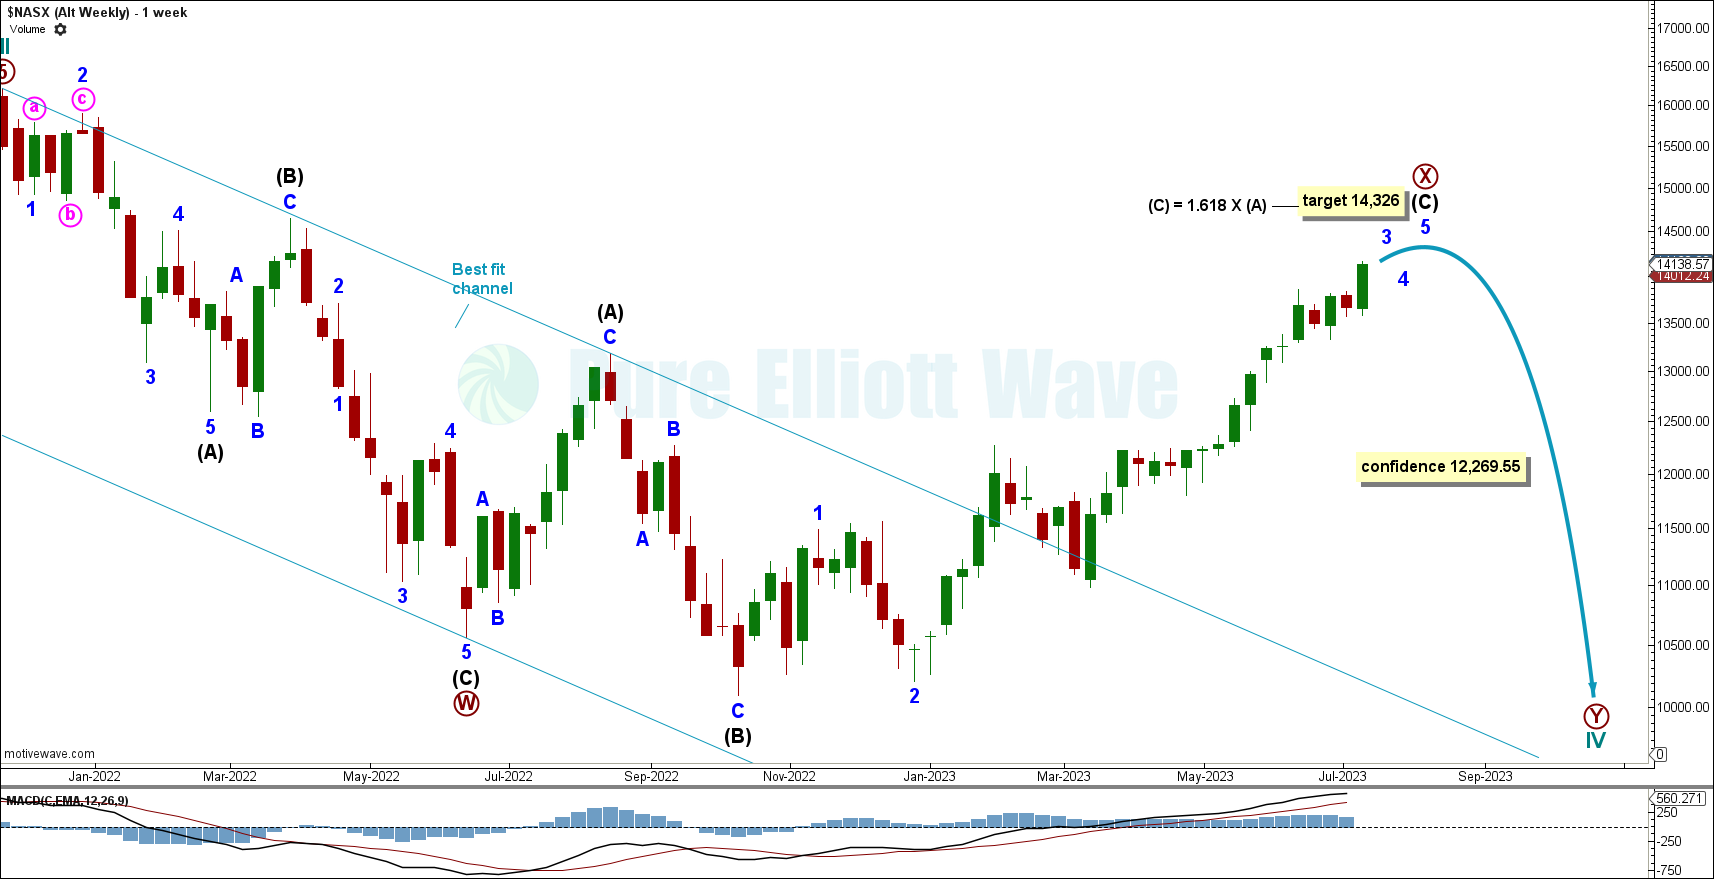
Click chart to enlarge.
Within intermediate wave (C), a corrective movement cannot move below its beginning at 10,092.94 or the wave count will be invalidated.
Price around the last bearish movement has breached the best fit channel, coming back to test support, which is standard behaviour for price around a technically significant trend channel.
ALTERNATE DAILY CHART
Click chart to enlarge.
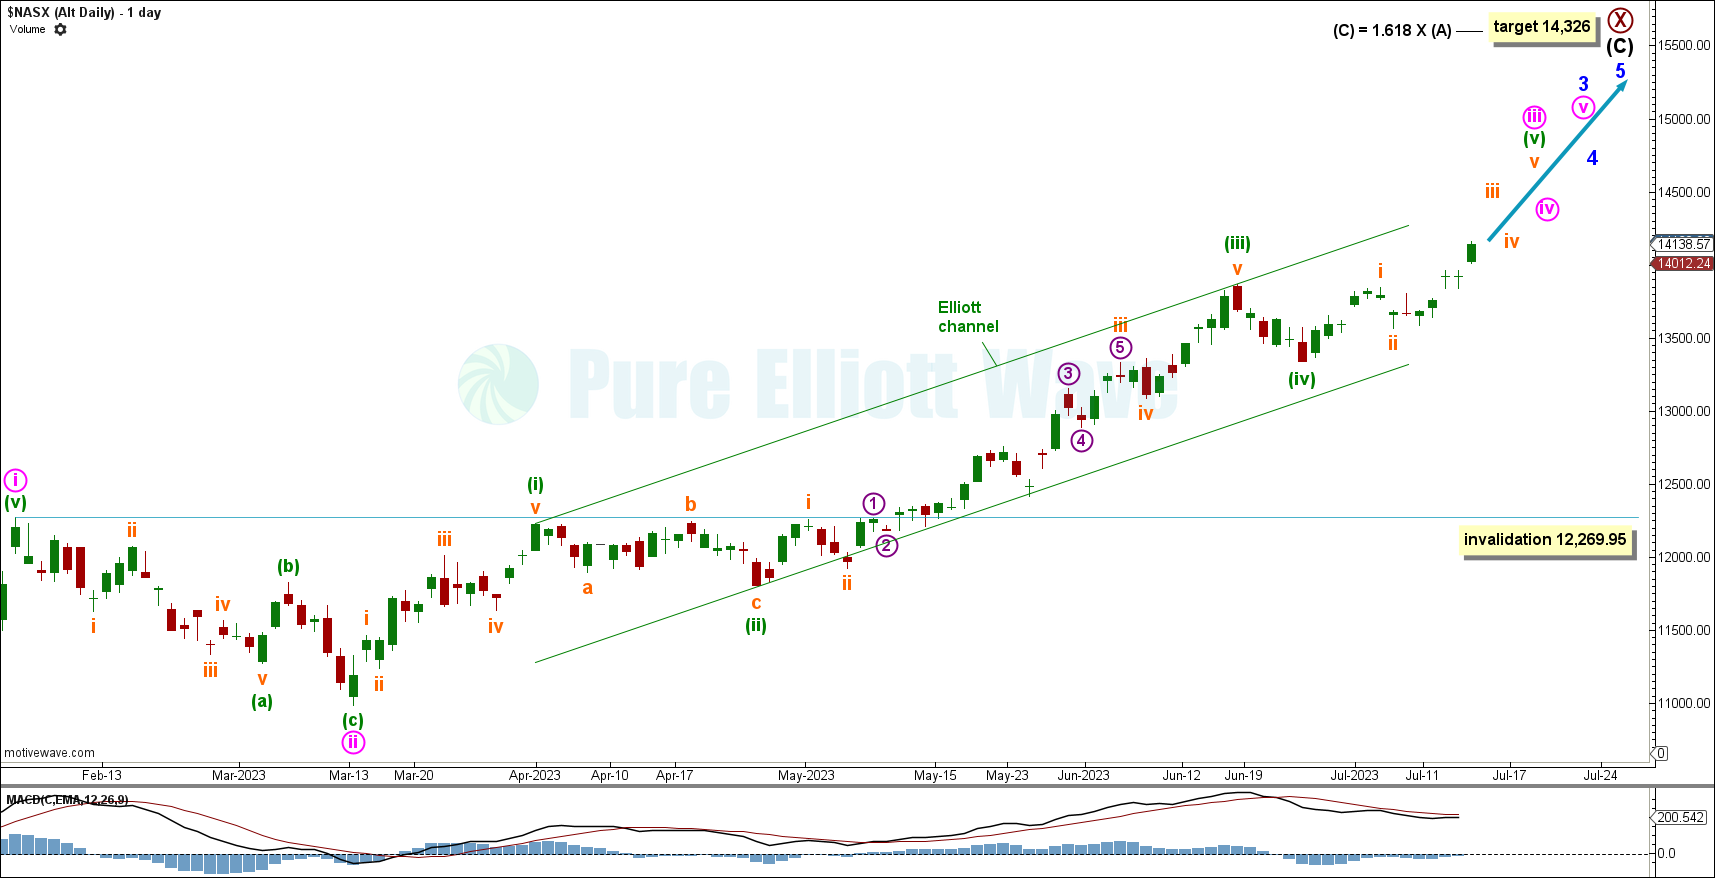
Price has continued to increase, expecting to near the end of intermediate wave (C) within primary wave X.
Within intermediate wave (C): Minor waves 1 and 2 are expected to be complete and minor wave 3 is expected to see price increase for minute wave iii. Subminuette waves i and ii within minuette wave (v) are expected to be complete. Price is now expected to increase for subminuette wave iii, minuette wave (v), and minute wave iii.
It is possible that minuette wave (v) and minute wave iii are complete at the last day’s high; in that case, minute wave iv cannot move into minute wave i price territory at 12,269.95.
TECHNICAL ANALYSIS
MONTHLY CHART
Click chart to enlarge.
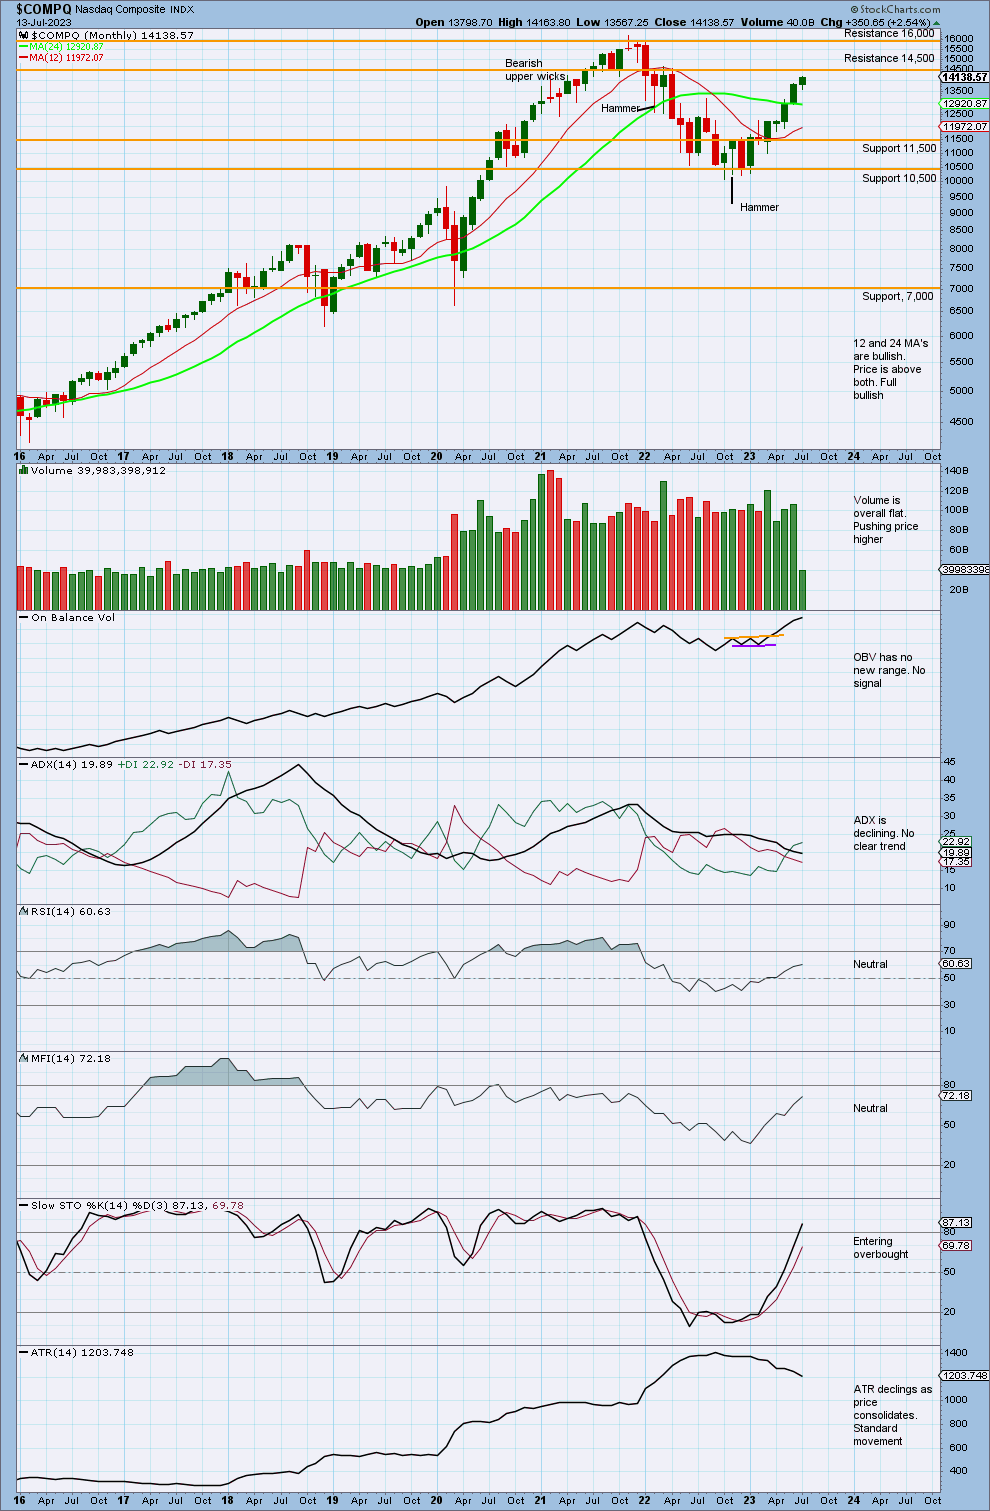
Volume has steadily increased, pushing price higher since the last high. This is very bullish and supports the main Elliott wave count..
As Stochastics is entering overbought, price may find resistance around 14,500.
On Balance Volume has also made new highs along with price, since breaking out of resistance. This supports the main Elliott wave count.
WEEKLY CHART
Click chart to enlarge.
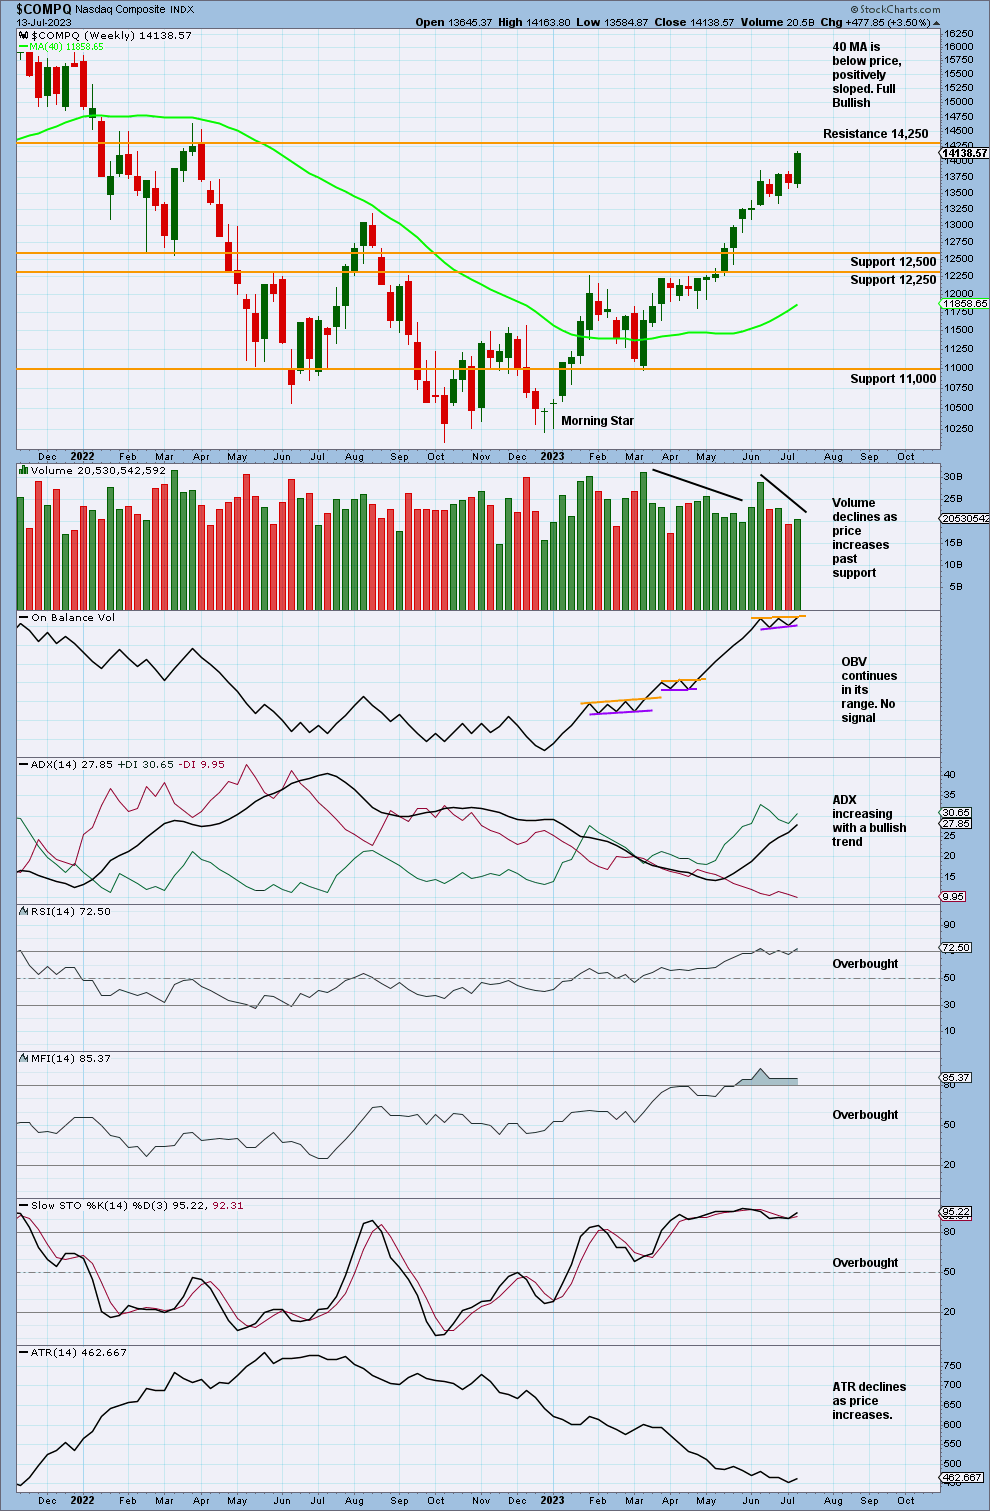
The current week is incomplete, though it shows an increase in volume, pushing price higher.
Both MFI and RSI are overbought (but these indicators can reach further overbought when this market has a strong trend) while ADX increases with a bullish trend that is not yet extreme. There is room above before this trend is in danger of ending. Currently, there is no bearish divergence with either MFI or RSI.
Price is expected to continue to rise, though there may be a corrective movement soon to relieve overbought conditions. This supports the main Elliott wave count.
DAILY CHART
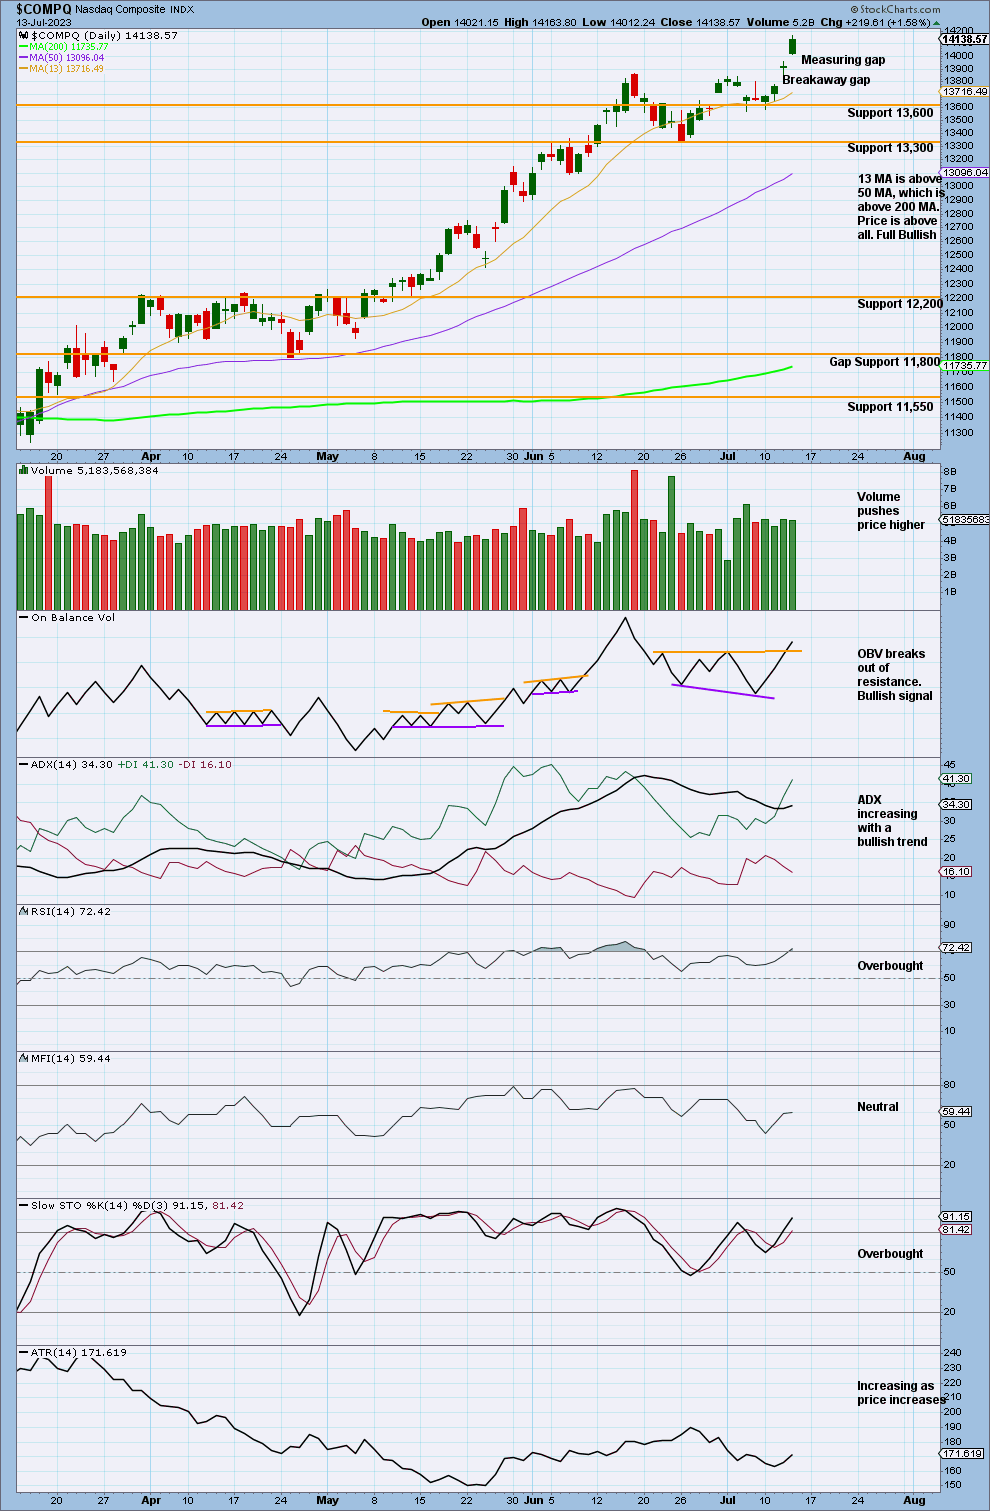
Click chart to enlarge
Price has continued to increase as ADX indicates a bullish trend that is not yet extreme.
On Balance Volume has broken out of resistance, giving a weak bullish signal that supports the main Elliott wave count.
RSI has reached overbought twice but does not exhibit divergence. It is currently overbought, though it can reach more deeply overbought.
Price is expected to continue to rise, though there is likely to be some pullback soon.
Overall, this supports the Elliott wave count.
NAAD WEEKLY CHART
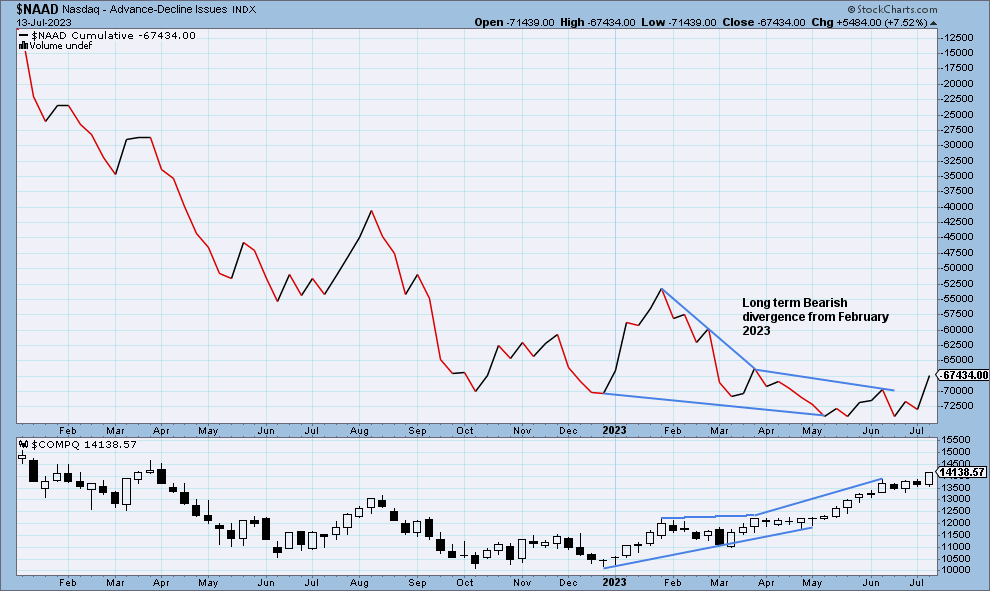
Click chart to enlarge
Nasdaq price is making higher lows, but the Nasdaq AD line has made lower lows. This divergence is bearish, and it shows that the rise in price does not have support from rising market breadth.
This divergence is now long term, going back to February 2023.
Published @ 09:35 a.m. ET on July 15, 2023.
—
Careful risk management protects your trading account(s).
Follow my two Golden Rules:
1. Always trade with stops.
2. Risk only 1-5% of equity on any one trade.
—
New updates to this analysis are in bold.
—
 Save as PDF