January 18, 2024: Natural Gas Elliott Wave and Technical Analysis – Video and Charts
Summary: Price declines for a deeper correction within intermediate wave (3).
Monthly charts are updated here
ELLIOTT WAVE COUNT
WEEKLY
Click chart to enlarge.
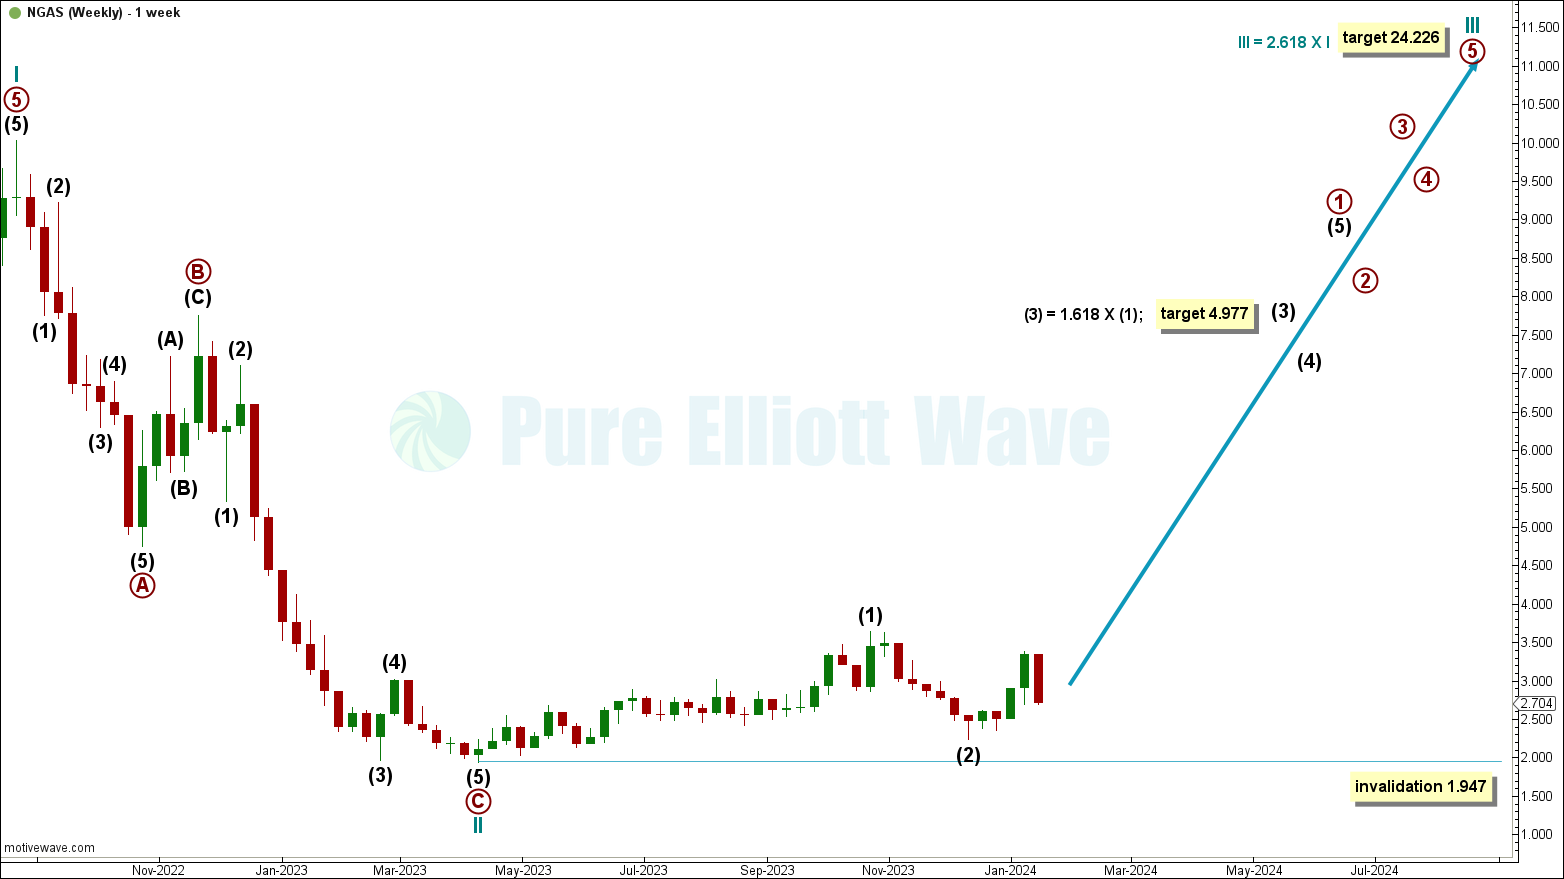
Price has begun to slightly increase off the low in 2023, with some recent downwards movement within the start of intermediate wave (3).
If price continues below the end of intermediate wave (2) at 2.235, then intermediate wave (2) may be continuing lower. If intermediate wave (2) does continue lower, then it cannot move below the start of intermediate wave (1) at 1.947.
Intermediate wave (3) is now expected to overall pull price higher, with a target calculated at 4.977, the 1.618 Fibonacci ratio of intermediate wave (1).
Cycle wave III has a target calculated to reach 2.618 times the length of cycle wave I at 24.226.
DAILY
Click chart to enlarge.
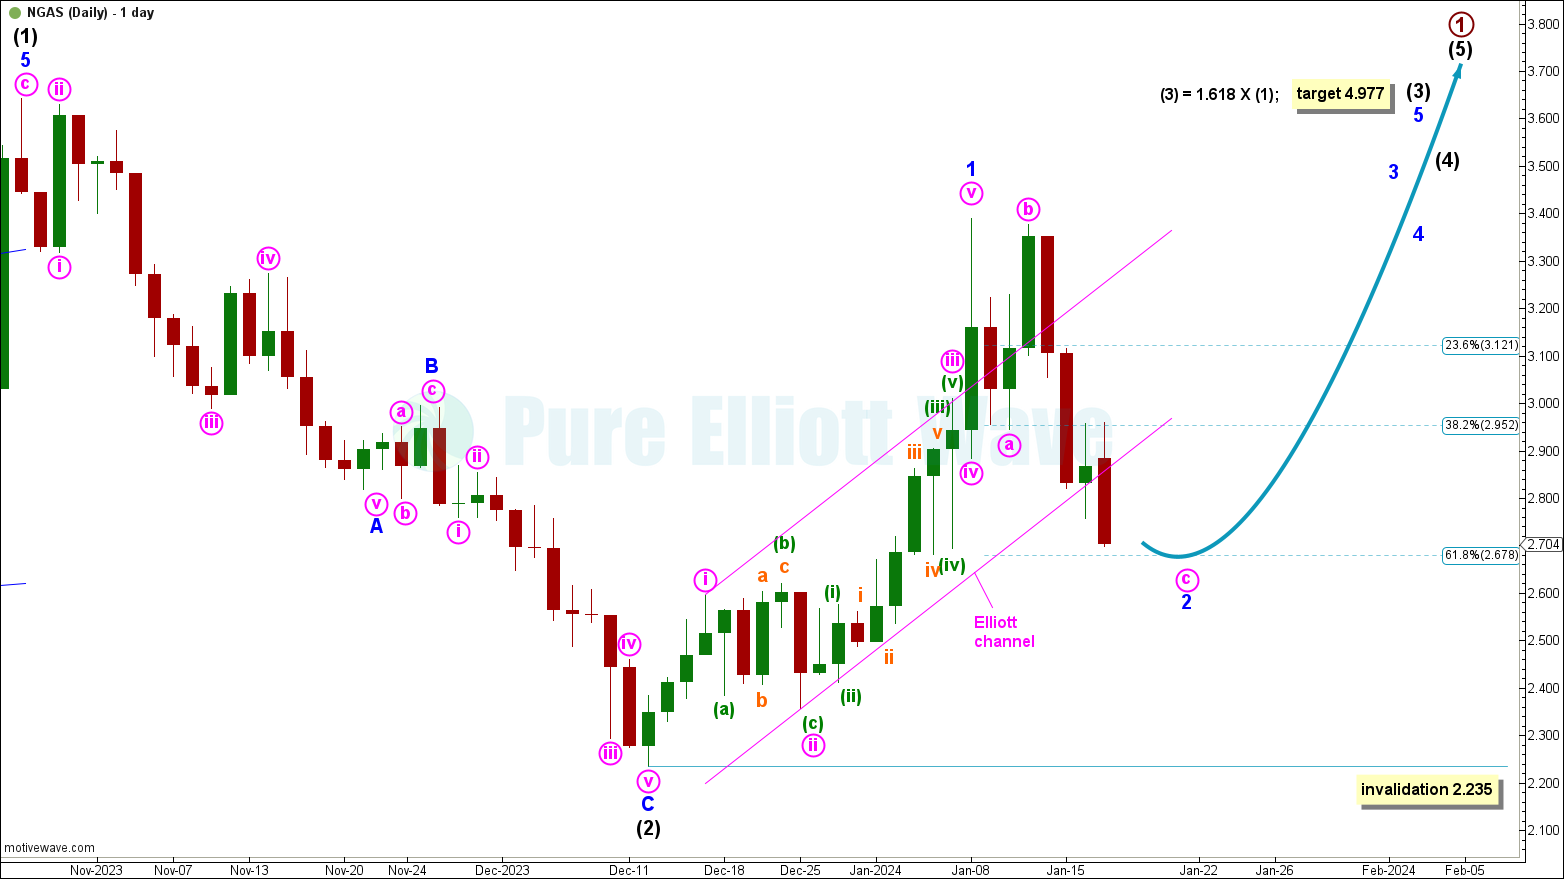
Within intermediate wave (3): Minor wave 1 is labelled complete at the January 8th high and minor wave 2 is now pulling price lower.
Minor wave 2 is currently labelled an incomplete zigzag, though the structure may need to be relabelled as it unfolds.
Minor wave 2 has a target calculated at 2.678, the 0.618 Fibonacci ratio of minor wave 1. Minor wave 2 may overshoot this target. If that happens, then minor wave 2 cannot move below the start of minor wave 1 at 2.235.
An Elliott channel is drawn around minor wave 1 using Elliott’s first technique. Draw a line from the end of minute wave i to the end of minute wave iii, with a parallel copy placed at the end of minute wave ii. A break below this channel with a full candlestick below and not touching, indicates minor wave 1 being complete and minor wave 2 to pull price lower.
TECHNICAL ANALYSIS
WEEKLY
Click chart to enlarge.
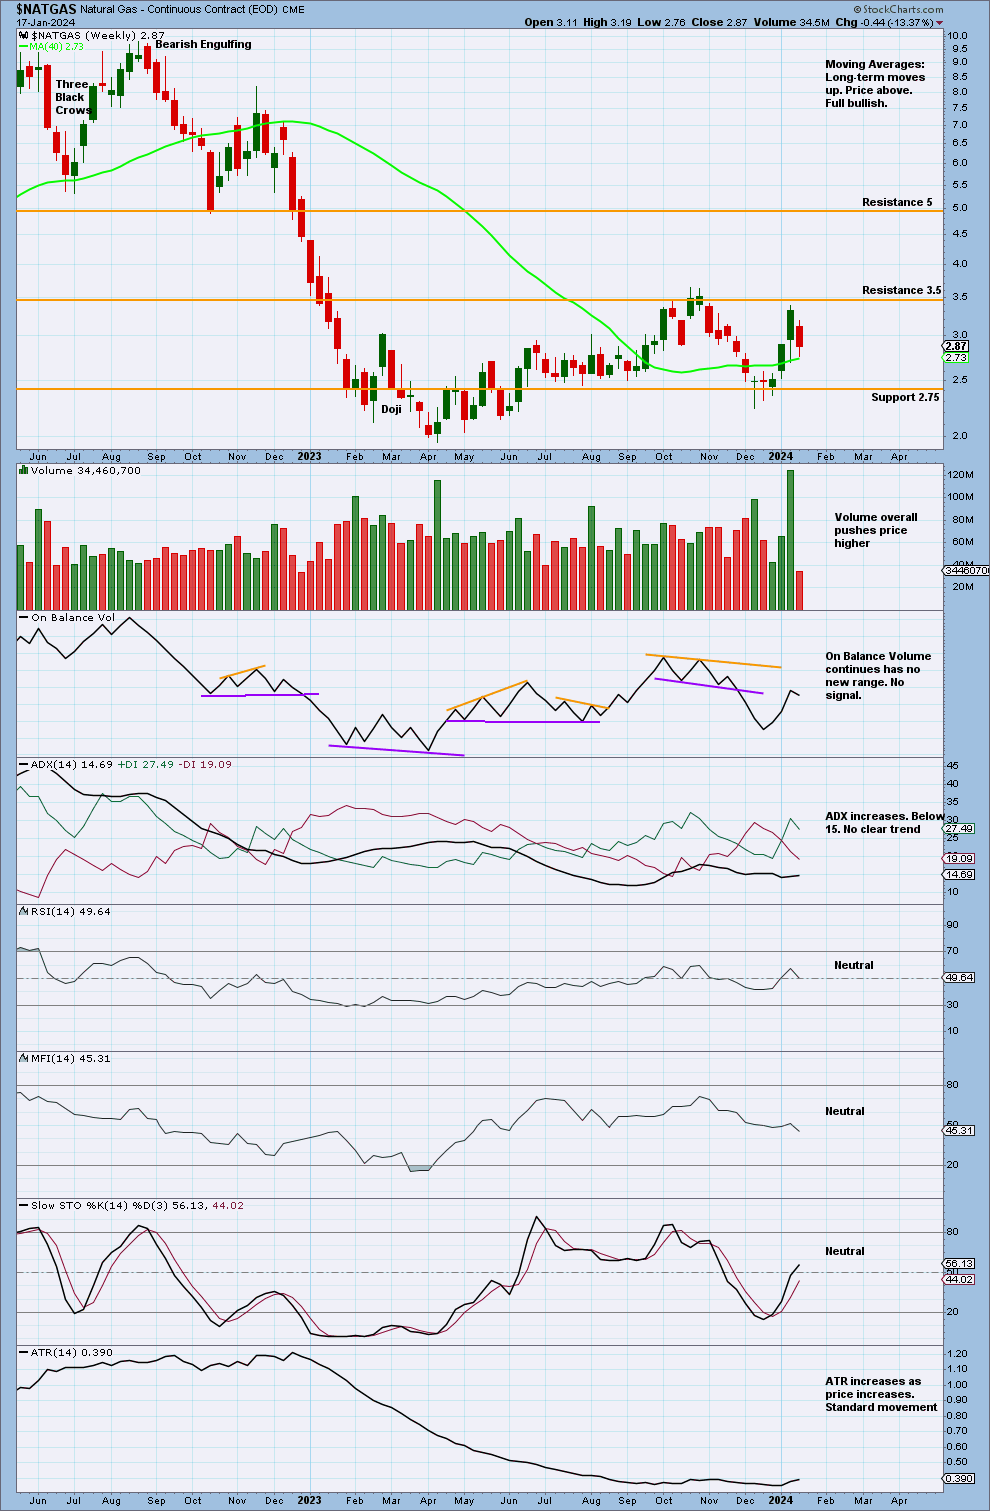
Price continues to move between resistance at 3.5 and support at 2.75.
ADX increases though it is below 15, so there is no clear trend. If ADX increases to and above 15, then it will give the strongest bullish signal it can, increasing from a low point and below both DX lines.
There was a strong push from volume as price neared resistance at 3.5. The volume profile remains bullish, with stronger volume on bullish candlesticks.
DAILY
Click chart to enlarge.
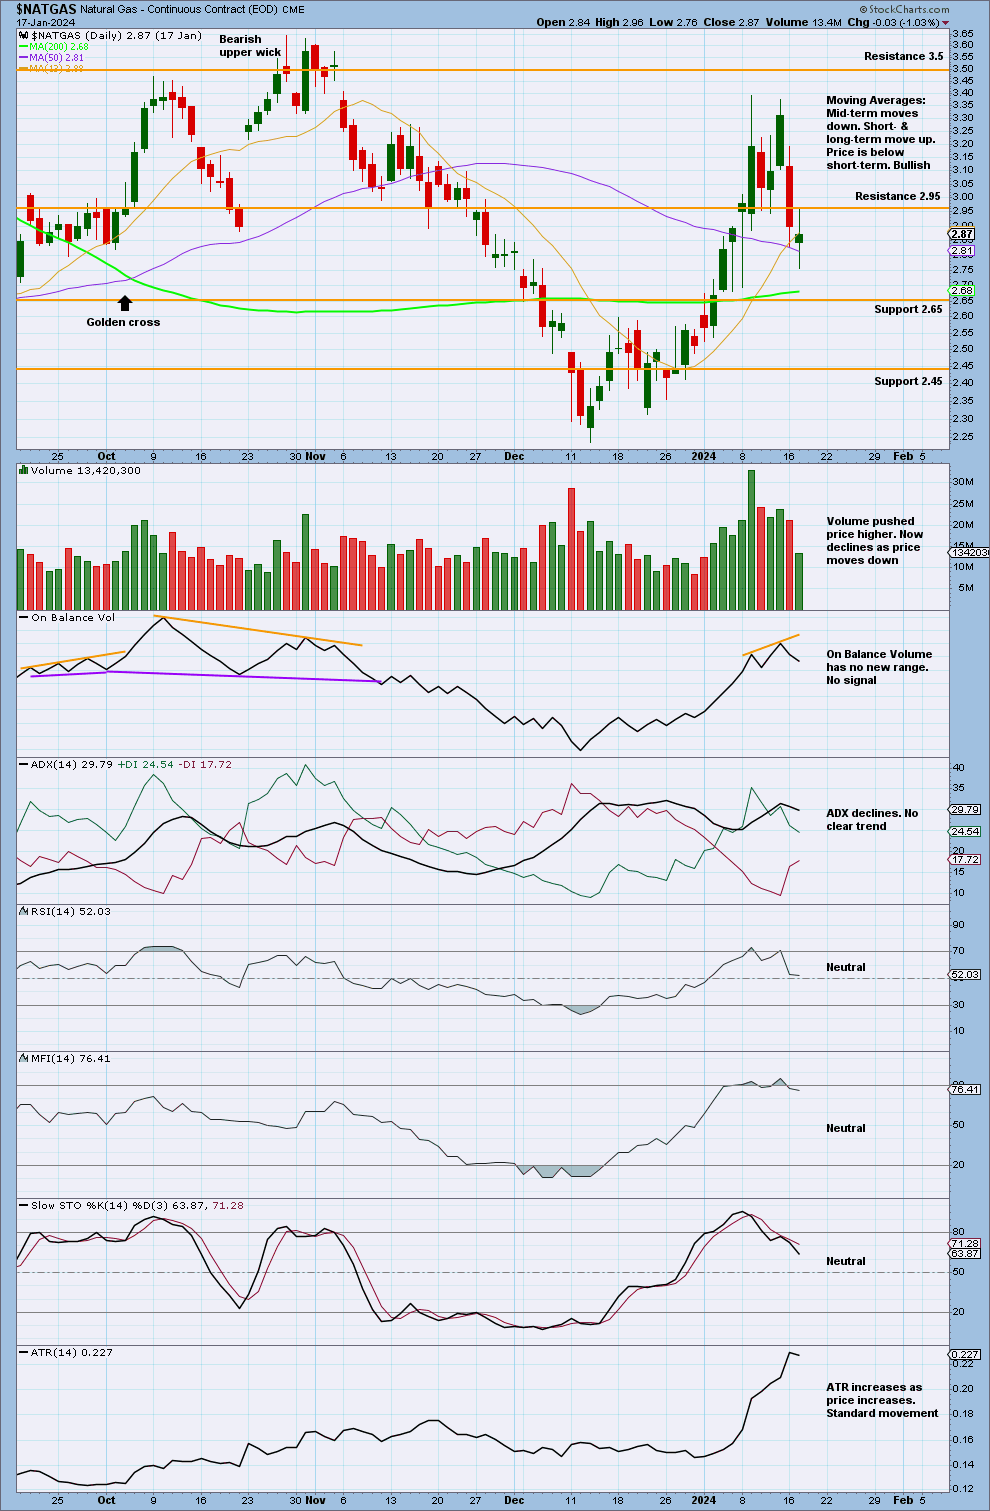
Volume overall increased as price moved upwards through resistance at 2.95, now declining as price moved lower through support (now resistance) at 2.95.
Stochastics has returned from overbought as price moved lower through support (now resistance) at 2.95. A downwards swing may continue here towards support at 2.45.
Published @ 11:36 p.m. ET.
—
Careful risk management protects your trading account(s).
Follow my two Golden Rules:
1. Always trade with stops.
2. Risk only 1-5% of equity on any one trade.
—
New updates to this analysis are in bold.
—
 Save as PDF