February 1, 2024: SILVER Elliott Wave and Technical Analysis – Video and Charts
Summary: Price may have found a new low
Silver is now increasing as both Elliott Wave counts expect.
Monthly charts are updated here.
BULLISH ELLIOTT WAVE COUNT
WEEKLY CHART
Click chart to enlarge.
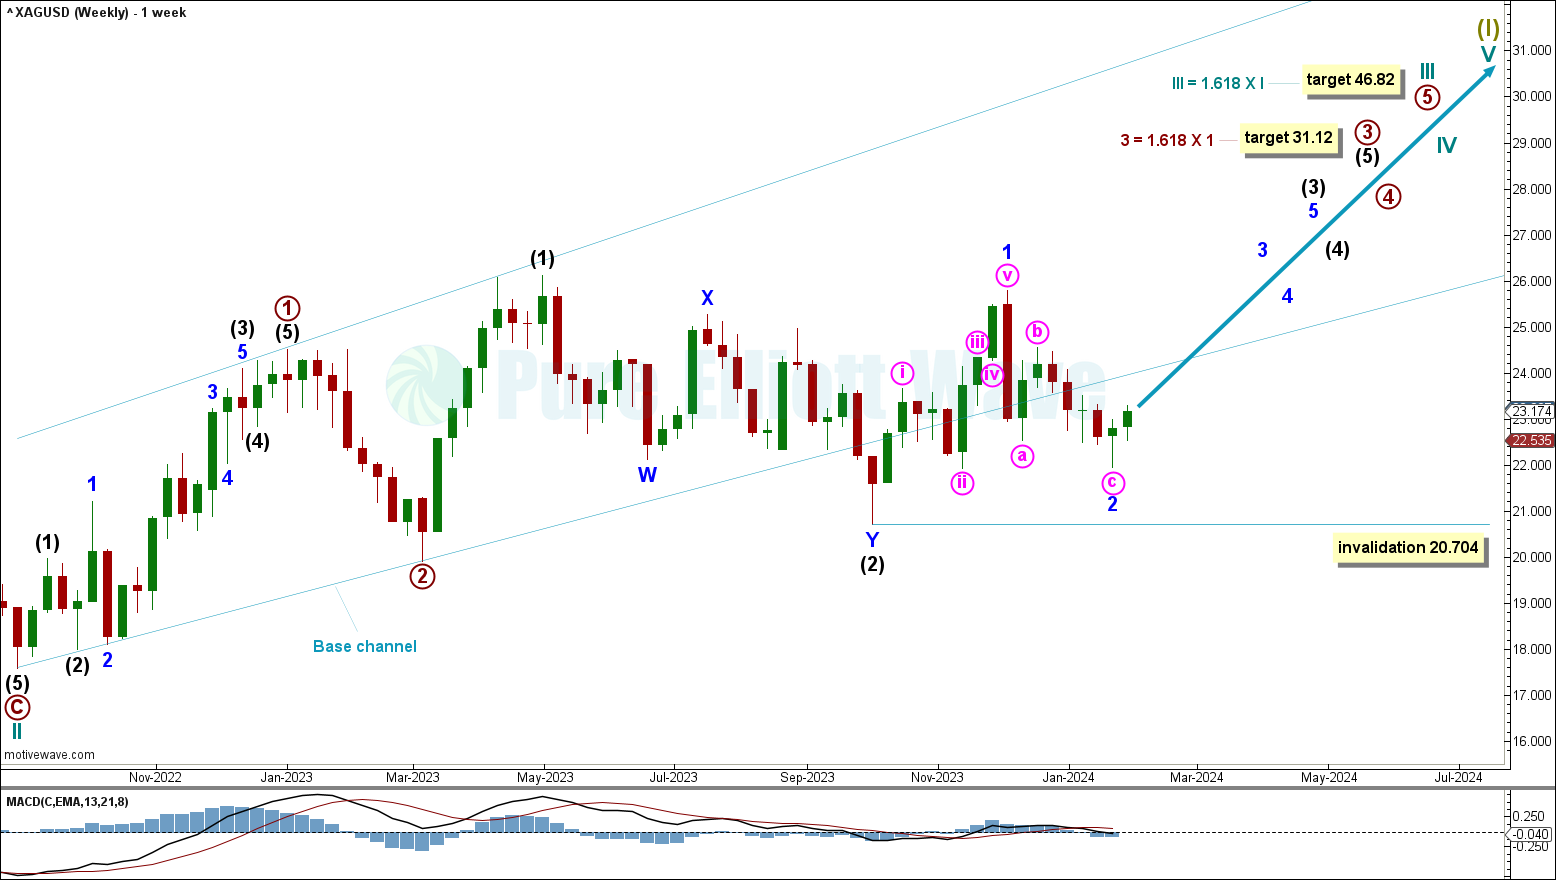
Within the trend of Supercycle wave (I), cycle wave III overall pulls price higher with overlapping first and second waves.
Overlapping third waves are expected at intermediate, primary, and cycle degrees. Third waves at these degrees should be obvious and come with increasing range and momentum (however, they may start slow as they build momentum). This reduces the confidence in this wave count.
Within intermediate wave 3, minor wave 2 is labelled complete at the January 22nd low. Price is now starting to move upwards for minor wave 3.
If minor wave 2 continues lower, then it cannot move below the start of minor wave 1 at 20.704.
Draw a base channel about primary waves 1 and 2. Draw the first trend line from the start of primary wave 1 to the end of primary wave 2, then place a parallel copy at the end of primary wave 1. The lower edge of the base channel has not shown where deep corrections found support. The current third wave movements should break out of this base channel in the direction of the trend. Price is expected to increase for primary wave 3, breaking above the upper edge of the channel.
Cycle wave III pulls price higher. The target is calculated at 46.82, the 1.618 Fibonacci ratio of cycle wave I.
DAILY CHART
Click chart to enlarge.
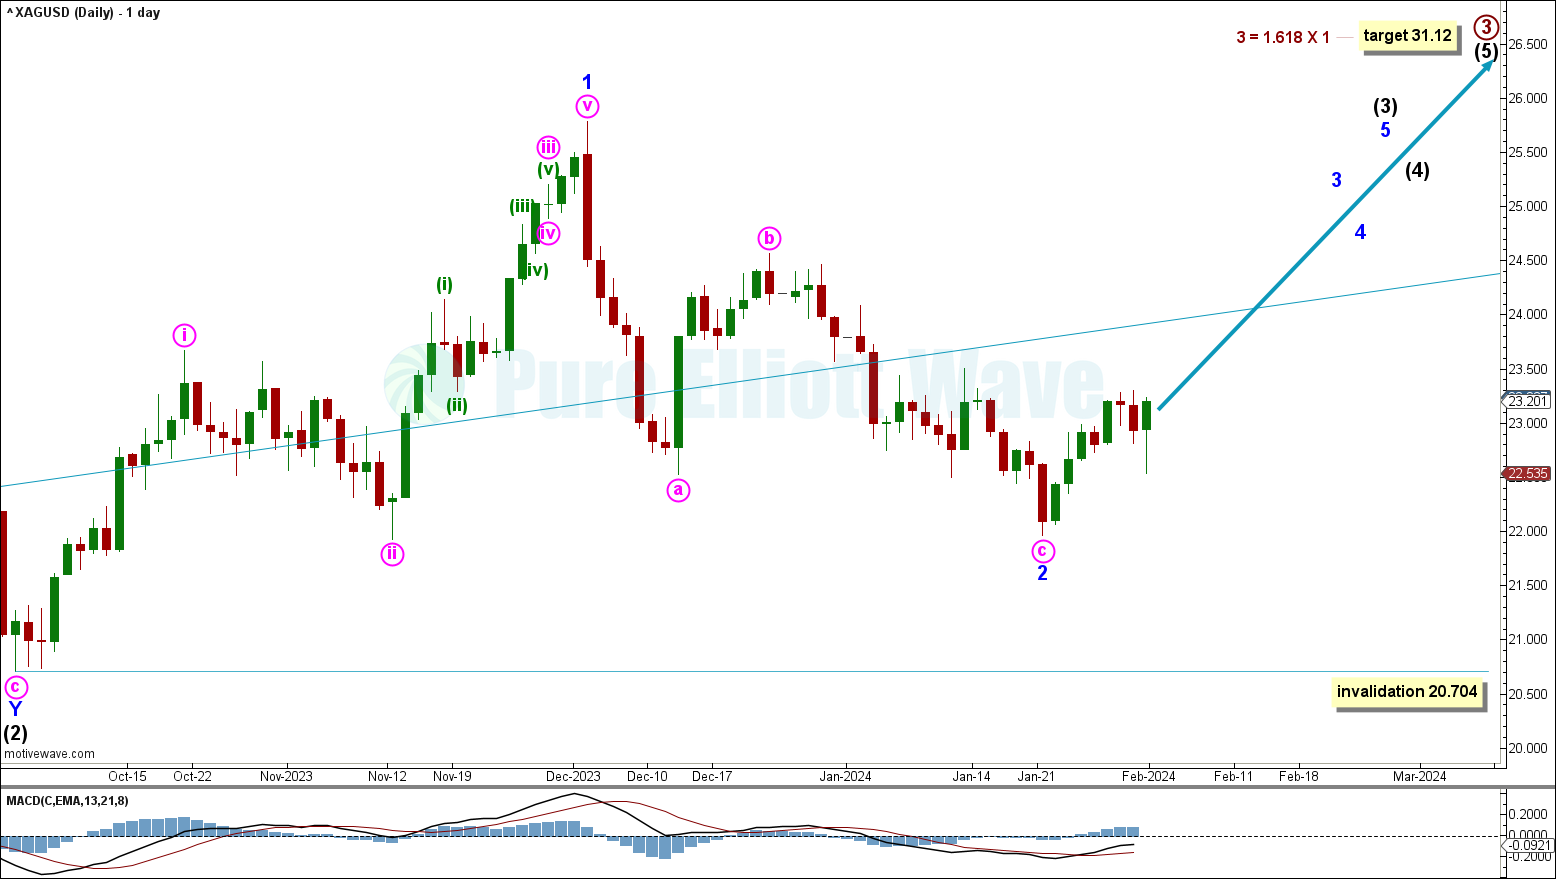
Price has declined for the end of minor wave 2 and now increases for the beginning of minor wave 3.
Price has broken out of the base channel for the end of minute wave c within minor wave 2. A break back into this channel would add confidence to this wave count, seeing third waves at four higher degrees to pull price higher.
Primary wave 3 is expected to eventually break through resistance at upper edge of the base channel.
WEEKLY ALTERNATE CHART
Click chart to enlarge.
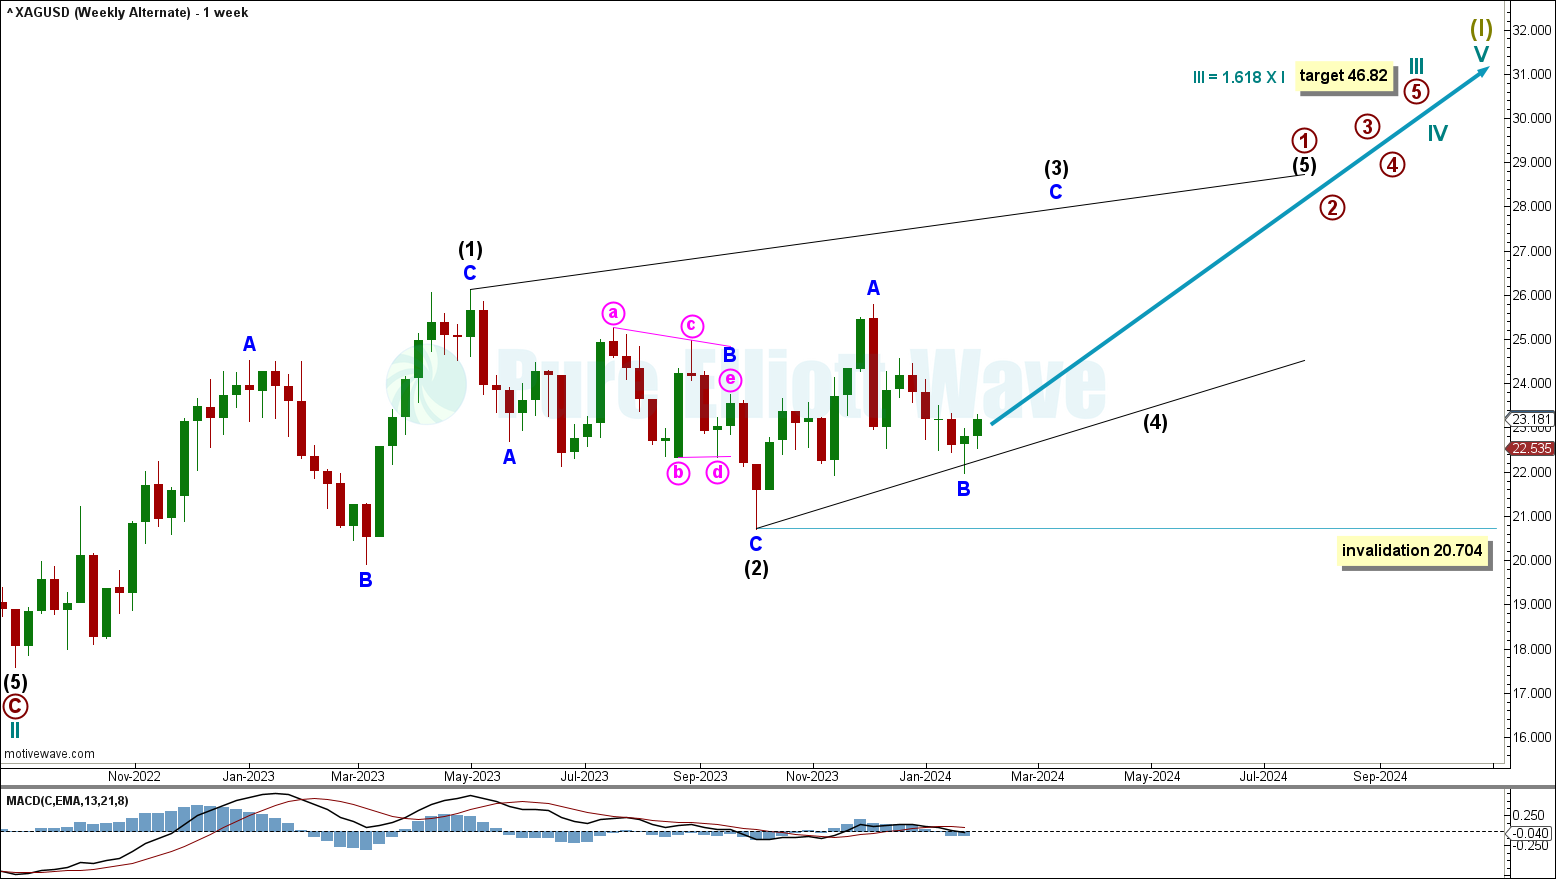
This alternate sees primary wave 1 within cycle wave III unfolding as an incomplete leading diagonal.
Minor wave B within intermediate wave (3) is labelled complete at the January 22nd low. Price is now expected to increase for minor wave C and the end of intermediate wave (3).
If minor wave B continues, then it cannot move below the start of minor wave A at 20.704.
Cycle wave III is overall expected to pull price higher with a target calculated at 46.82, the 1.618 Fibonacci ratio of cycle wave I.
TECHNICAL ANALYSIS
WEEKLY CHART
Click chart to enlarge.
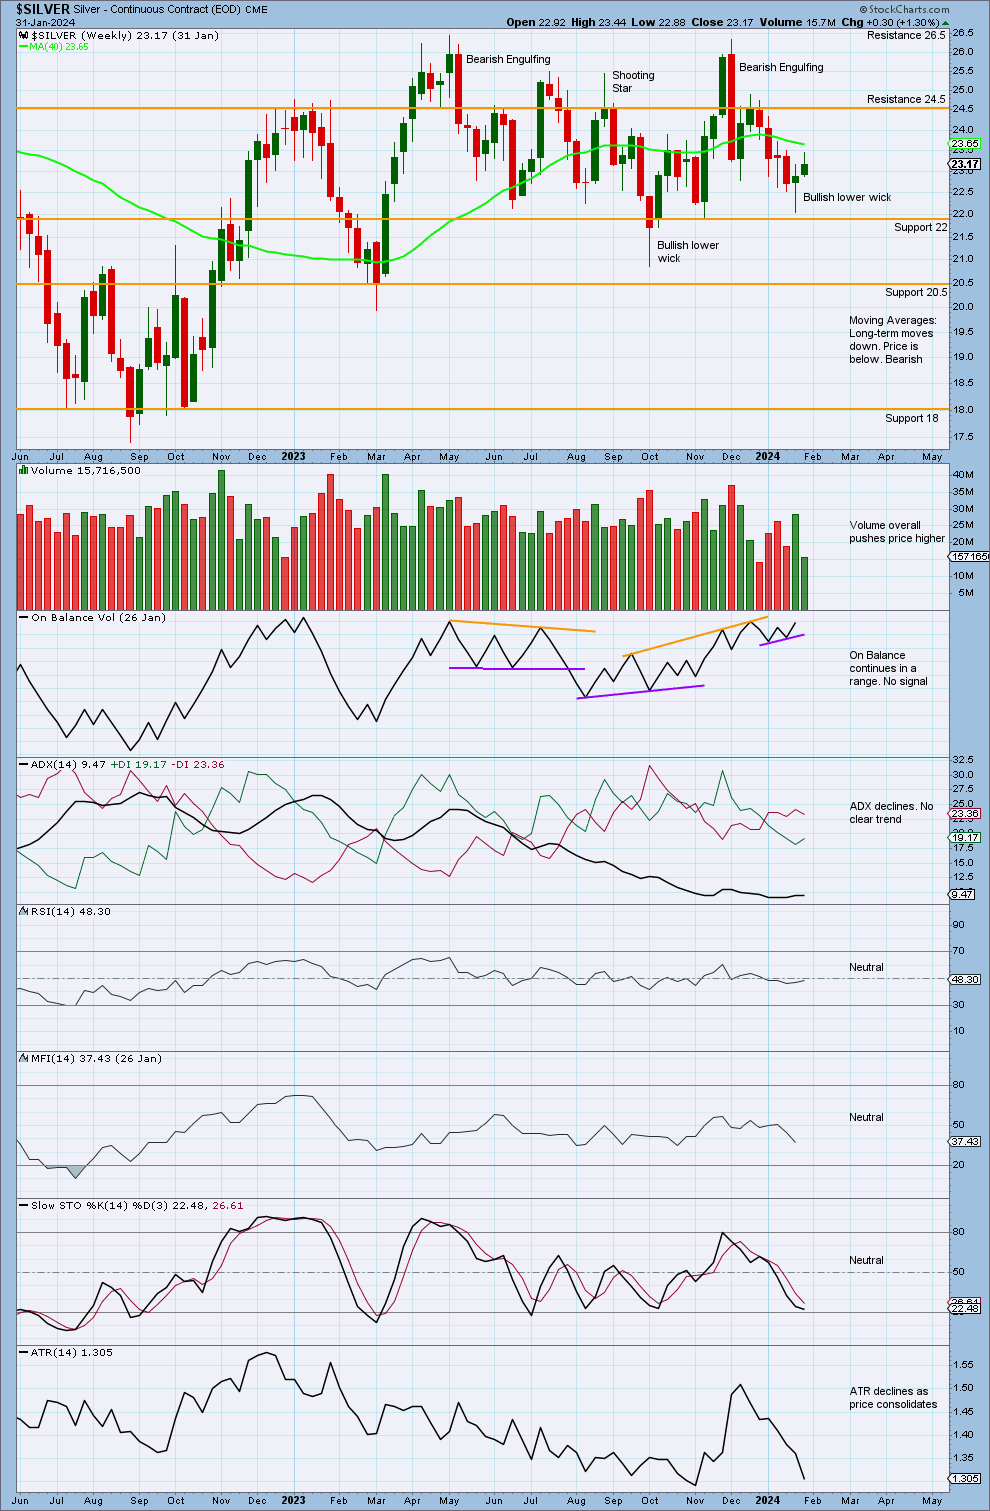
Price has declined, finding support at 22, and is now increasing.
ADX declines, showing no clear trend.
Stochastics nears oversold, though it remains neutral as price moves away from support at 22. An upwards swing may occur here.
DAILY CHART
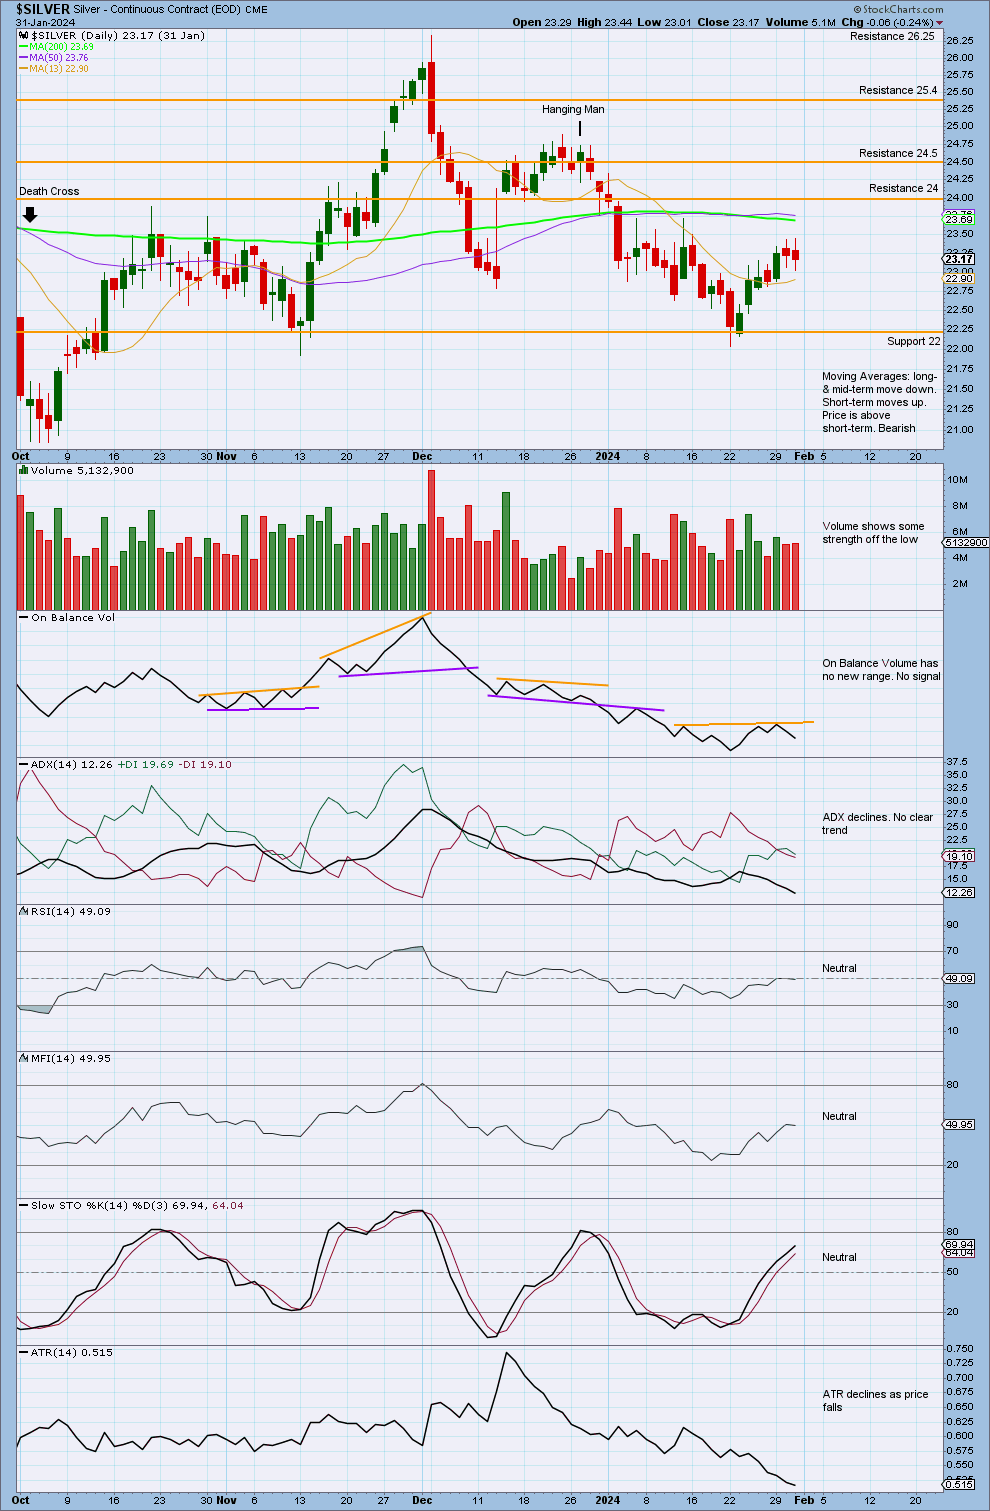
Click chart to enlarge.
Price increases after finding support at 22.
Stochastics entered oversold as price found support, with both now increasing. The model of Stochastics and support and resistance sees an upwards swing to continue at this time frame, potentially towards resistance at 24.
Published @ 06:58 p.m. ET.
—
Careful risk management protects your trading account(s).
Follow our two Golden Rules:
1. Always trade with stops.
2. Risk only 1-5% of equity on any one trade.
—
New updates to this analysis are in bold.
—
 Save as PDF