December 7, 2023: SILVER Elliott Wave and Technical Analysis – Video and Charts
Summary: Price overall increases with overlapping first and second waves. The bullish Elliott Wave count is now the main Elliott Wave count.
Monthly charts are updated today.
BULLISH ELLIOTT WAVE COUNT
MONTHLY CHART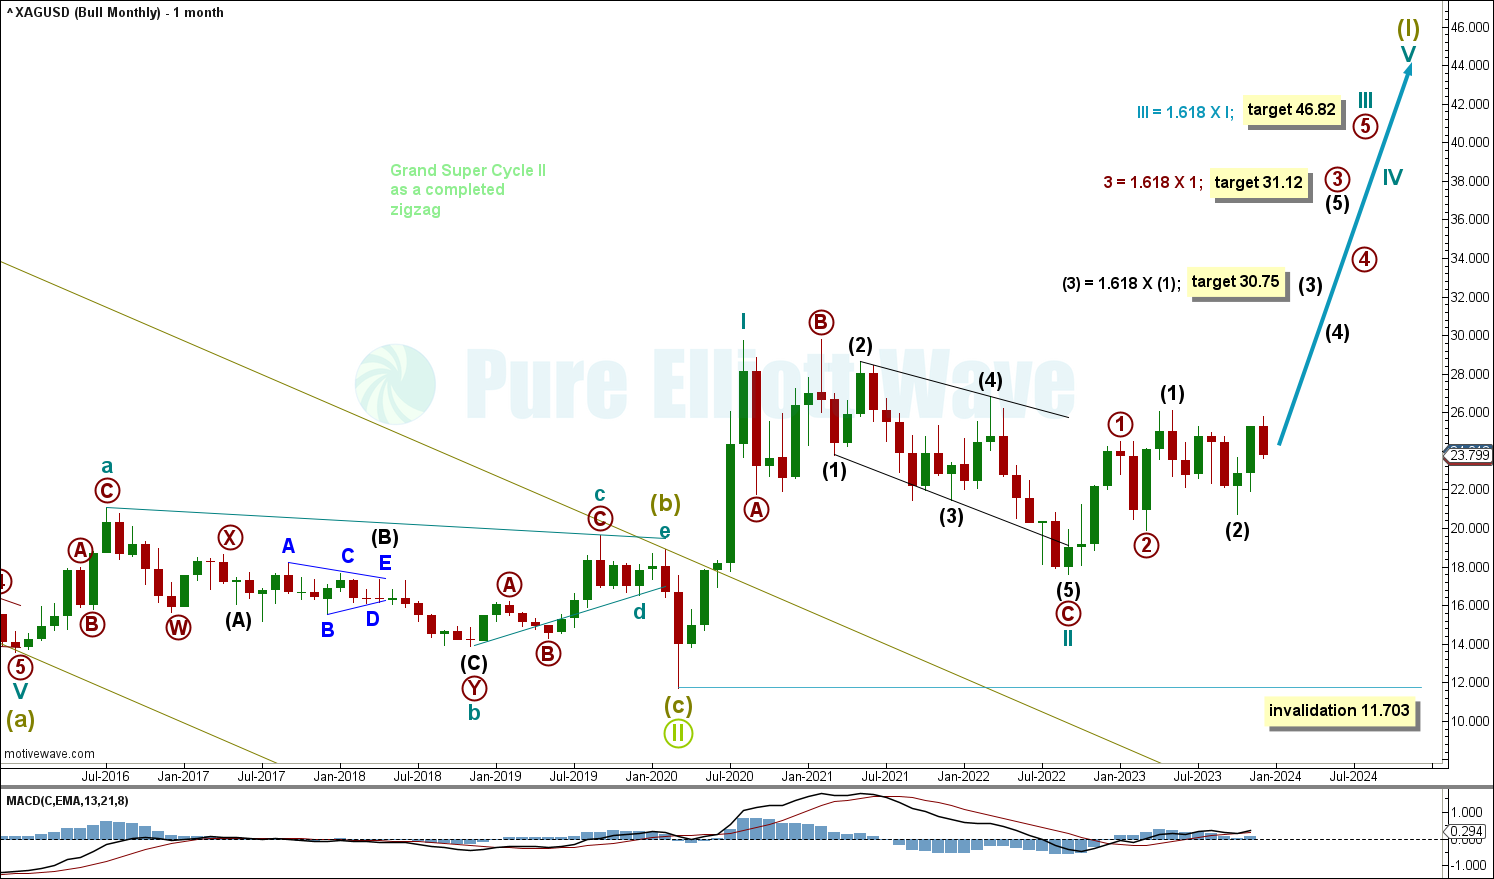
Click chart to enlarge.
Grand supercycle wave II is labelled complete at the March 2020 low. Price is now increasing for overlapping third waves at cycle, primary, and intermediate degrees.
Cycle wave III has a target calculated at 46.82, the 1.618 Fibonacci ratio of cycle wave I. This target may be met in a few years.
Primary wave 3 has a target calculated to reach 31.12, the 1.618 Fibonacci ratio of primary wave 1.
Intermediate wave (3) has a target calculated at 30.75, the 1.618 Fibonacci ratio of intermediate wave (1).
If cycle wave II continues, then it cannot move below the start of cycle wave I at 11.703.
WEEKLY CHART
Click chart to enlarge.
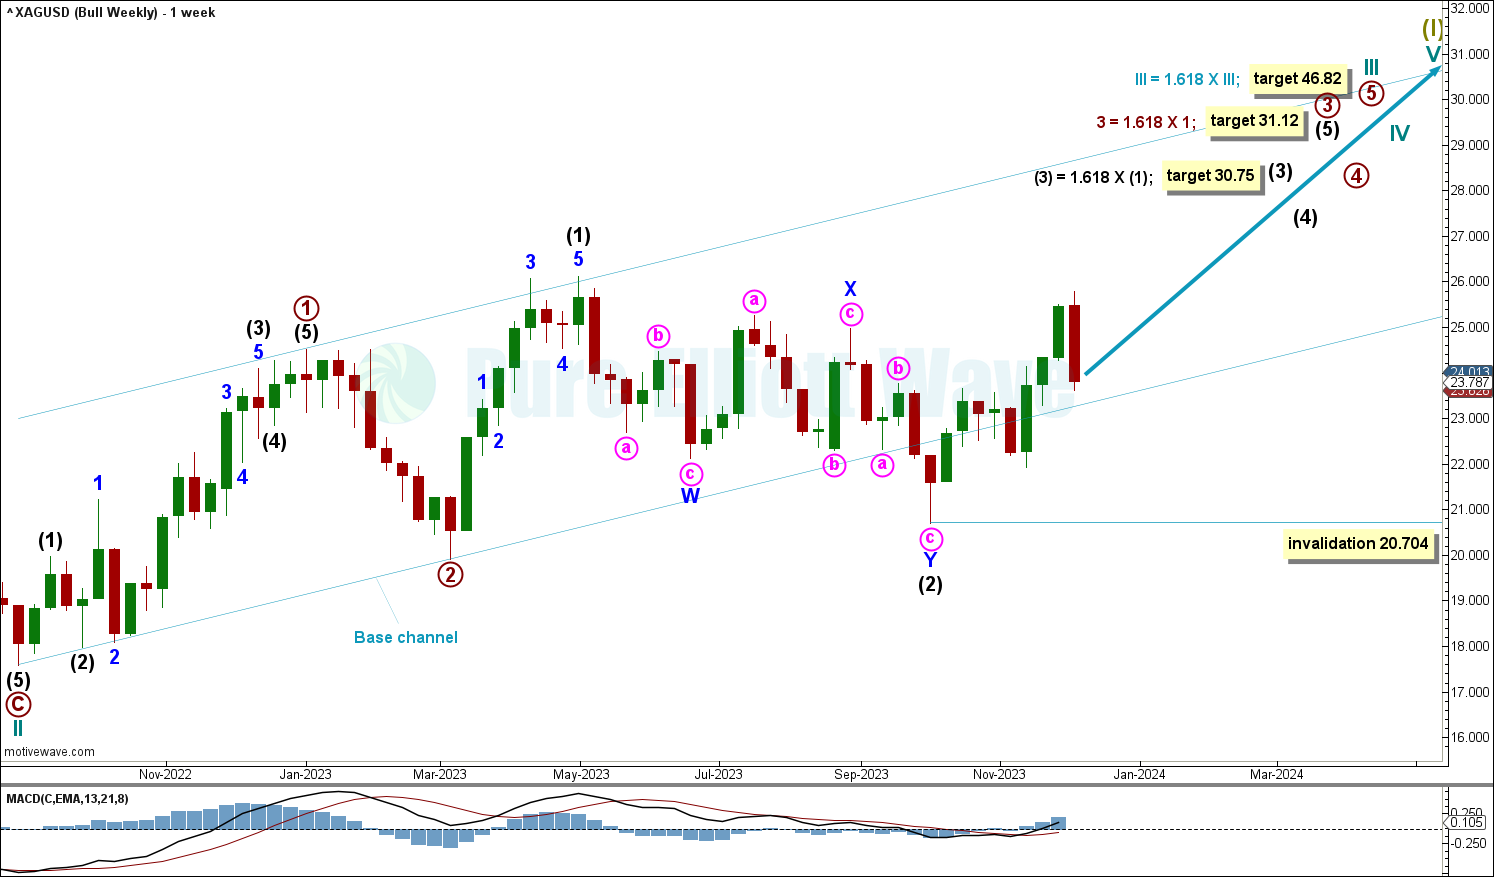
Within the trend of Supercycle wave (I), cycle wave III pulls price higher with overlapping first and second waves.
Overlapping third waves are expected at intermediate, primary, and cycle degrees. Third waves at these degrees should be obvious and come with increasing range and momentum (however, they may start slow as they build momentum). This reduces the confidence in this wave count.
Draw a base channel about primary waves 1 and 2. Draw the first trend line from the start of primary wave 1 to the end of primary wave 2, then place a parallel copy at the end of primary wave 1. The lower edge of the base channel may show where deep corrections may find support. The current third wave movements should break out of this base channel in the direction of the trend. Price is expected to increase for primary wave 3, breaking above the upper edge of the channel.
DAILY CHART
Click chart to enlarge.
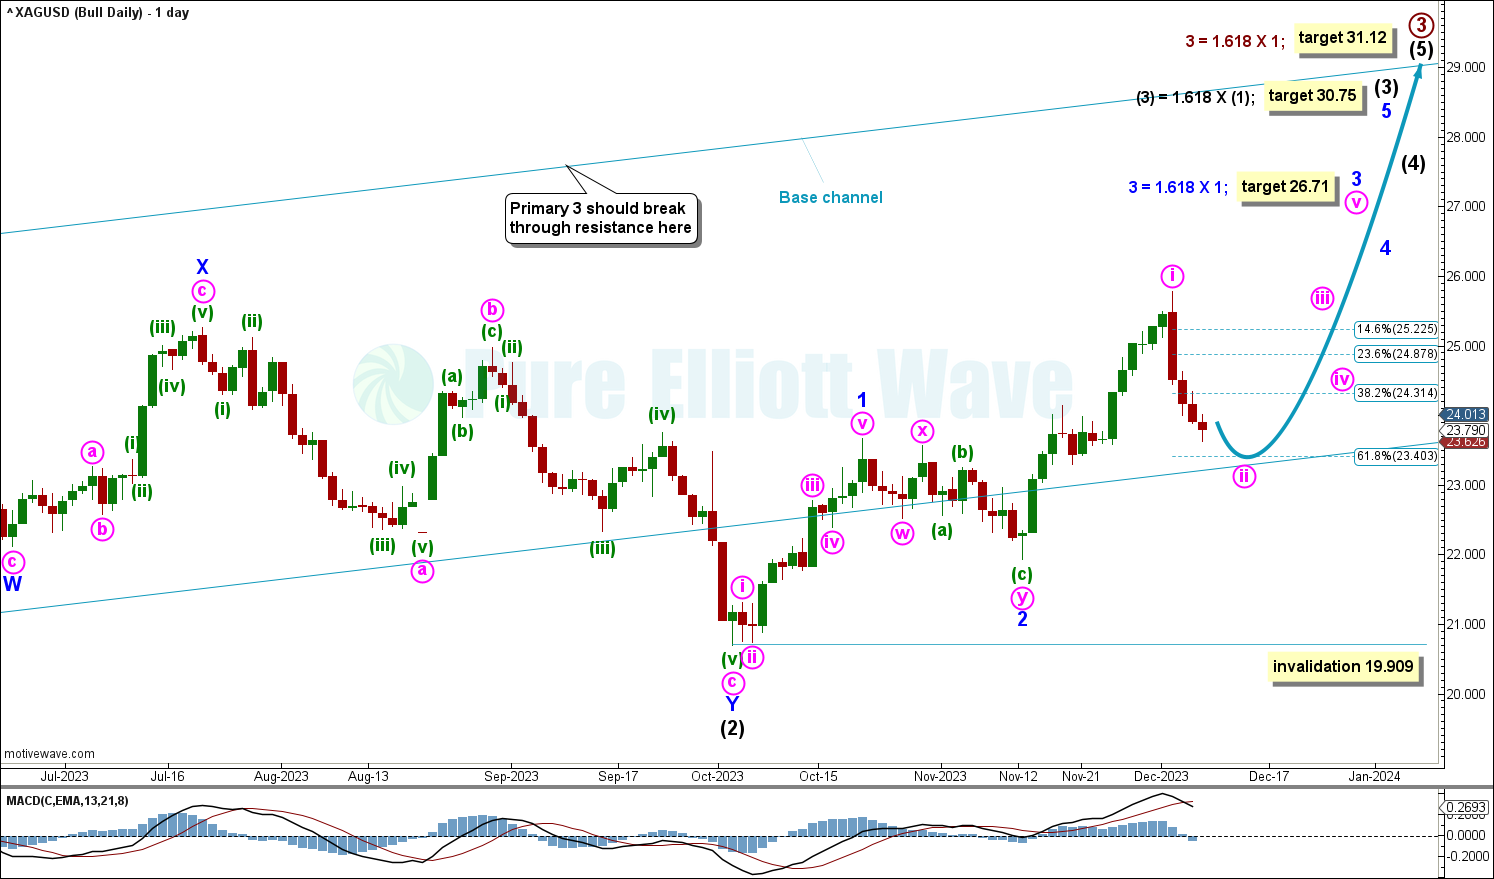
Price increases for intermediate wave (3). A corrective movement is expected to continue for minute wave ii within minor wave 3.
Minute wave ii has a target calculated at 23.403, the 0.618 FIbonacci ratio of minute wave i.
If minor wave 2 continues lower, then it cannot move below the start of minor wave 1 at 19.909.
As price increases above support at the base channel, upwards movement may continue for overlapping third waves.
Primary wave 3 is expected to break through resistance at upper edge of the base channel.
BEARISH ELLIOTT WAVE COUNT
MONTHLY CHART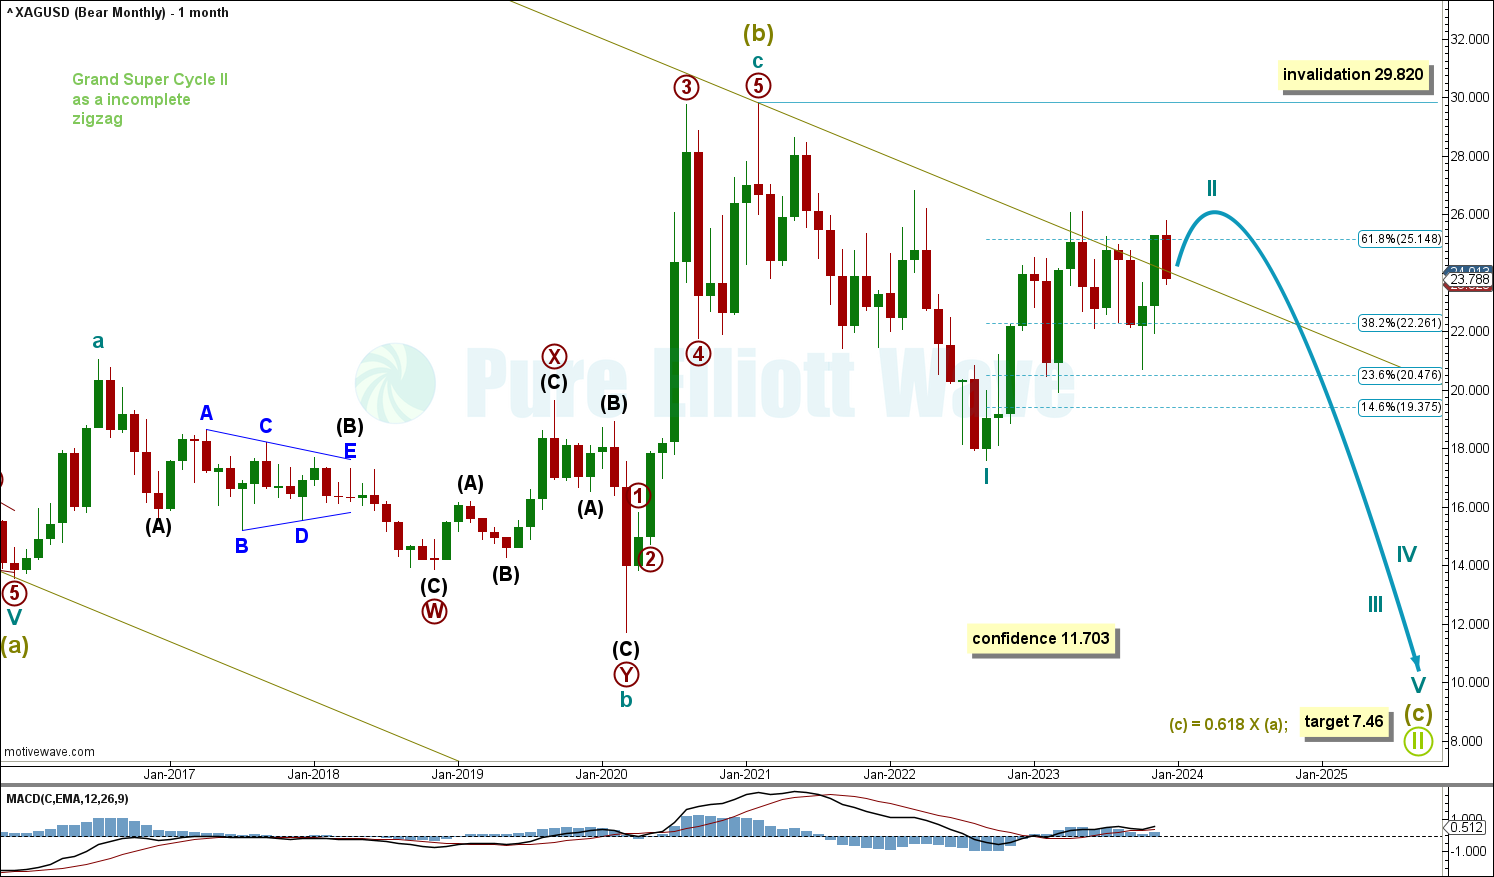
Click chart to enlarge.
This wave count expects grand supercycle wave II to be an incomplete zigzag, currently within supercycle wave (c).
Within supercycle wave (c), cycle wave II is labelled incomplete and is expected to continue to pull price slightly higher before price declines for cycle wave III.
Cycle wave II cannot move above the start of cycle wave I at 29.820.
Cycle wave II has overshot all previous targets. It may be complete here, though we will wait for increased downwards movement before labelling it complete.
Supercycle wave (c) has a target calculated at 7.46, the 0.618 Fibonacci ratio of Supercycle wave (a).
WEEKLY CHART
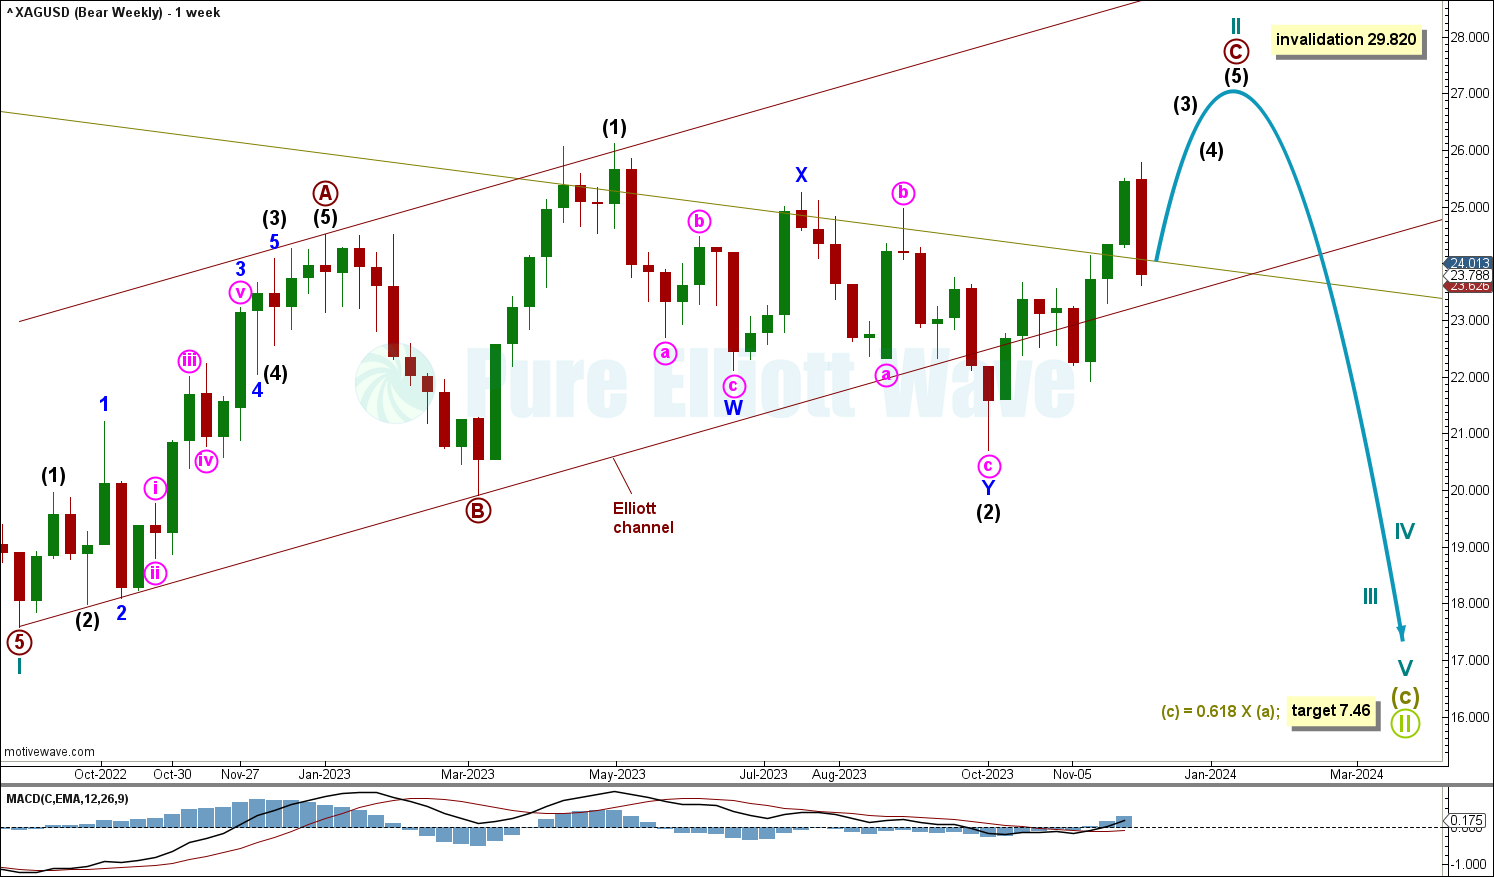
Click chart to enlarge.
An Elliot channel is drawn around cycle wave II using Elliott’s first technique. Draw a line from the start of primary wave A to the end of primary wave B, with a parallel copy placed at the end of primary wave A. The end of primary wave C and cycle wave II may find resistance at the upper edge of this channel.
Price has breached support at the Elliott channel and then returned back into the channel. This reduces the probability of this wave count.
DAILY CHART
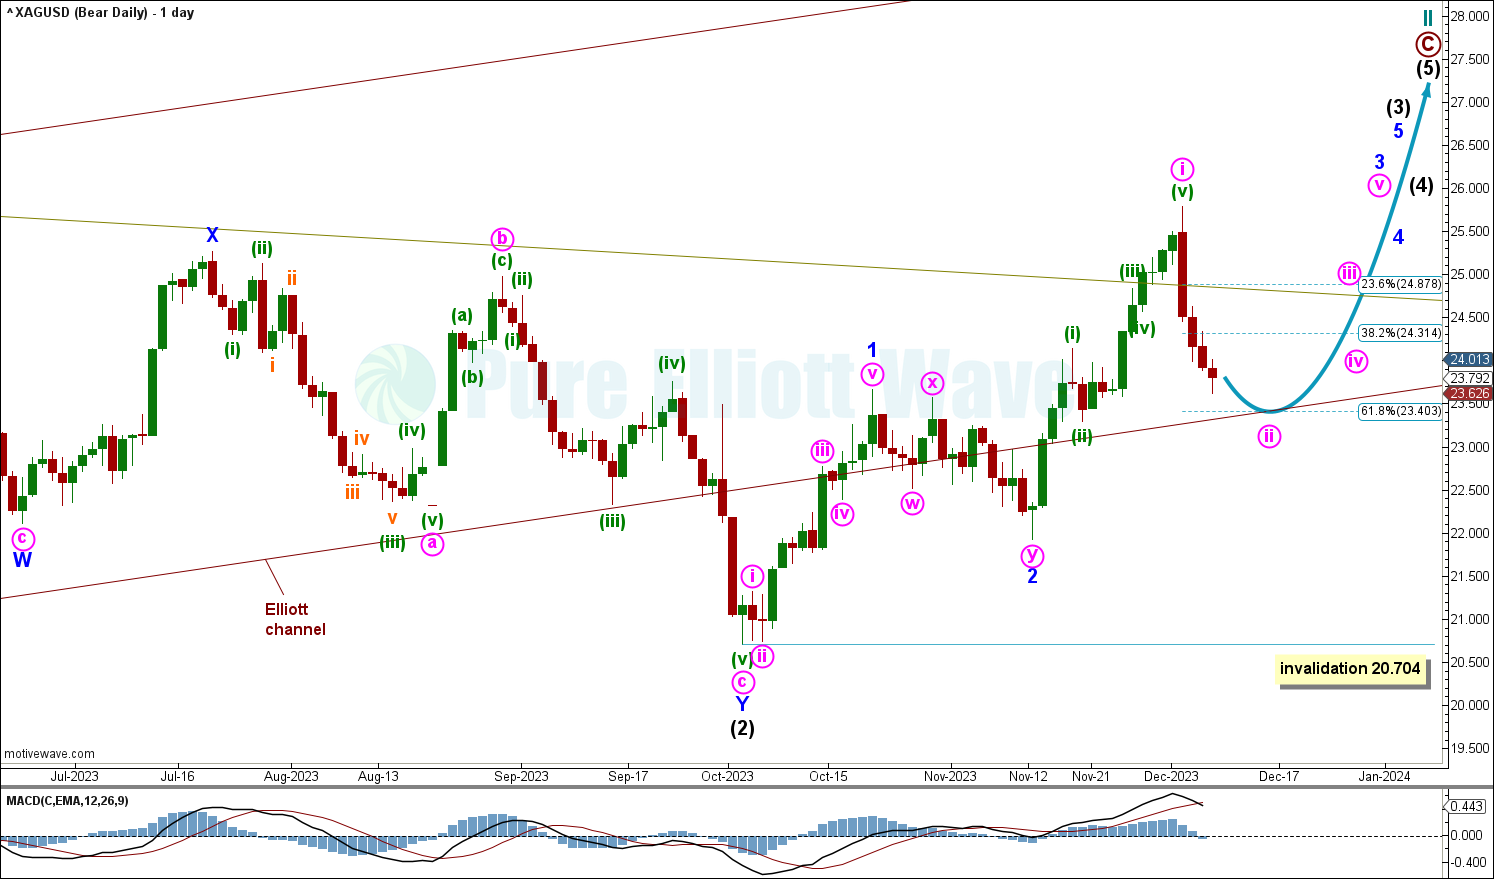
Click chart to enlarge.
Intermediate wave (3) within primary wave C is overall expected to pull price higher.
Within intermediate wave (3), minute wave ii of minor wave 3 is expected to pull price lower. Minute wave ii has a target calculated at 23.403, the 0.618 Fibonacci ratio of minute wave i.
TECHNICAL ANALYSIS
MONTHLY CHART
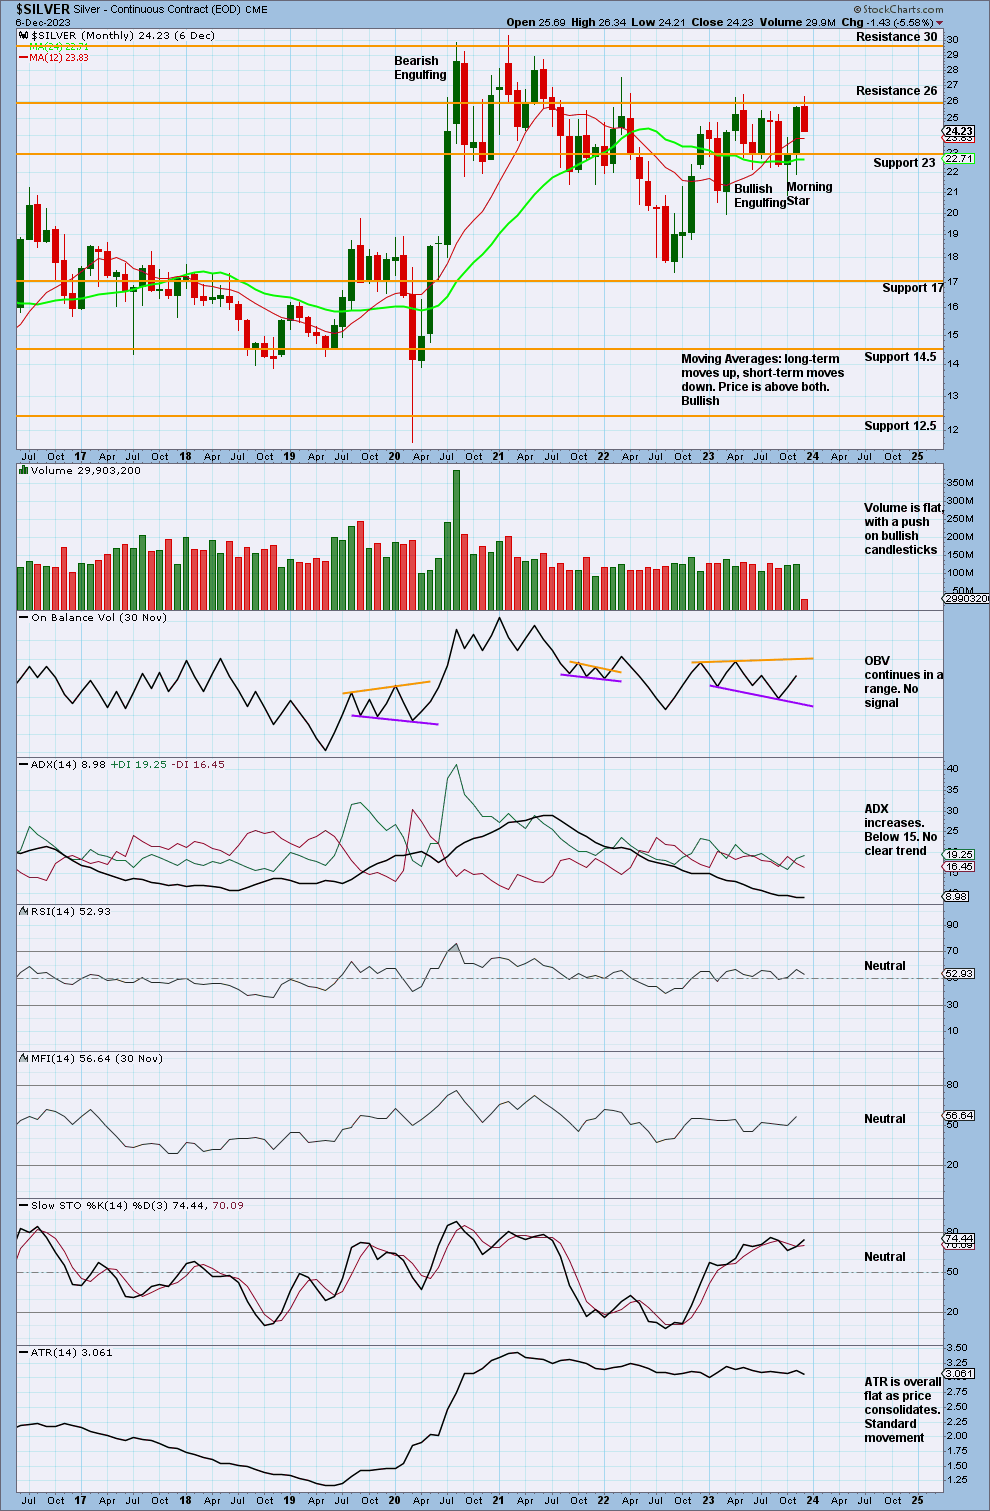
Click chart to enlarge.
Price consolidates within support at 23 and resistance at 26.
Volume has slightly declined from the last price high but is overall flat. However, there is a push on various bullish candlesticks, indicating some strength in bullish movements.
WEEKLY CHART
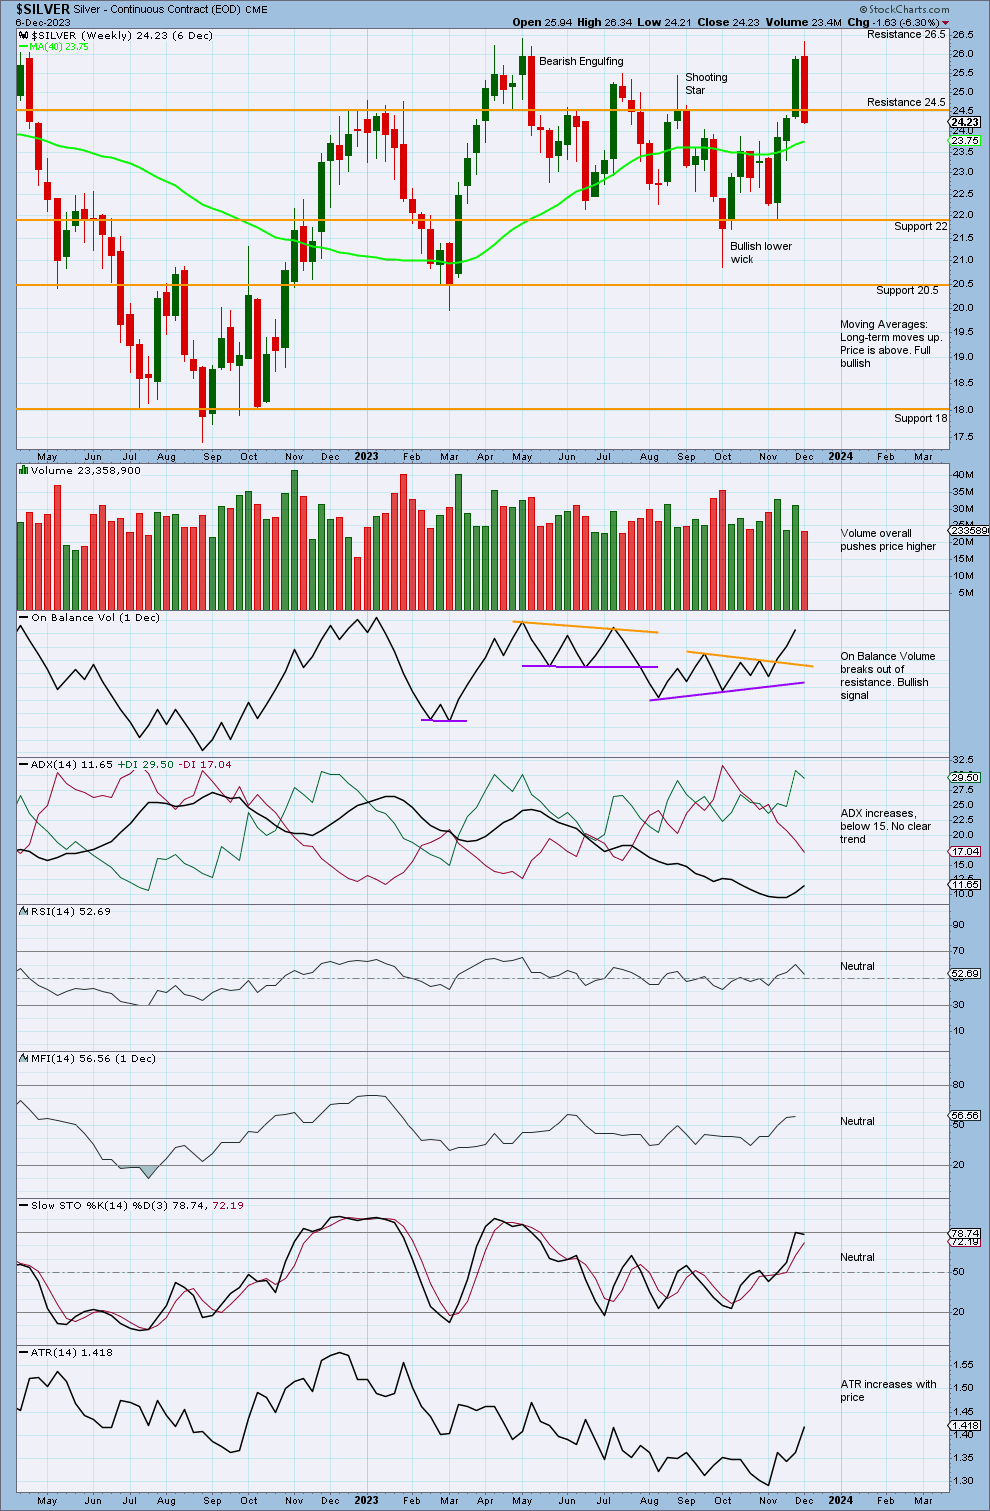
Click chart to enlarge.
Price continues to consolidate within resistance at 26.5 and support at 22.
On Balance Volume has broken out of resistance, giving a bullish signal. This supports the bullish Elliott Wave count.
ADX now increases, though it is below 15 and indicates no clear trend. If ADX increases to 15, then it will give the strongest bullish signal it can, increasing from a low point and below both DX lines.
DAILY CHART
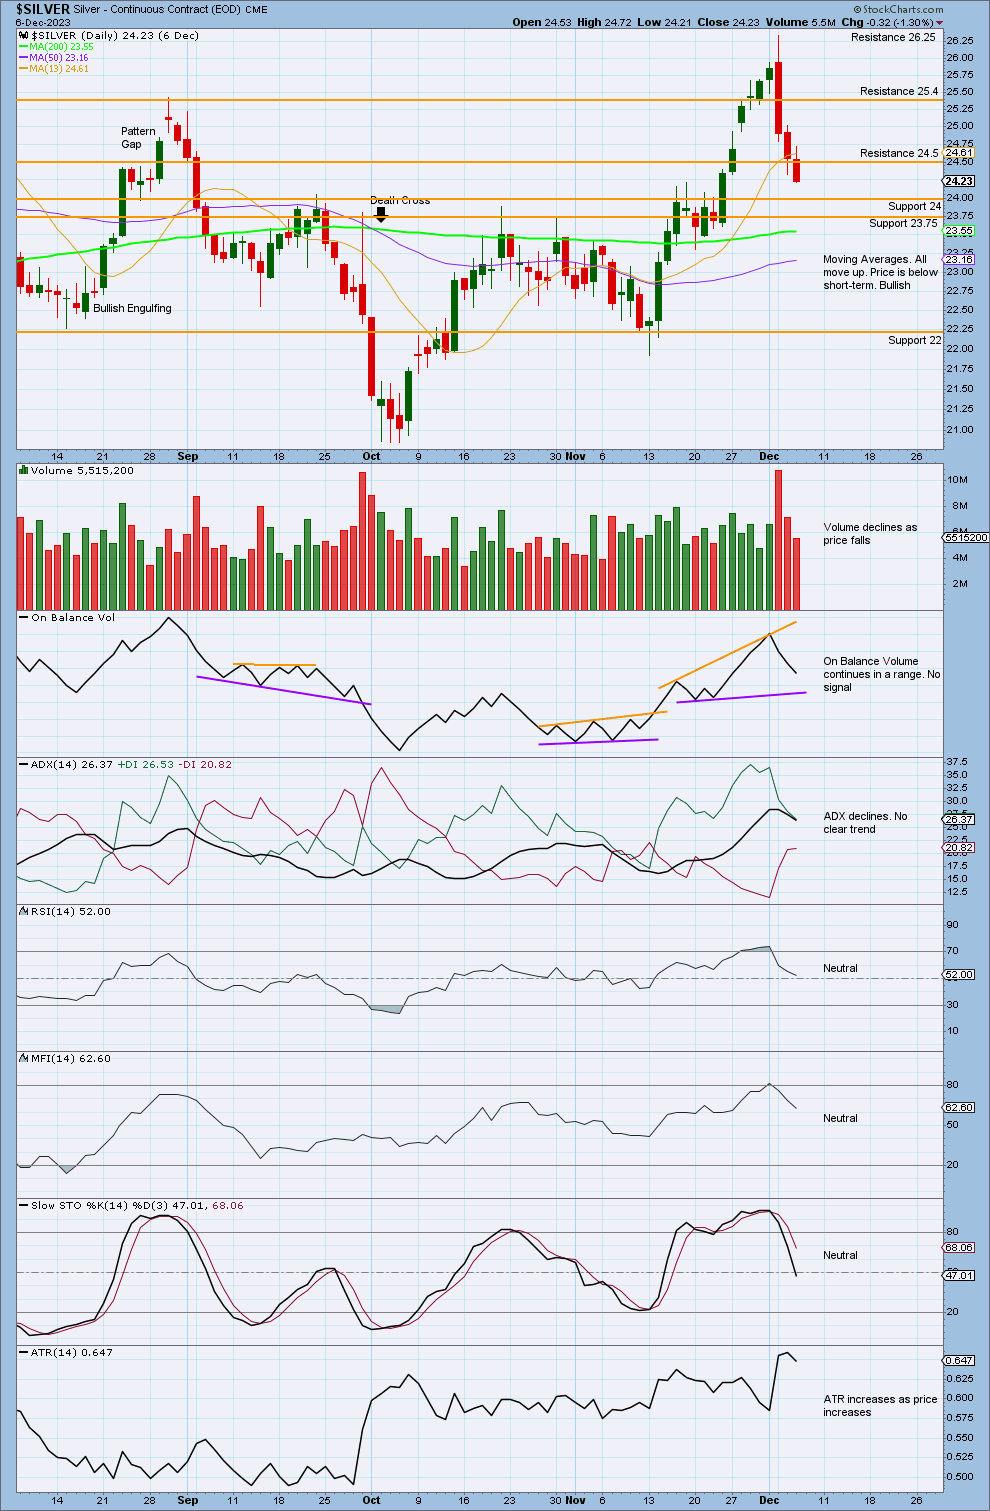
Click chart to enlarge.
Price declines after finding resistance at 26.25.
Volume declines as price falls. Price falls of its own weight.
Stochastics declines with price. A downwards swing may continue towards support at 24 or 23.75.
Published @ 08:53 p.m. ET.
—
Careful risk management protects your trading account(s).
Follow our two Golden Rules:
1. Always trade with stops.
2. Risk only 1-5% of equity on any one trade.
—
New updates to this analysis are in bold.
—
 Save as PDF