Average Directional Indicator – ADX
At any one time a market will be doing one of two things: trending or consolidating. A trader’s approach needs to be different to each type of market. If trend following systems could avoid the whipsaws of a consolidating market, then unnecessary losses can be avoided.
ADX offers a solution. It helps identify which type of market is current.
HOW IT IS CALCULATED
Welles Wilder developed the concept of directional movement in 1978. Directional movement compares two trading periods (usually daily, but it may be used on all time frames).
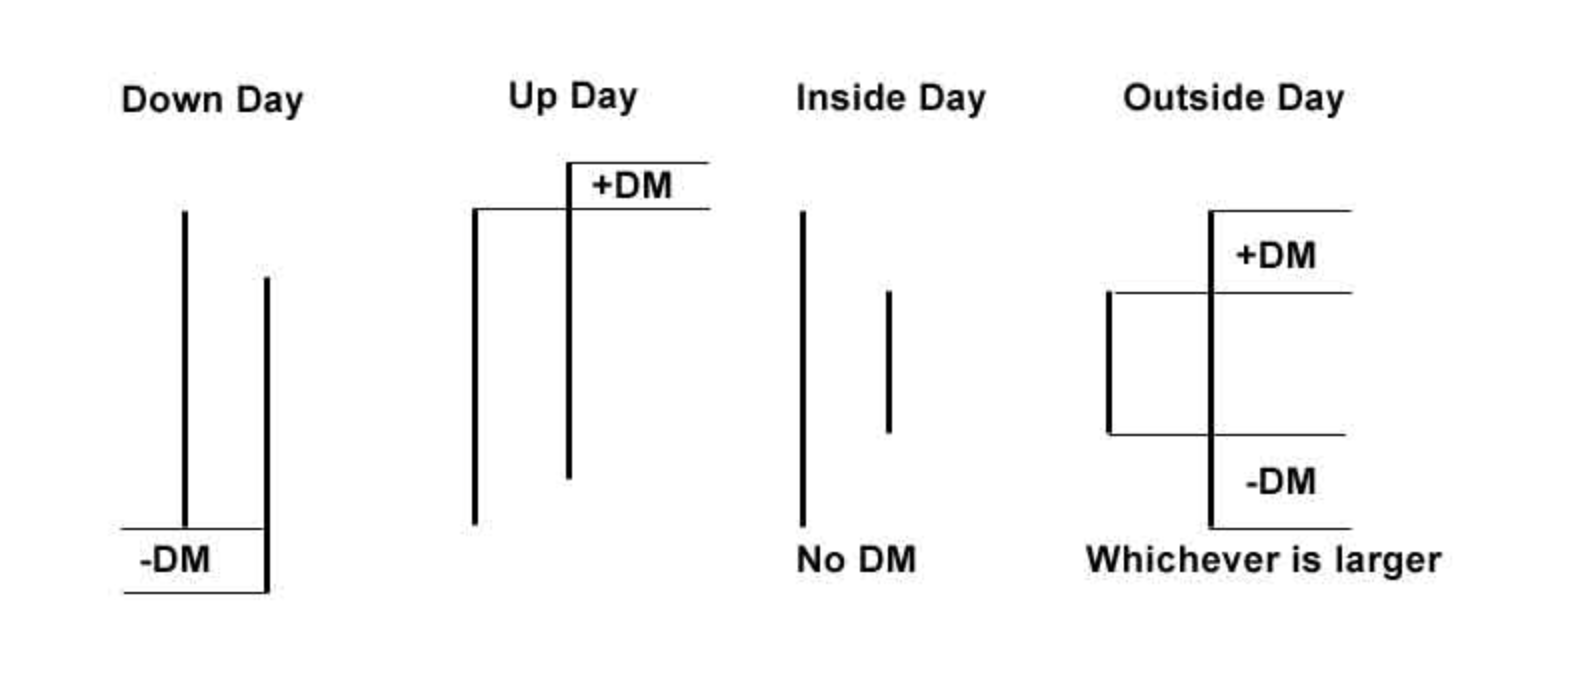
If price moves higher, the difference between the highs is positive directional movement (+DM). If price moves lower, the difference between the lows is negative directional movement (-DM). Inside days do not result in overall directional movement and so are ignored. Outside days take the larger movement only. The figure below illustrates the idea graphically:
A moving average of +DM and -DM is calculated; the standard time frame is 14 days. This creates the +DX and -DX lines in the ADX indicator.
The +DX and -DX lines can be used in (at least) two ways. Whichever is uppermost indicates the direction of the trend; if the +DX line is above the -DX line the trend is up and vice versa.
When the DX lines cross a potential trend change is signalled. When a market moves from trending to consolidating the DX lines will come close together and fluctuate about each other.
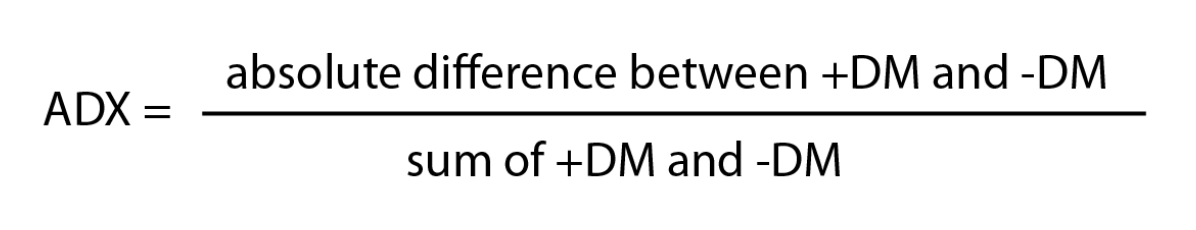
The ADX line (normally black and more solid) is the difference between the two DMs divided by the total of the two DMs. Thus if price is moving strongly in one direction, the numerator will be larger than if price were not moving strongly in one direction:
ADX is bound between 0 and 100. Generally, high and increasing levels indicate a trending market and low and falling levels indicate a consolidating market.
HOW TO USE IT
There are no commonly agreed upon rules, so it is up to each individual trader to test their own rules to determine which approach fits their trading style and preferred market. Below some guidelines are offered as a starting point.
From Dahlquist and Kirkpatrick, “Technical Analysis”:
These general rules for using ADX were originally provided by Ashwani Gujral.
When ADX is rising and at a level:
– Between 15 and 25: Beginning of trending; use trending indicators
– Between 25 and 45: Definite trending; use trending indicators
– At 45 or above: Overextended; watch for trend turning point; use price or indicator patterns
When ADX is declining and at a level:
– Below 20: Low volatility; very short swings; no trend; use oscillators
– Between 20 and 30: Consolidation; use oscillators
– Between 30 and 45: Correction from extreme likely; use patterns; trending indicators
Ruggerio offers the following rules which are a little different (from Kaufman, “Trading Systems and Methods”):
1. If ADX crosses above 25 the market is trending.
2. If ADX crosses below 20 the market is consolidating
3. If ADX crosses below 45 after being higher, the market is consolidating.
4. If ADX rises above 10 on 3 of 4 days after being lower, the market will start to trend.
5. A trend based on rule 4 remains in effect until the 5 day difference in the ADX is less than zero.
LIMITATIONS
Because ADX and +DX and -DX are based on moving averages of +DM and -DM, it suffers from the effect of lag that all moving average systems have. The standard period to average is 14 days, so a new trend will not be indicated until well into the first two weeks of it.
References: Kaufan, P. Trading Systems and Methods; Kirkpatrick, C and Dahlquist, J. Technical Analysis: The Complete Resource For Financial Market Technicians; Pring, M. Technical Analysis Explained.