Scale – Arithmetic or Semi-Log?
Click chart to enlarge.
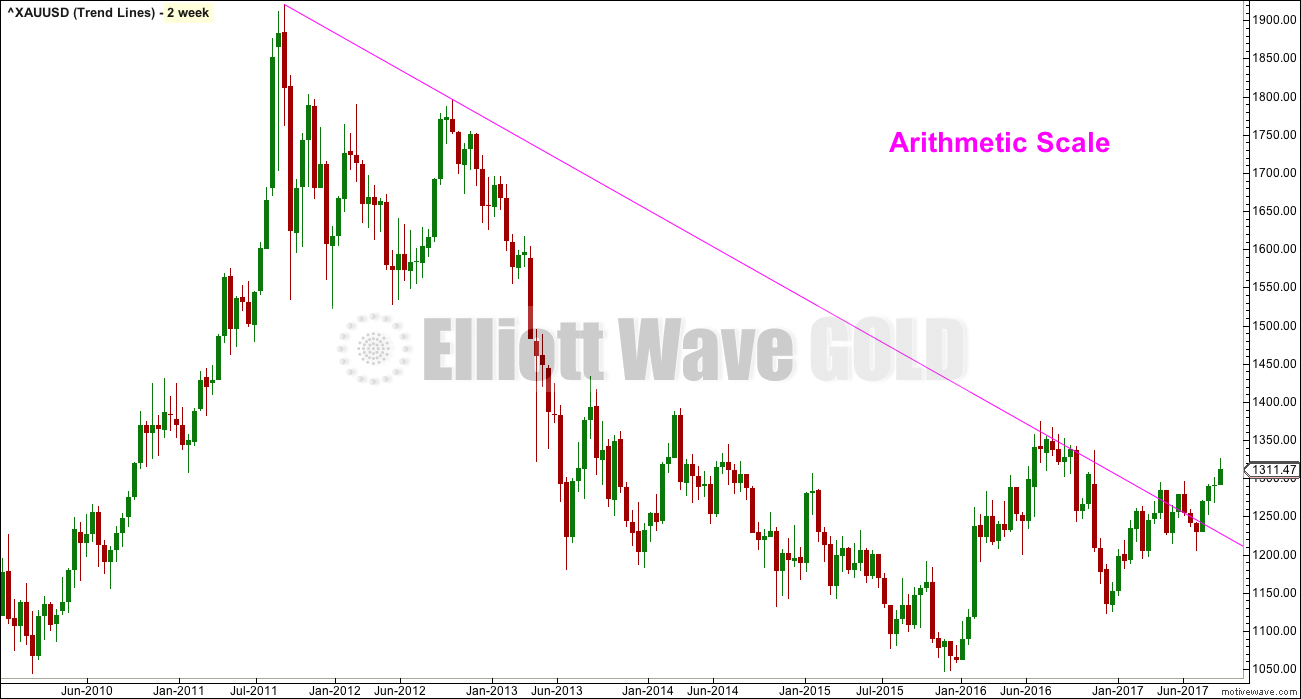
The chart above shows Gold 2 weekly on an arithmetic scale. Notice the bear market trend line has been breached, but did not show where price exactly found support and resistance in the process.
Click chart to enlarge.
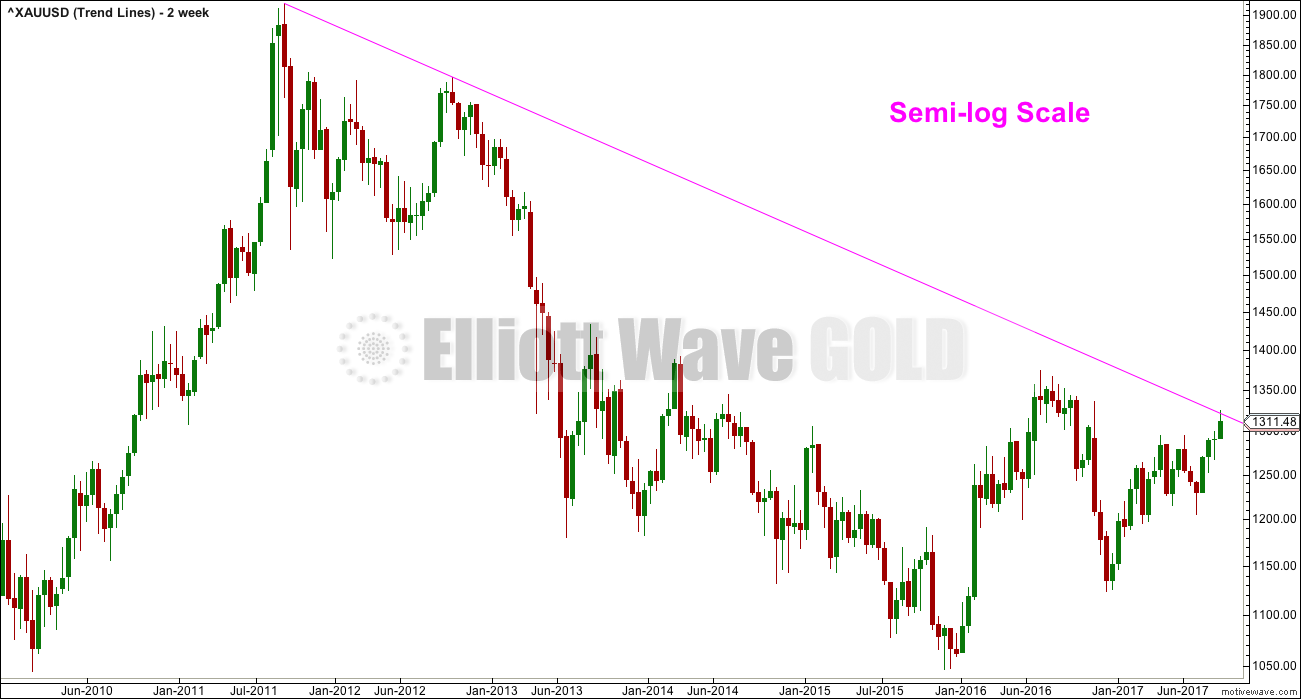
The chart above shows Gold 2 weekly on a semi-logarithmic scale. So far price remains below the bear market trend line.
An arithmetic scale is best used for short term price movements. But for long term movements a semi-logarithmic scale is more correct, particularly for markets like Gold which can exhibit blow off tops and selling climaxes.
Any long term movement a year or more should always use a semi-logarithmic or ratio scale.
From Magee (“Technical Analysis of Stock Trends”, 9th edition, page 11):
“Our own experience indicates that the semilogarithmic scale has definite advantages in this work; most of the charts reproduced in this book employ it… Percentage relations, it goes without saying, are important in trading in securities… certain trend lines develop more advantageously on the ratio scale.”
From Pring (“Technical Analysis Explained”, 4th edition, page 68):
“Arithmetic scaling is not a good choice for long-term price movements, since a rise from 2 to 4 represents a doubling of the price, whereas a rise from 20 to 22 represents only a 10 percent increase… For this reason long term price movements should be plotted on a ratio or logarithmic scale. The choice of scale does not materially affect daily charts, in which price movements are relatively small in a proportionate sense. For periods over 1 year, in which the fluctuations are much larger, I always prefer to use a ratio scale”.
Published @ 04:28 p.m. EST.