3 Most Important Things to Consider for Candlestick Reversal Patterns
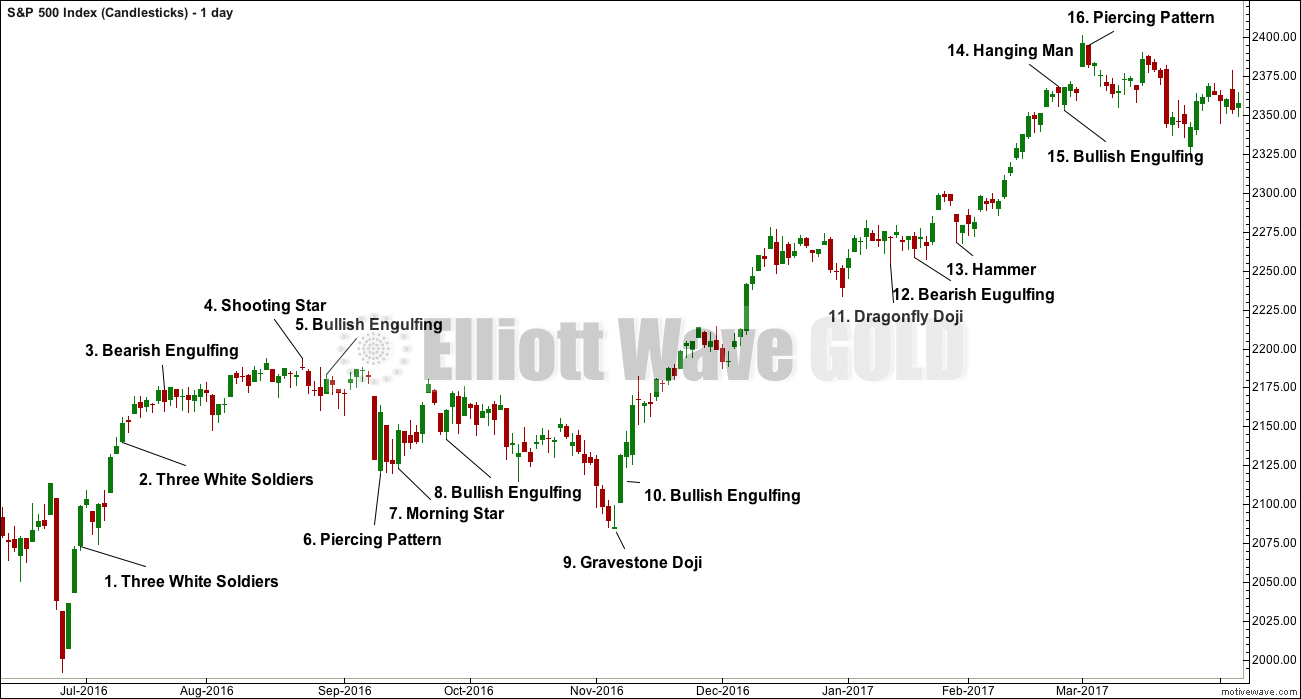
The first #1 and #2 patterns are both Three White Soldiers. Pattern #1 comes after a short sharp fall in price, so it may be considered a reversal pattern. But pattern #2 comes within an upwards trend, so it is more of a continuation pattern here and would not be considered a reversal pattern as there was nothing to reverse.
This leads to point number 1:
For a reversal pattern to have meaning there must be something to reverse. A bullish reversal pattern should come after a decline in price. A bearish reversal pattern should come after a rise in price.
Pattern #3 is an important reversal pattern and it does come after a steady rise in price. It correctly predicted a consolidation.
This leads to point number 2:
Reversal patterns mean a reversal of the prior trend to the opposite direction or sideways. They do not only mean a complete 180 degree reversal; sideways is a direction too.
The Shooting Star at #4 does not come after a bullish rally. It comes within a consolidation, so it should not be considered a reversal pattern. This is another illustration of point number 1.
Likewise, the Bullish Engulfing pattern at #5 comes within a consolidation. There is nothing here to reverse.
The Piercing Pattern at #6, however, does come after a short sharp fall in price, so it should be considered a reversal. It did correctly predict the following 7 days of upwards movement.
This leads to point number 3:
Reversal patterns make no comment on how far price may travel in the new direction.
The Morning Star at #7 is the second reversal pattern at lows after a short sharp fall. Along with the Piercing pattern, it correctly predicted the next rise in price.
However, the Bullish Engulfing pattern at #8 does not come after a fall in price. It comes within a consolidation. There is nothing here to reverse, so it should be ignored.
The Gravestone Doji at #9 is normally a bearish reversal pattern. Its forte is in calling tops. Here, it comes at the end of a bearish movement, so it is out of context. It cannot be calling a reversal in a bull move as there was no bull move prior to the pattern.
At #10 the Bullish Engulfing pattern does come after a reasonable fall in price, so it should be considered a reversal pattern. This pattern was followed by a persistent bullish move.
Like the Gravestone Doji, the Dragonfly Doji at #11 is out of context. Here, it is at highs and within a small consolation. Dragonfly Doji are bullish reversal patterns when they occur after a bearish move, but this one does not.
Another pattern within the consolidation at #12 should be ignored. There is no bullish move here to reverse for the Bearish Engulfing pattern.
The Hammer pattern at #13 does not come after a reasonable bearish trend; it was only the second day of a fall in price. There is nothing to reverse, so it should be ignored. The long lower wick is still bullish though. As a Hanging Man pattern it would require bearish confirmation in the following candlestick, which did not come.
The Hanging Man at #14 though does come after a bullish move. But the bullishness of its long lower wick still requires bearish confirmation, which did not come. The following candlestick is quite the reverse; it is another bullish signal. As #15 comes within a small consolidation, it may be considered as a bullish signal.
Finally, the Piercing pattern at #16 comes after a long upwards trend, so it should be considered as a bearish signal.
Published @ 05:57 a.m. EST.

