On Balance Volume (Beyond Volume Basics)
Click chart to enlarge.
On Balance Volume can be used in two ways.
1. When On Balance Volume creates a range draw trend lines across its highs and lows. A breakout by On Balance Volume can sometimes precede a breakout from price, so On Balance Volume can be a leading indicator. Other times On Balance Volume may break out with or after price, it can then be a confirming indicator. Used this way On Balance Volume works very well.
2. Divergence between price and On Balance Volume can be used to indicate weakness and an impending trend change. This divergence can persist for some time prior to a trend change, so it is not useful in picking highs or lows.
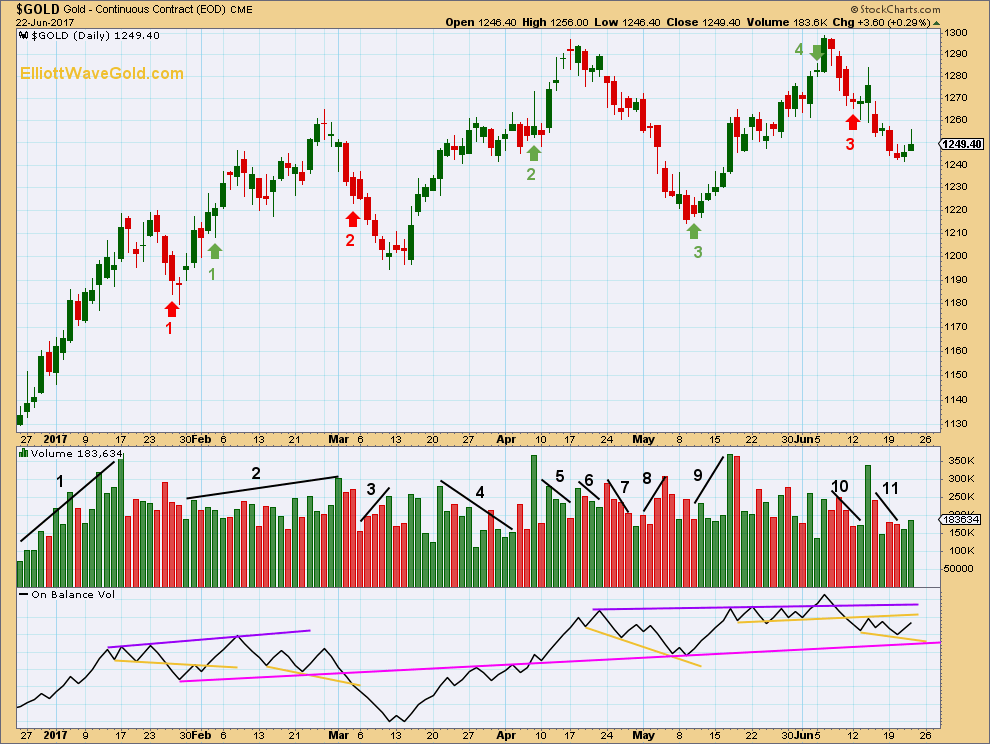
Trend lines are drawn on On Balance Volume in the chart above. Resistance is in purple, support in yellow. A long term line is added in pink.
Bullish signals are noted in green arrows on price:
1. Halfway through an upwards trend On Balance Volume breaks above resistance which was prior support. This adds some confirmation to the trend. Traders may have more confidence in long positions.
2. A long term trend line which previously provided support, then resistance, is breached. This adds confidence in the upwards trend continuing.
3. A long term trend line is touched after some time. The bounce up and away is bullish.
4. A breach of resistance is a bullish signal. This illustrates that this technique does not always work. Price continued higher for only one more day before a major reversal.
Bearish signals are noted in red arrows on price:
1. A breach of support is a bearish signal, which should confirm the downwards trend. But a low is found the next day. Again, this technique works more often than it fails, but it can fail.
2. A break of a long term support line halfway through a downwards trend offers confidence in short positions.
3. Another break below a support line offers confidence in the downward trend.
In addition to breaches of trend lines, tests of support and resistance also offer signals.
Using On Balance Volume in conjunction with volume bars adds considerable depth to analysis.
This analysis is published @ 03:41 a.m. EST.