2 Steps to a High Probability Trade Set-up
Click chart to enlarge.
To begin, look for a trend line which has strong technical significance. In deciding how strong or weak a line is use these guidelines here.
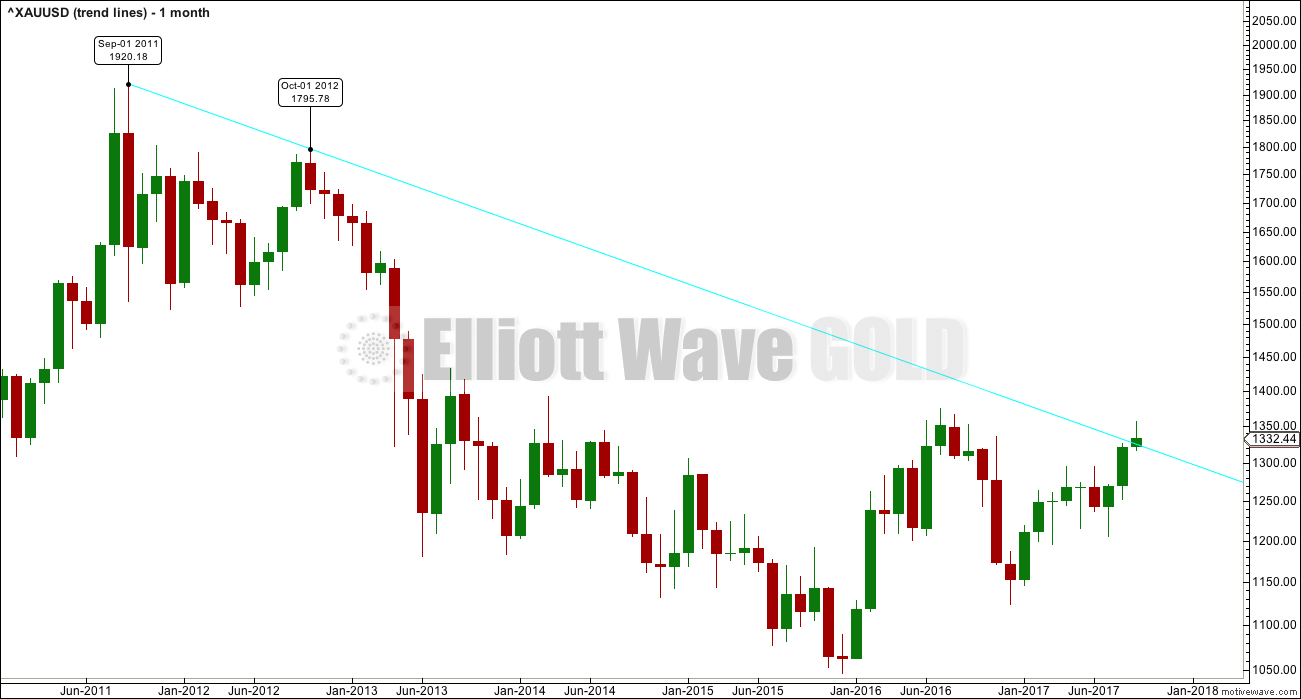
This trend line on Gold’s monthly chart is drawn as a bear market trend line as illustrated here.
Click chart to enlarge.
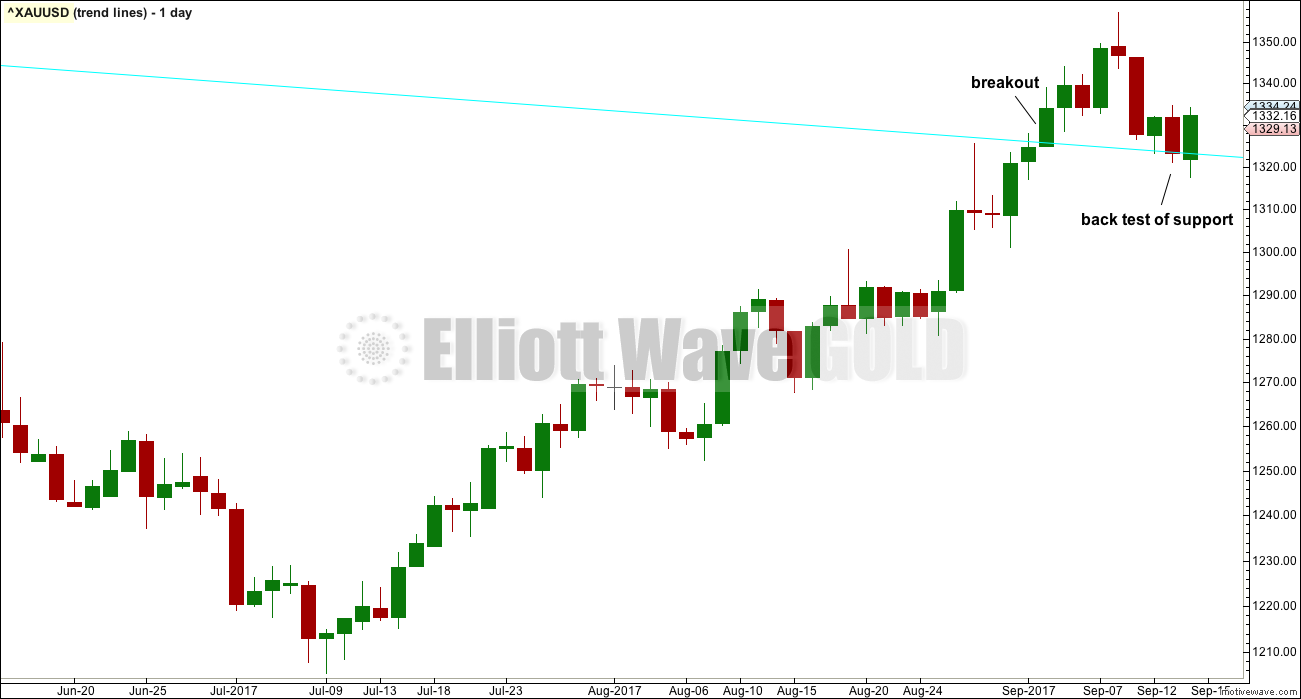
Zooming on at the daily chart level to see exactly where the line sits, we can see that price is not sitting perfectly upon it. That may be because this trend line extends so far back, to September 2011. The general idea does appear to be working here today though.
This is the trade set up:
Step 1.
Look for a breach of the trend line. If this is achieved on strong volume, then have more confidence in the breach. StockCharts data does show very strong volume for the 5th of September, which is the daily candlestick on their data that would have been the day of the breach.
Step 2.
Look for price to curve around and back test support at prior resistance (or in a bear market resistance at prior support). Enter in the direction of the larger trend when price tests the trend line.
This set up takes time. In this case a wait of 7 to 8 days after the initial break above the trend line.
Today, the long lower wick and bullish engulfing candlestick pattern offer a little more confidence in this set up.
Why is this such a good trade set up?
With a technically significant trend line, the set up offers an entry point to a trend which traders may have confidence in. The more significant the line, the more significant the breach.
Stops may be set quite close by. Allow a little room for overshoots, and for longer held lines slightly larger overshoots, but stops may be closer than the last swing low or high. This reduces risk.
Published @ 01:15 a.m. EST.