Trading With Gaps – A Case Study Using AAPL
Click chart to enlarge.
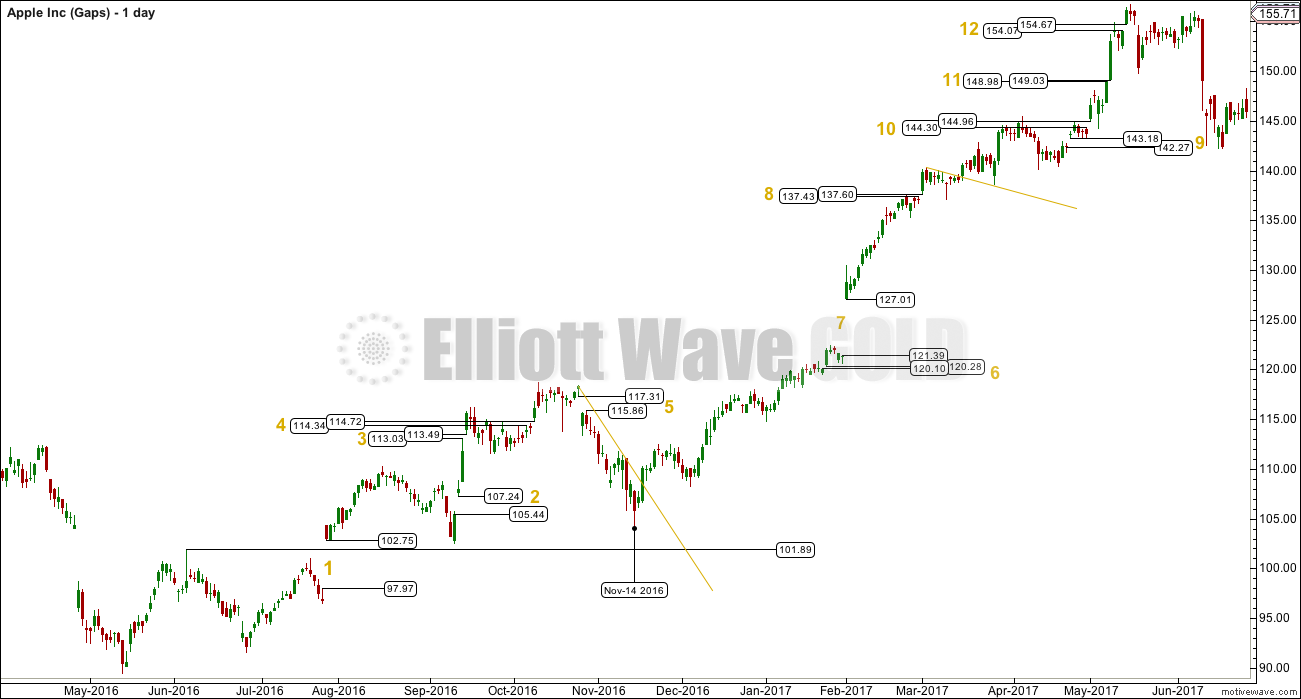
This daily chart of AAPL data shows at least 11 gaps.
After a period of consolidation gap #1 appears. It breaks above an upper range from a consolidation, so it should be considered a breakaway gap. A position may be entered in the direction of the gap, with a stop just below the lower edge of the gap. Breakaway gaps should not be closed, so the lower edge should offer support if there is a new upwards trend.
After some upwards movement price curves down to test support, but the breakaway gap remains open and so should long positions.
Thereafter, another gap at #2 indicates another breakaway from the last consolidation. Stops may now be moved up to the lower edge of this gap.
Another gap at #3 may be initially expected to be a measuring gap, which would give a target at 119.28. If this is a measuring gap, it should not be closed for a long time and the lower edge should offer support; stops may again be pulled up to just below it. But this gap is closed three days later, which should trigger an exit from a long position opened after gap #1 and which should yield a reasonable profit.
Gap #4 may initially be expected to be another breakaway gap after another small consolidation. It may trigger another long entry, but the gap is closed six days later for a small loss.
Gap #5 is not a breakaway below support and should be considered a pattern gap. These are most often closed. This should not trigger any new position.
After several days of falling price, a trend line may be drawn across resistance. When the trend line is breached, a long position may be entered or traders may choose to wait for another gap. There is not another gap until a few weeks later at #6.
Gap #6 may be taken as another breakaway gap after a small consolidation. This may again signal an entry in the direction of the gap with a stop just below the lower edge. Four days later price curves down to test support and the gap remains open.
Another large gap opens at #7. Given the size of this gap the appropriate measure for the movement before it may be the last reasonable swing low on the 14th of November. This gap looks like a measuring gap. A target may be calculated from the base of the movement prior to the gap and added to the upper edge of the gap. This gives a target at 144.32.
Stops may again be moved up to just below the lower edge of the gap; it should provide support as measuring gaps should not be closed. Now some profit is protected on a long position with a target at 144.32.
Gap #8 opens up prior to the target being met. This should be expected to be another measuring gap until proven otherwise. Stops may again be moved up to just below the lower edge of the gap to protect more profit. The new target would be calculated from the last rise from the last gap and added to the upper edge of the gap, giving a new target at 148.02.
But this gap is closed six days later signalling it was an exhaustion gap and not a measuring gap. Positions would then be closed for a reasonable profit.
After some further consolidation in which trend lines may be used to find another entry, or traders may wait for another gap, the next gap opens up at #9 a few weeks later. Again, this comes after some consolidation, so it may be either a pattern gap (it may be considered within a consolidation) or it may be a breakaway gap. A position may be entered in the direction of the gap with a stop just below the lower edge. If it is a pattern gap, a small loss may be incurred. If it is a measuring gap a good entry point for the next upwards movement may be found.
Price curves down to test support at the upper edge of the gap two and three days later. The gap remains open and long positions remain open.
Another gap opens at #10. This may be another breakaway gap, but coming so soon after the last one it may also be a measuring gap. The move prior to it is small, so the target would be calculated from the move prior to the gap and added to the upper edge of the gap, giving a target at 146.08. This target is met the following day, so positions may be closed for a profit. Two days later the gap is closed indicating it is an exhaustion gap and not a measuring gap. No new positions should be entered as price may be entering a larger consolidation.
Another gap opens up at #11 on a strong upwards day. This may be another breakaway gap, so a new position in the direction of the gap may be opened with a stop just below the lower edge of the gap.
The last gap opens up at #12. This may be another measuring gap, so it should not be closed. Stops may be moved up to just below the lower edge of the gap, which would now protect some profit. A target calculated from the rise prior to the gap added to the upper edge of the gap gives a target at 159.69. This target is not met and the gap is closed three days later as the stop is hit yielding another profit.
Conclusion: Gaps can be useful for trading in markets where they appear regularly. Some patience is required in holding onto positions, which may be underwater for the first few days, but overall this approach may yield more profit than loss. Small losses are inevitable and risk must still be managed.
Published @ 05:32 a.m. EST.