Volume Basics
The opposite isn’t necessarily true for a falling market. Price can fall due to an absence of buyers, just as it can with increasing activity of sellers. Rising volume with falling price is good to see as it supports the trend, but it is not necessary.
Does Gold’s price and volume conform to this basic principal of technical analysis?
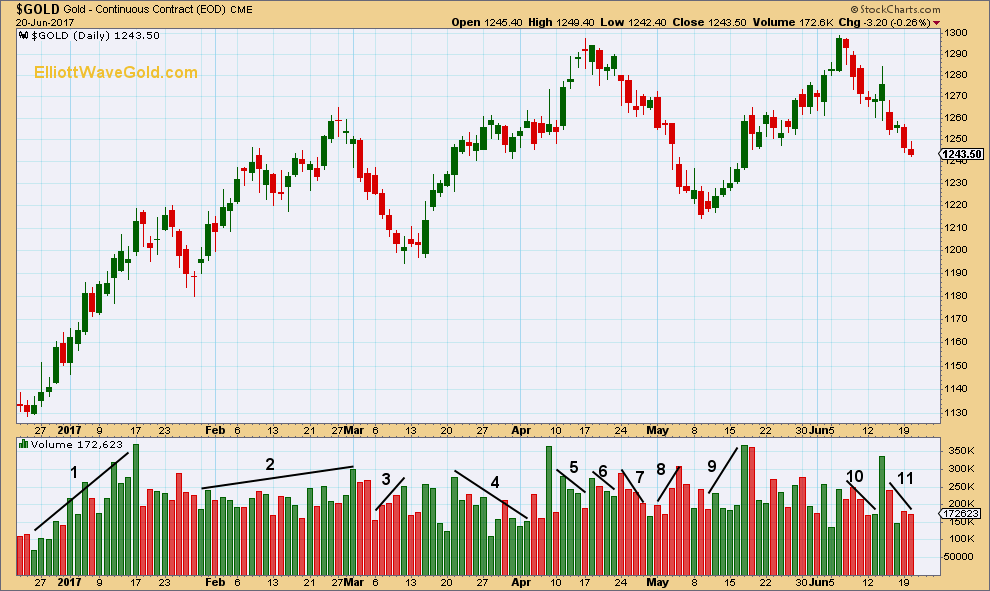
Click chart to enlarge.
1. This first rise in price is close to textbook perfect. The trend is well supported by volume. Volume does not increase in a straight line each day; some days are lighter than the prior day, but overall there is an increase.
2. This next rise is not so clear, but there is still overall an increase in volume as price rises. Volume is lighter than the prior stronger trend though, so the deep pullback that followed should not have been entirely unexpected.
3. As price falls initially volume declines and then shows some steady increase. The fall in price has support from increasing selling activity.
4 & 5. As price rises volume is not clearly rising. Sometimes the market can drift higher on light volume, so this type of rise is suspicious. The following deep decline again should not have been entirely unexpected.
6 & 7. As price falls volume declines. The market is falling of its own weight.
8. At the end of the fall volume begins to increase.
9. The start of the next rise has some support from volume by day 5. This shows an increase. However, the fifth day volume spike may also be a blow off top signalling an end to the rise temporarily. Blow off tops are not usually the very end; they usually signal a period of consolidation before the trend has a final rise.
The area between 9 and 10 is very unclear, with choppy overlapping price action generally trending higher and mostly flat volume.
10 & 11. As price falls volume declines. The market is mostly falling of its own weight.
When volume clearly supports a trend, then more confidence may be had in it. When volume does not support a trend, it is suspicious. Lack of support from volume will not tell when price will change direction, but it can warn that price may likely change direction and not just consolidate.
This analysis is published @ 03:51 a.m. EST.
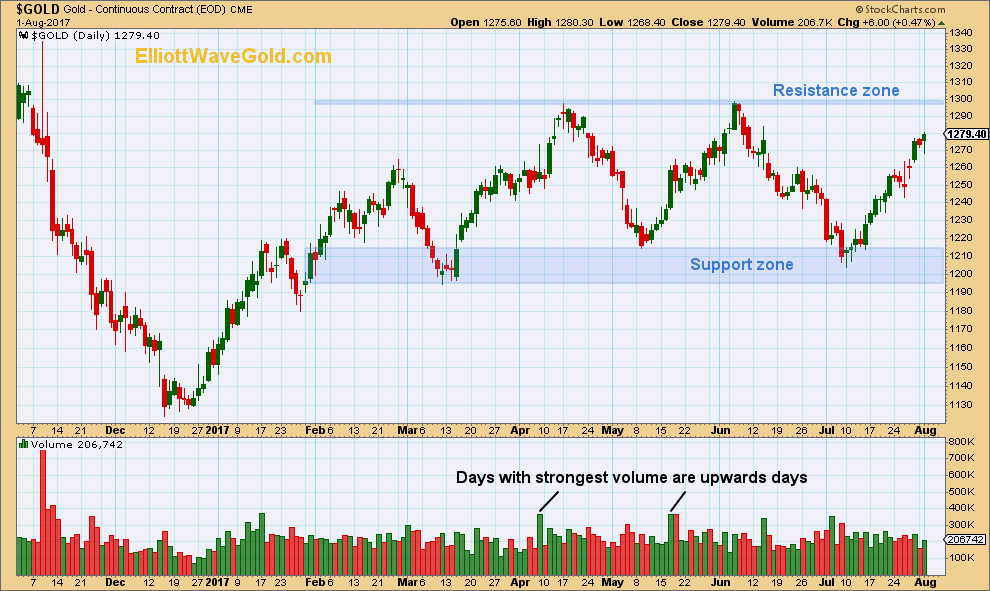
Click chart to enlarge.
Gold has been within a large consolidation since about January 2017. A small resistance zone is about 1,295 to 1,300. A wide support zone is about 1,195 to 1,215. During this period of time, it is two upwards days that have strongest volume and this suggests that an upwards breakout may be more likely than a downwards breakout.
This technique does not always work, but it works more often than it fails. This technique is an exercise in probability and not certainty.
Published @ 04:00 a.m. EST.