On Balance Volume
Daily data is accumulated. If price closes higher, then volume for that day is added to the prior total. If price closes lower, volume for the day is subtracted from the prior total. If there is no change in the closing value of price, then OBV does not change.
OBV is used in three basic ways:
1. Confirmation of a trend. If over several time periods OBV moves in the same direction as price, then this confirms a trend. If over several time periods OBV does not move in the same direction as price, then the trend is weak and expect a reversal.
2. Divergence. Between highs and lows, if price makes a new extreme and OBV does not, then it indicates weakness in the direction of price, so expect a reversal.
3. Trend lines. It is my experience that this is the best use of OBV. When price is consolidating OBV will find support and resistance at trend lines. OBV is a leading indicator. If it breaks support or resistance, then the direction of the break from OBV is often a warning that price will break out of a consolidation zone in the same direction.
The example from Gold below illustrates all three ideas.
Click chart to enlarge.
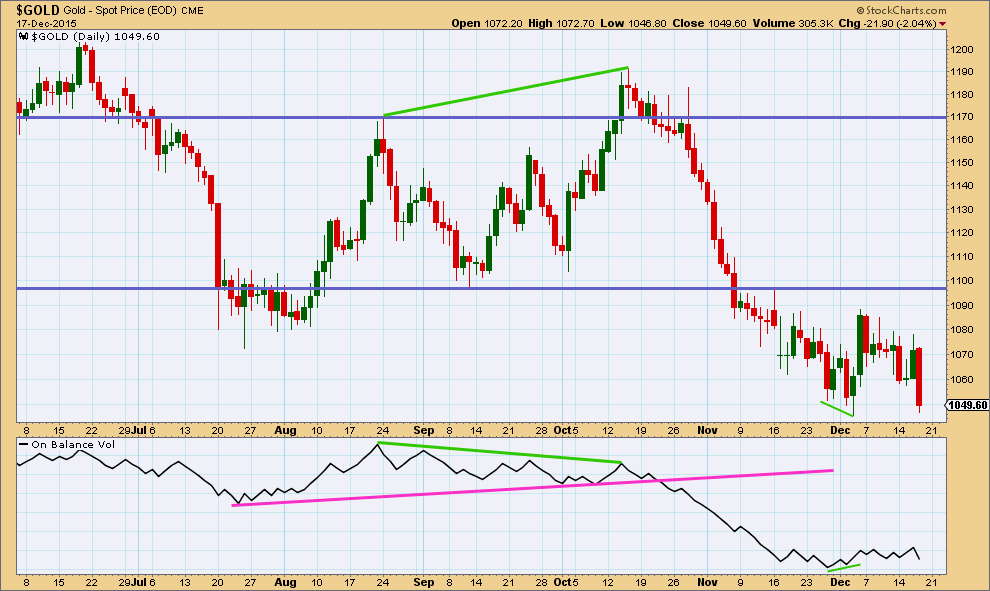
From July to October 2015, Gold consolidated in a wide price range delineated by the blue horizontal lines of resistance and support. What direction would the breakout be?
The first indication was divergence between the price highs of 24th August and 15th October. While price made a new high OBV did not. This indicated weakness in upwards price movement. Divergence is indicated on price and OBV by green lines.
The final indication came when OBV broke below its pink trend line in 23rd October. Note that this break came prior to the strong downwards movement from price. OBV indicated that price was likely to break out downwards from the consolidation zone and that is what it did.
As price fell strongly from 28th October to about 18th November, OBV also moved strongly lower confirming the price trend. At the end of the trend, OBV again diverged from price. The final low in price at 3rd December did not see a corresponding low from OBV, so this divergence indicated the downwards trend was weak and another consolidation should be expected.