ETHUSD: Elliott Wave and Technical Analysis – Video and Charts – September 23, 2021
Summary: Both the main and alternate Elliott wave counts expect the low of June 22, 2021, to not be breached.
The main Elliott wave count expects a huge triangle to continue sideways for a few months before the next bull run begins.
The alternate Elliott wave count expects the next very strong bull run has begun.
The data used for this analysis comes from Yahoo Finance BTC-USD.
Monthly and Weekly charts are on a semi-log scale. The close up daily chart is on an arithmetic scale.
MAIN ELLIOTT WAVE COUNT
MONTHLY
Click chart to enlarge.
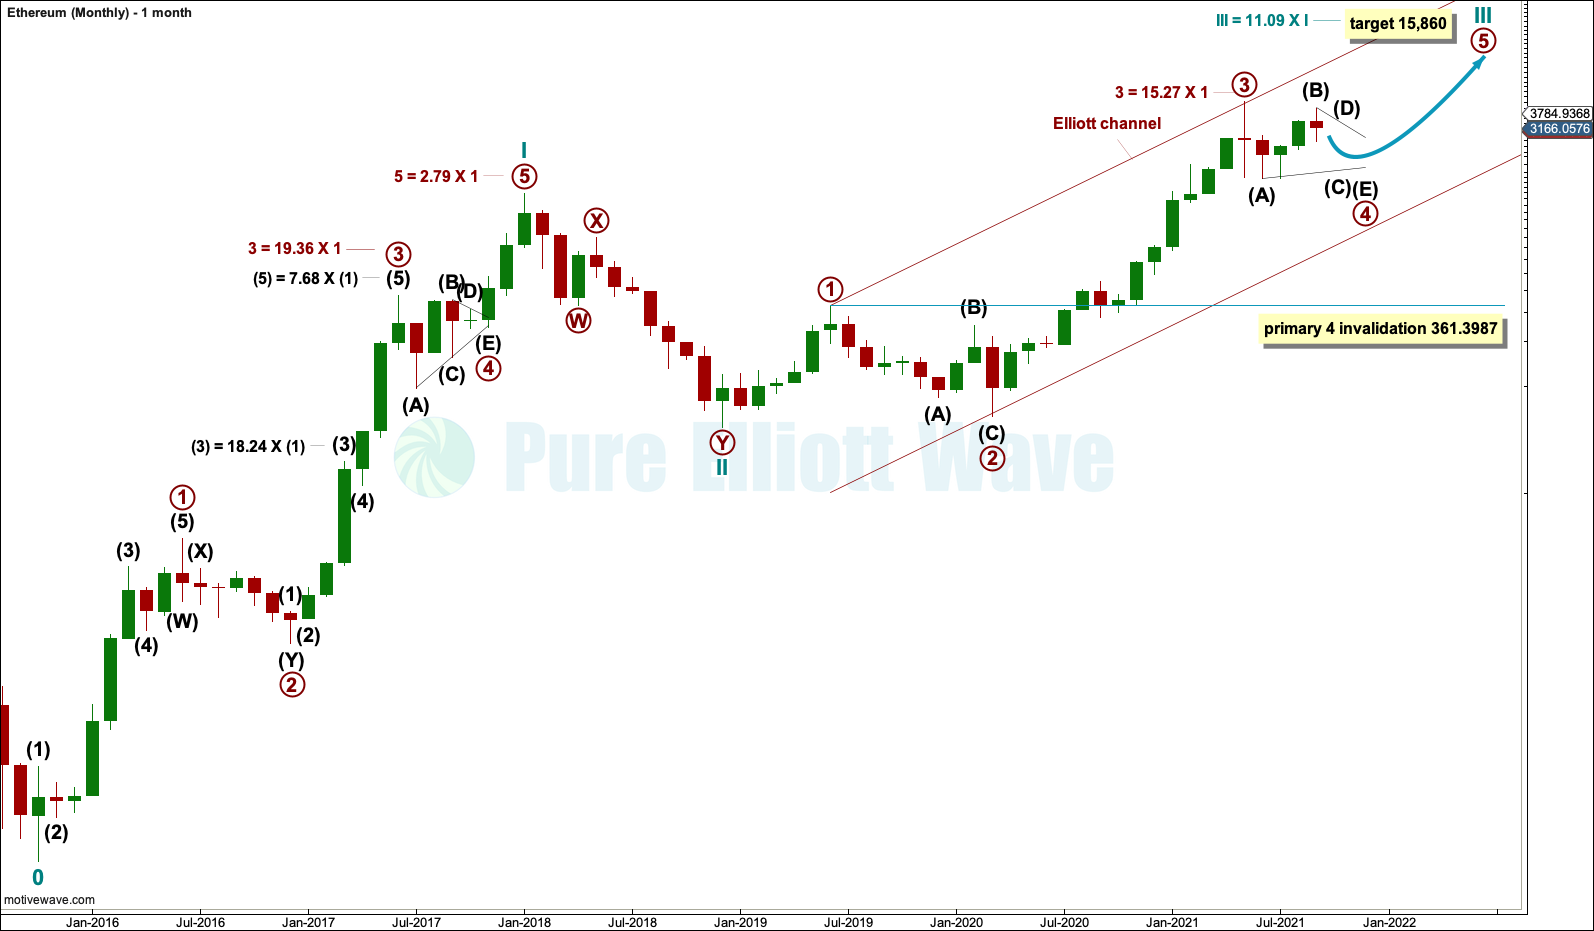
The monthly chart looks at the entire price history of Ethereum. The Elliott wave count begins at the low of October 2015.
From October 2015 to December 2017 this upwards wave subdivides perfectly as an Elliott wave impulse, labelled cycle wave I. The impulse lasted just over two years, which is within the expected duration for a cycle degree wave, so confidence that this labelling is correct may be had.
Within cycle wave I, note that wave lengths noted on the chart are not Fibonacci ratios but guides to expected behaviour for Ethereum. Prior Ethereum price history exhibits very long third waves and fifth waves which are longer than third waves.
Within cycle wave III, if primary wave 3 was over at the last high, then it exhibits a normal length to primary wave 1. It is for this reason mainly that the main wave count below labels primary wave 3 complete.
Primary wave 4 may not move into primary wave 1 price territory below 361.3987.
Cycle wave III may only subdivide as an impulse. It must move far enough above the end of cycle wave I to allow room for cycle wave IV to unfold and remain above cycle wave I price territory.
WEEKLY
Click chart to enlarge.
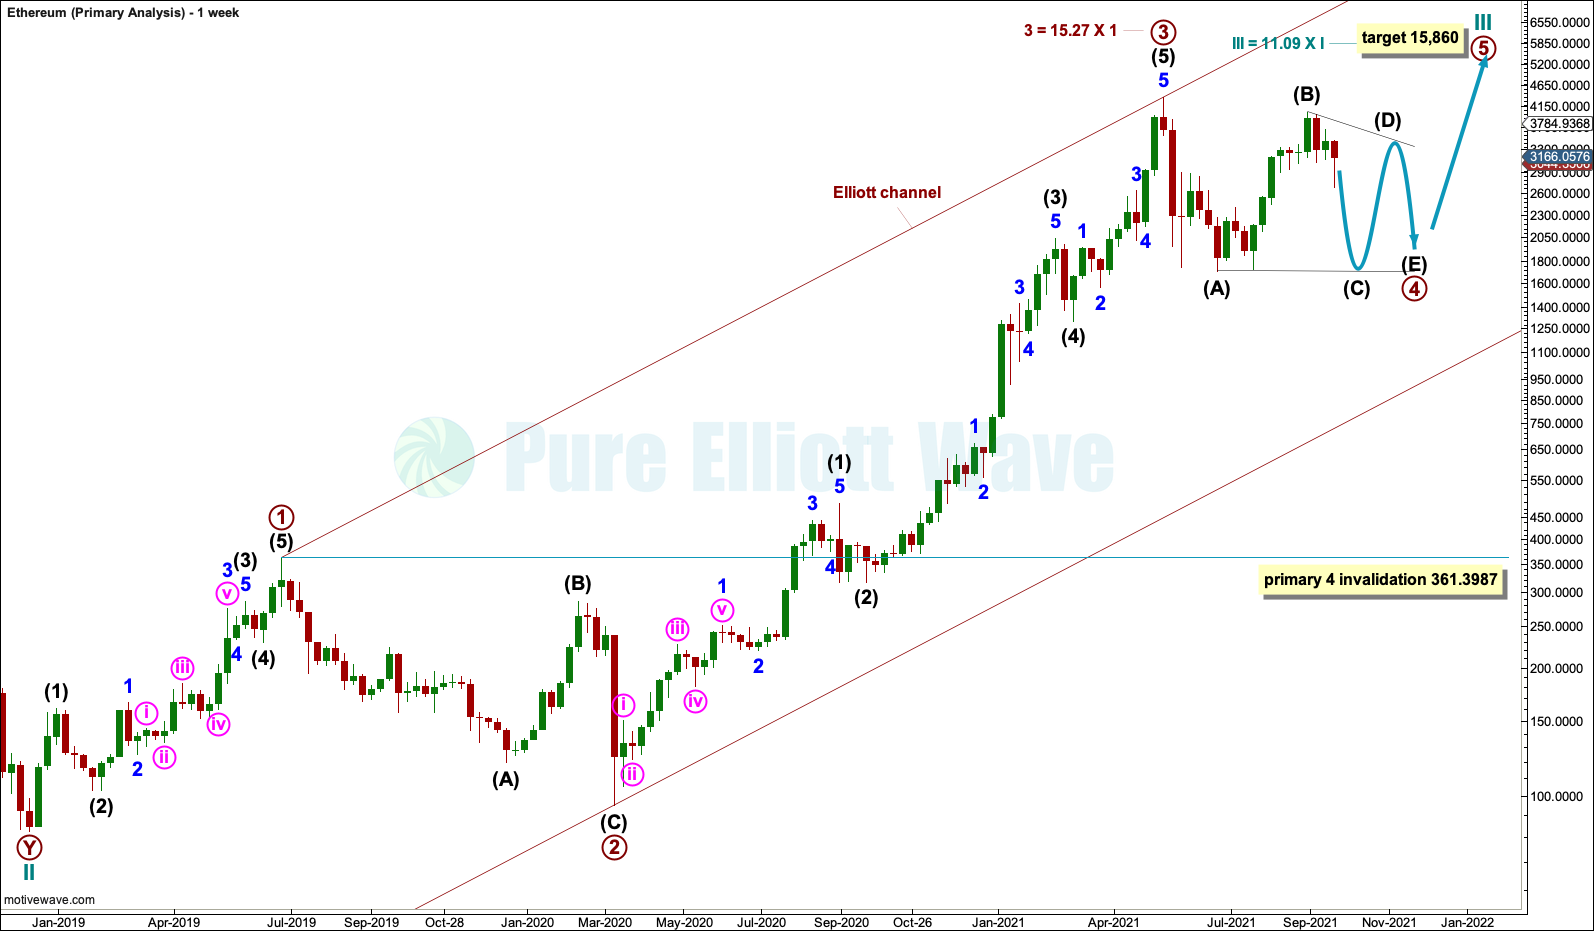
Within the impulse of cycle wave III: Primary waves 1, 2 and 3 may be complete and primary wave 4 may continue sideways as a large triangle for a few more months.
Primary wave 2 was a deep 0.95 zigzag, lasting 37 weeks. If primary wave 4 subdivides as a shallow triangle, then it would exhibit alternation. So far primary wave 4 has lasted 19 weeks; it may be longer lasting than primary wave 2 as triangles are usually longer lasting than zigzags. At this time, primary wave 4 may be less than half way through.
DAILY
Click chart to enlarge.
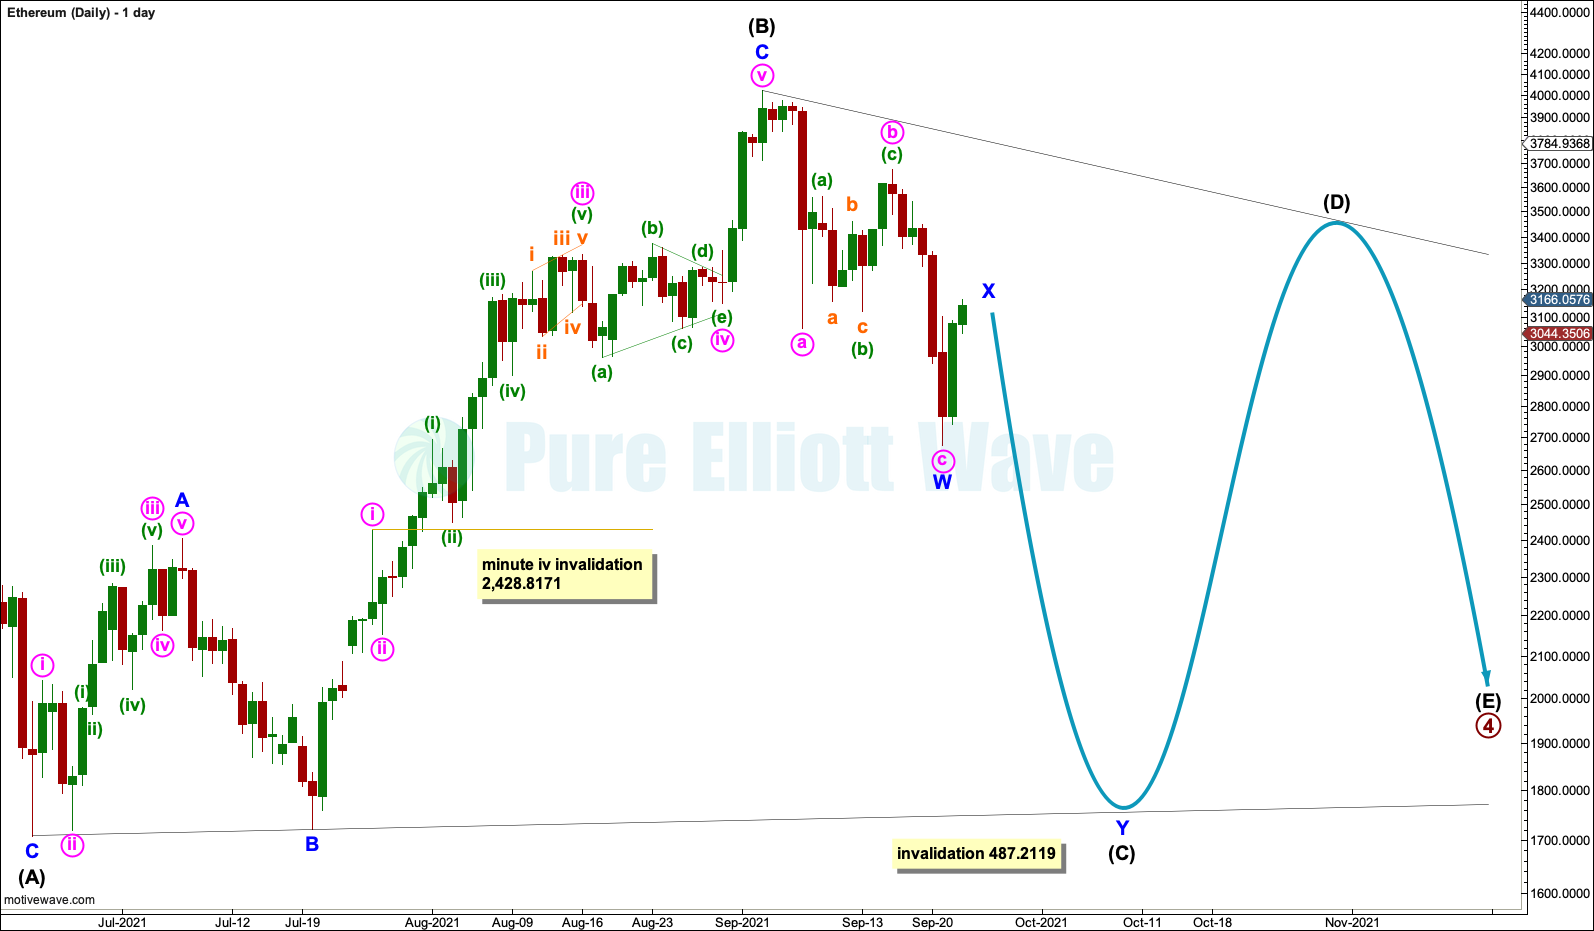
Intermediate waves (A) and (B) within the large triangle for primary wave 4 may be complete, both subdividing as single zigzags.
Four of the five sub-waves within a triangle must subdivide as single or multiple zigzags, with only one sub-wave subdividing as a multiple. The most common sub-wave to subdivide as a multiple zigzag is wave C, so this is what will be expected as most likely for minor wave C.
Elliott wave triangles normally adhere strictly to their trend lines, which are often tested within triangle sub-waves. The lower A-C trend line sits across the low of minor wave B within intermediate wave (B) and this trend line may show where intermediate wave (C) may end.
WEEKLY ALTERNATE
Click chart to enlarge.
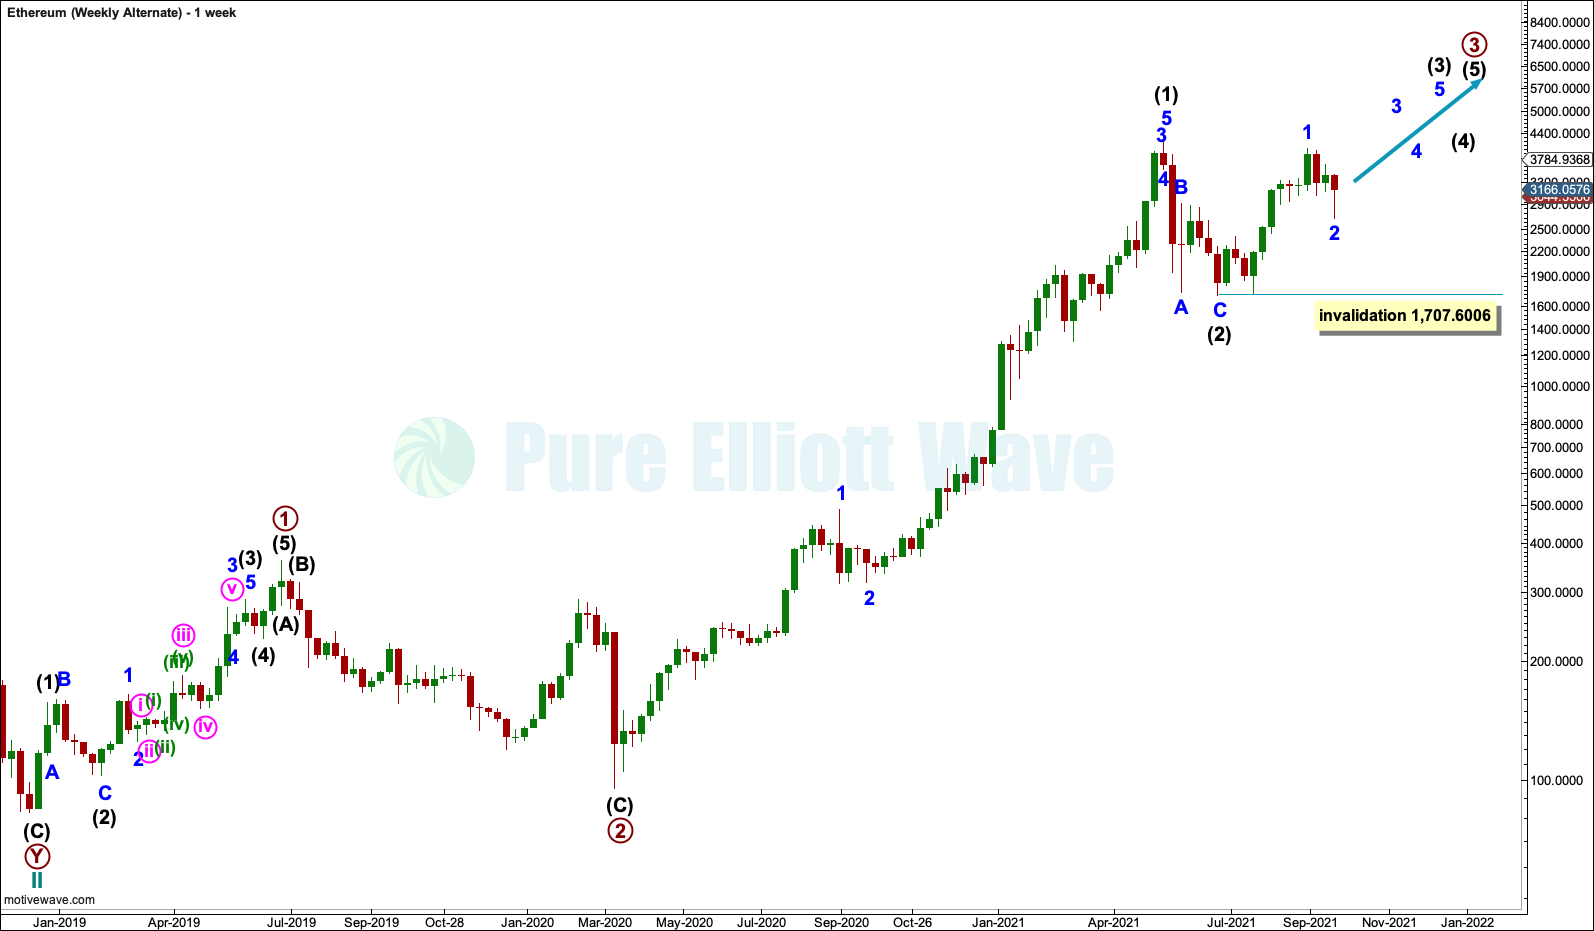
This wave count is judged to have a close to even probability with the main Elliott wave count. It is an alternate only because the length of primary wave 3 for the main wave count is within a normal expectation based upon the price history of Ethereum.
It is possible that primary wave 3 is not over. The last high may have been only intermediate wave (1) within primary wave 3. Primary wave 3 may be unfolding as a very long extension.
Primary wave 3 may only subdivide as an impulse. Within primary wave 3: Intermediate waves (1) and (2) may be complete and intermediate wave (3) may only subdivide as an impulse. Within intermediate wave (3): Minor wave 1 may be complete and minor wave 2 may not move beyond the start of minor wave 1 below 1,707.6006.
DAILY ALTERNATE
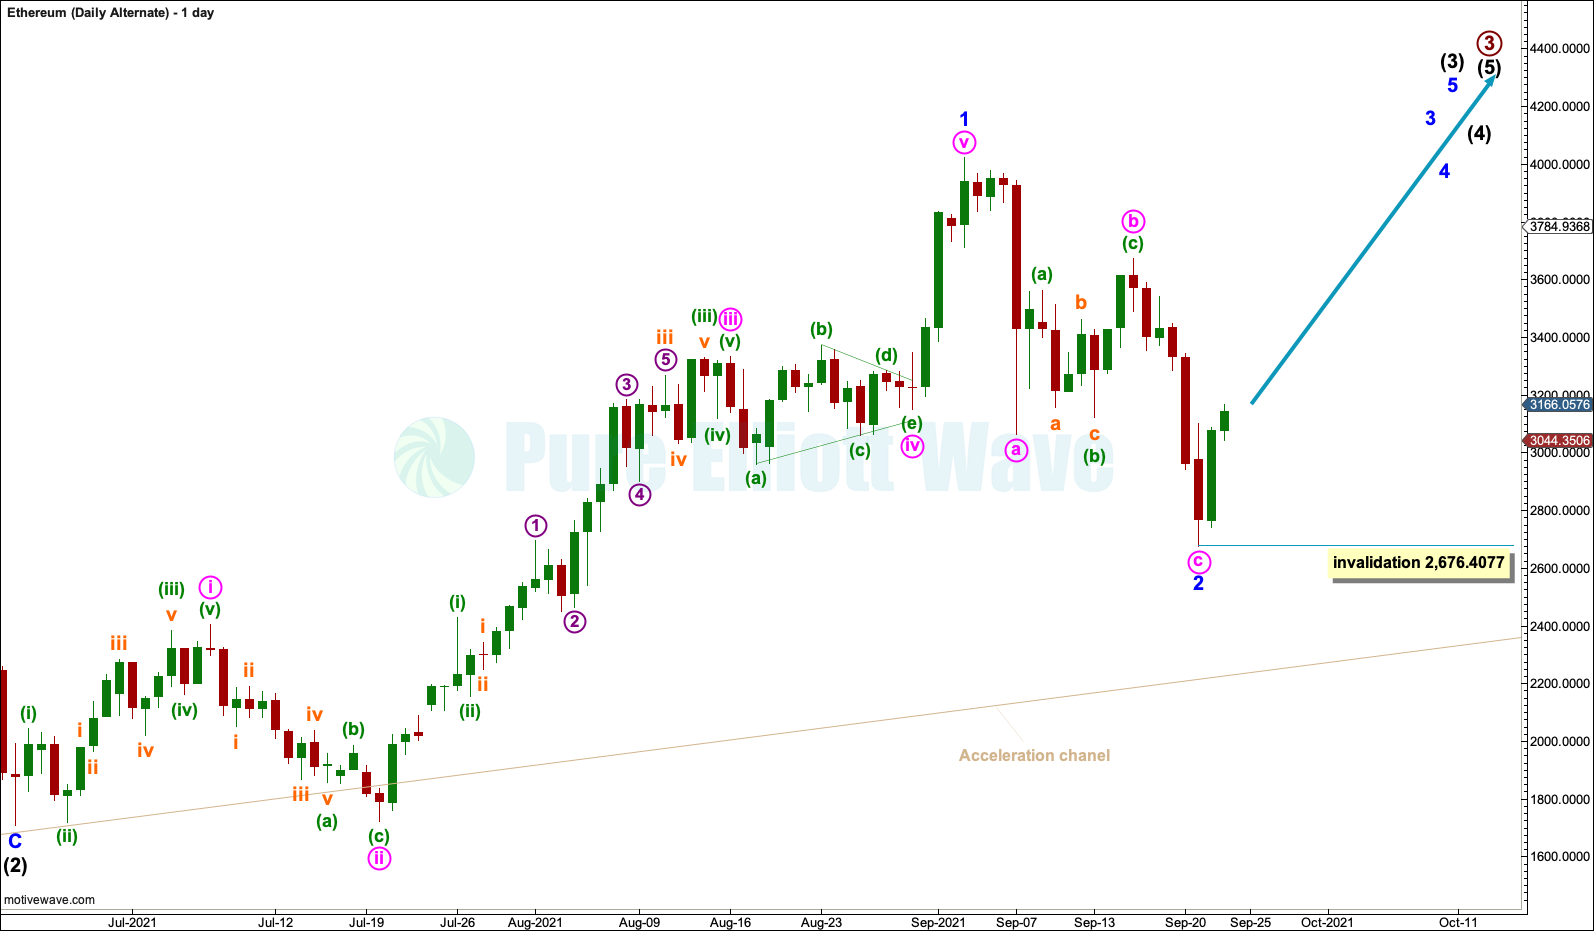
Click chart to enlarge.
Minor wave 1 within intermediate wave (3) subdivides very well as an impulse.
Minor wave 2 may now be a complete zigzag. Within minor wave 2, minute wave c is 36.6565 longer than equality in length to minute wave a. This difference is only 3.7% the length of minute wave c. I consider a variation less than 10% to be small enough to judge the wave lengths to exhibit a Fibonacci ratio.
This alternate is a very bullish wave count. It expects now that minor wave 3 within intermediate wave (3) within primary wave 3 within cycle wave III has just begun.
Within minor wave 3, no second wave correction may move beyond its start below 2,676.4077.
TECHNICAL ANALYSIS
WEEKLY
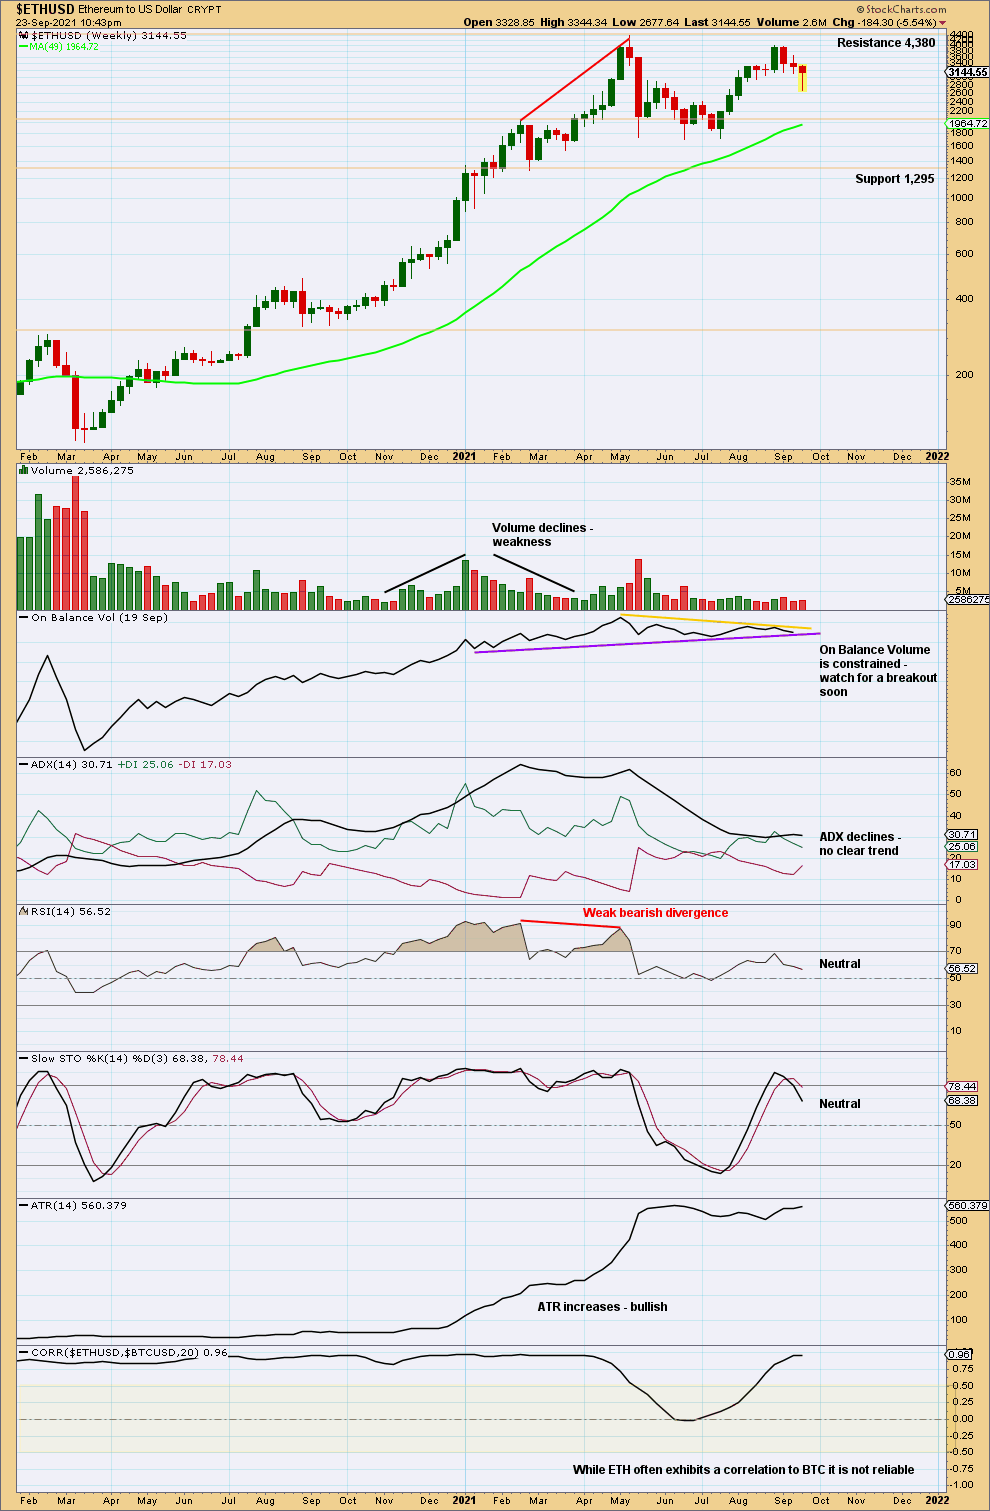
Click chart to enlarge.
Like almost every other cryptocurrency I have analysed, Ethereum can sustain a strong bullish trend for a reasonable time while price travels a considerable distance. RSI can reach deeply overbought and ADX can reach above 50 exhibiting a very extreme trend.
At the last major high, RSI reached deeply overbought and then exhibited bearish divergence, and ADX reached very extreme. The pullback may have relieved these extreme conditions and set up the next bull run.
Watch closely in coming weeks for a signal from On Balance Volume as it breaks out if its narrow range.
The correlation co-efficient is provided at the bottom of this chart in anticipation of readers pointing out that the main wave count for Ethereum differs from the main wave count for Bitcoin. These two markets do not always exhibit a strong positive correlation, despite assumptions that they should. It must be accepted that the current positive correlation could break down at any time, so from an Elliott wave perspective they must be approached separately.
DAILY
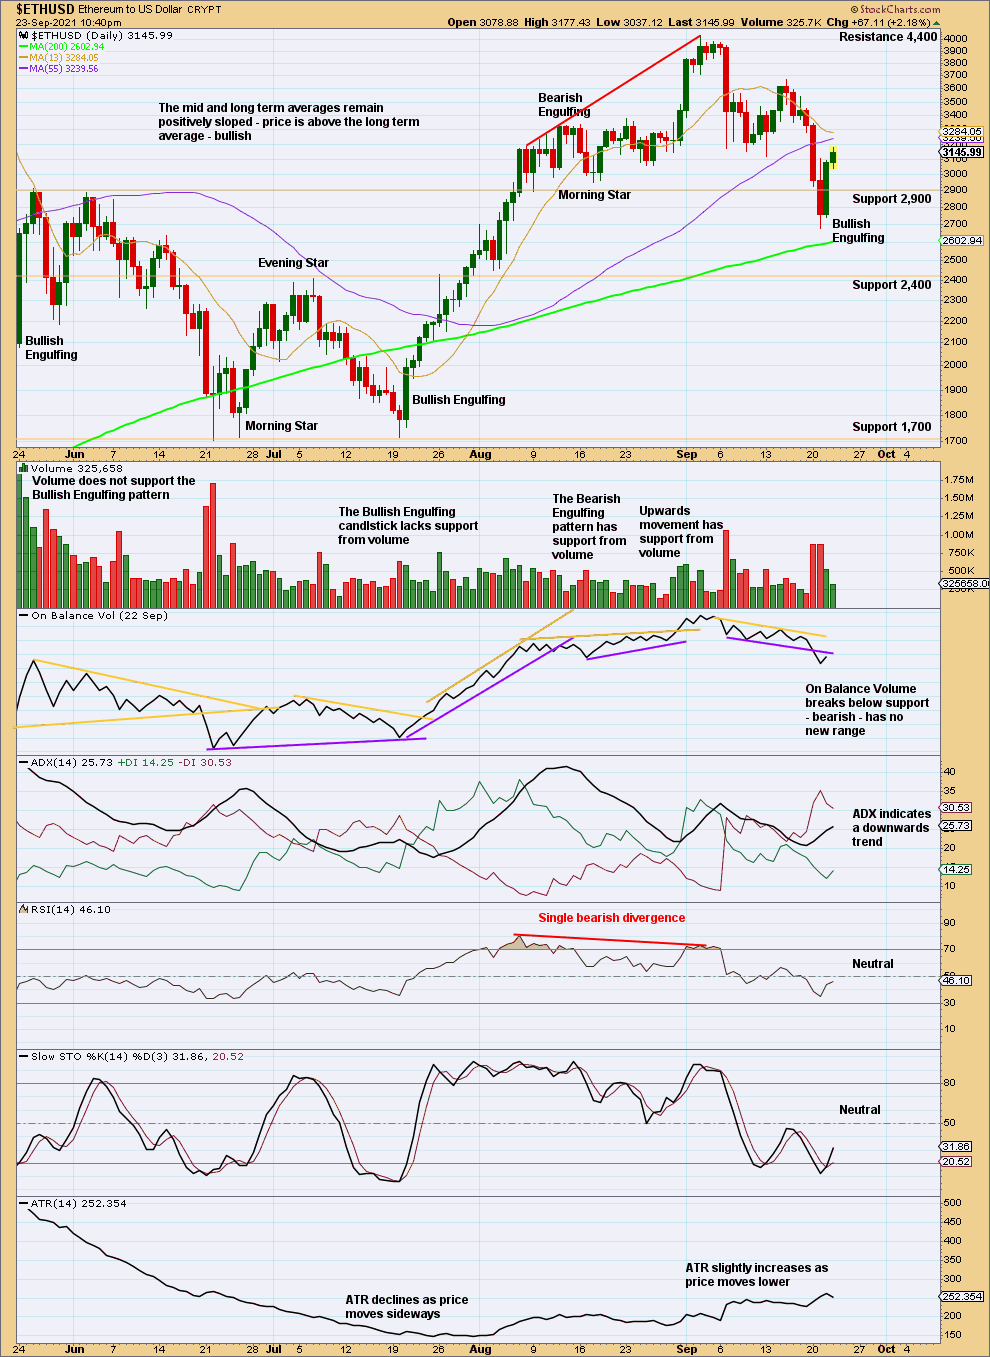
Click chart to enlarge.
Another Bullish Engulfing pattern lacks support from volume, but this has been seen before at sustainable lows for Ethereum. The pullback may have resolved extreme conditions at the last major high.
Published @ 11:22 p.m. ET.
—
Careful risk management protects your investments.
Follow my two Golden Rules:
1. Invest only funds you can afford to lose.
2. Have an exit plan for both directions – where or when to take profit, and when to exit a losing investment.
—
New updates to this analysis are in bold.