SHIBA: Elliott Wave and Technical Analysis – Video and Charts – October 28, 2021
Summary: A five wave impulse upwards may be either complete or nearly complete. A deep correction may be expected to follow that may last about two to three months.
The data used for this analysis comes from Yahoo Finance XRP-USD.
Weekly charts are on a semi-log scale. The close up daily chart is on an arithmetic scale.
ELLIOTT WAVE COUNT
DAILY
Click chart to enlarge.
This market is new, so there may not be sufficient volume for reasonable looking Elliott wave structures. However, a subscriber has requested that I analyse SHIBA, so I will.
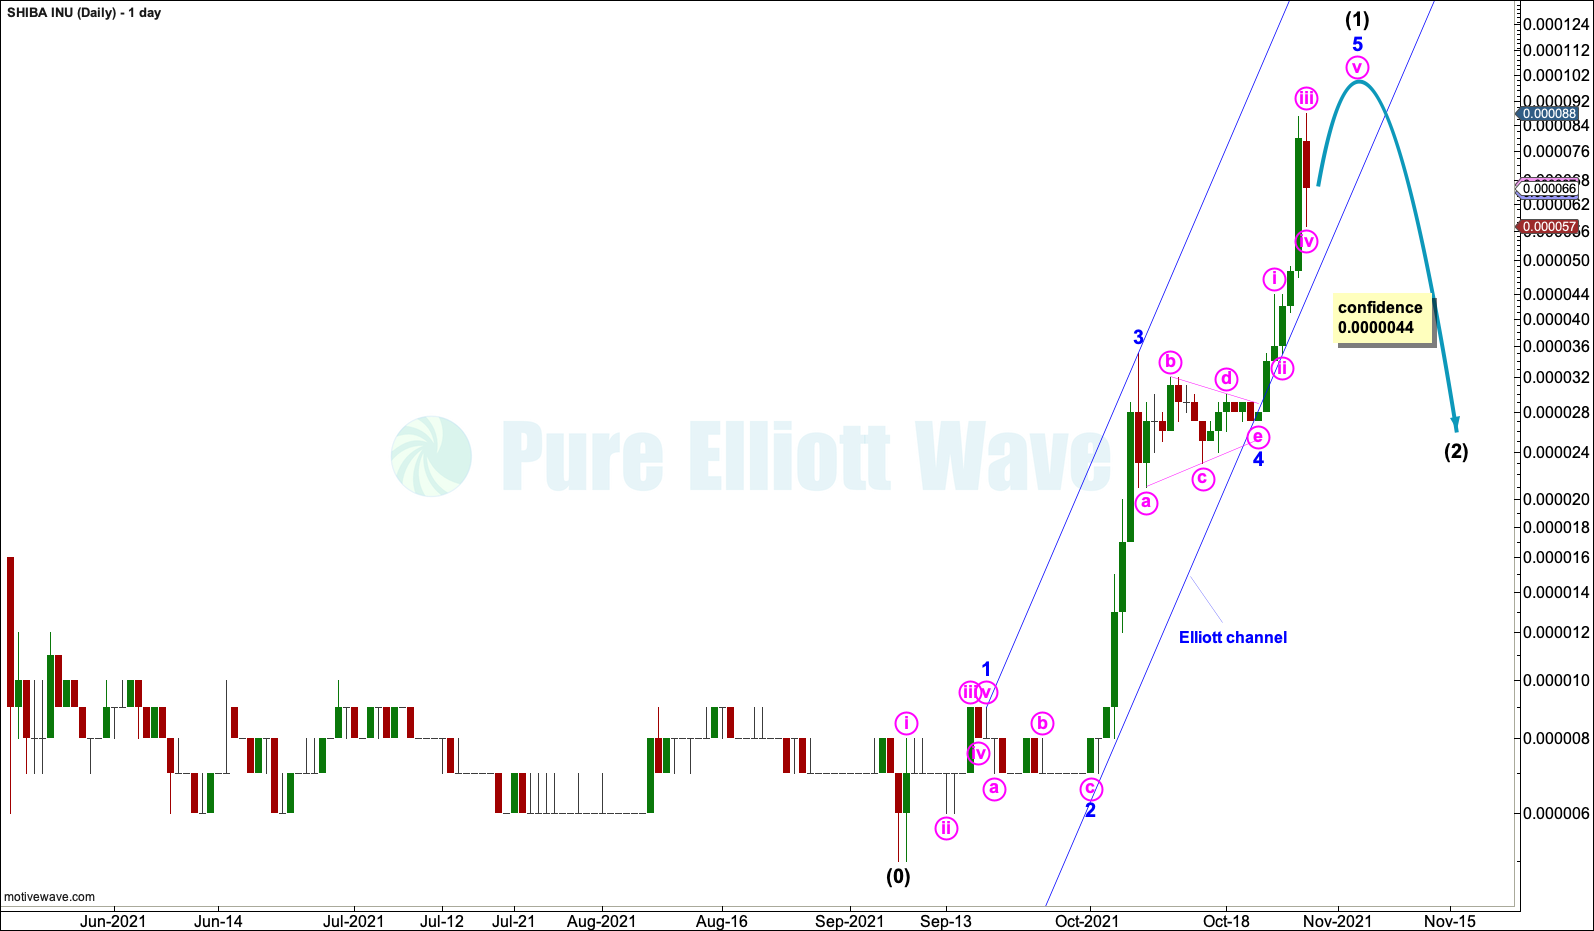
The Elliott wave count begins at the low of September 7, 2021.
A five wave impulse may be either complete or nearly so. This is labelled intermediate wave (1).
Minor wave 1 fits well as a five. Minor wave 2 fits reasonably well as either a zigzag or possibly a double zigzag.
Minor wave 3 is extended. Minor wave 4 fits perfectly as a regular contracting triangle.
The only question at this point is whether or not minor wave 5 may be complete; if minor wave 5 is complete, then intermediate wave (1) would also be complete. Some technical indication of a sustainable high in place would be required for confidence.
Within minor wave 5, minute waves i through to iv may be complete. Only a final wave up for minute wave v may be required to complete minor wave 5 and the impulse for intermediate wave (1).
Within minor wave 5, minute wave iv may not move into minute wave i price territory below 0.0000044. A new low below this point could not be a continuation of minute wave iv, so at that stage minor wave 5 and intermediate wave (1) should be over; this would add confidence to a trend change.
Draw an Elliott channel about intermediate wave (1) using Elliott’s first technique. Draw the first trend line from the ends of minor waves 1 to 3, then place a parallel copy on the end of minor wave 2. When this channel is breached by downwards movement, then it may be used to indicate a trend change.
TECHNICAL ANALYSIS
DAILY
Click chart to enlarge.
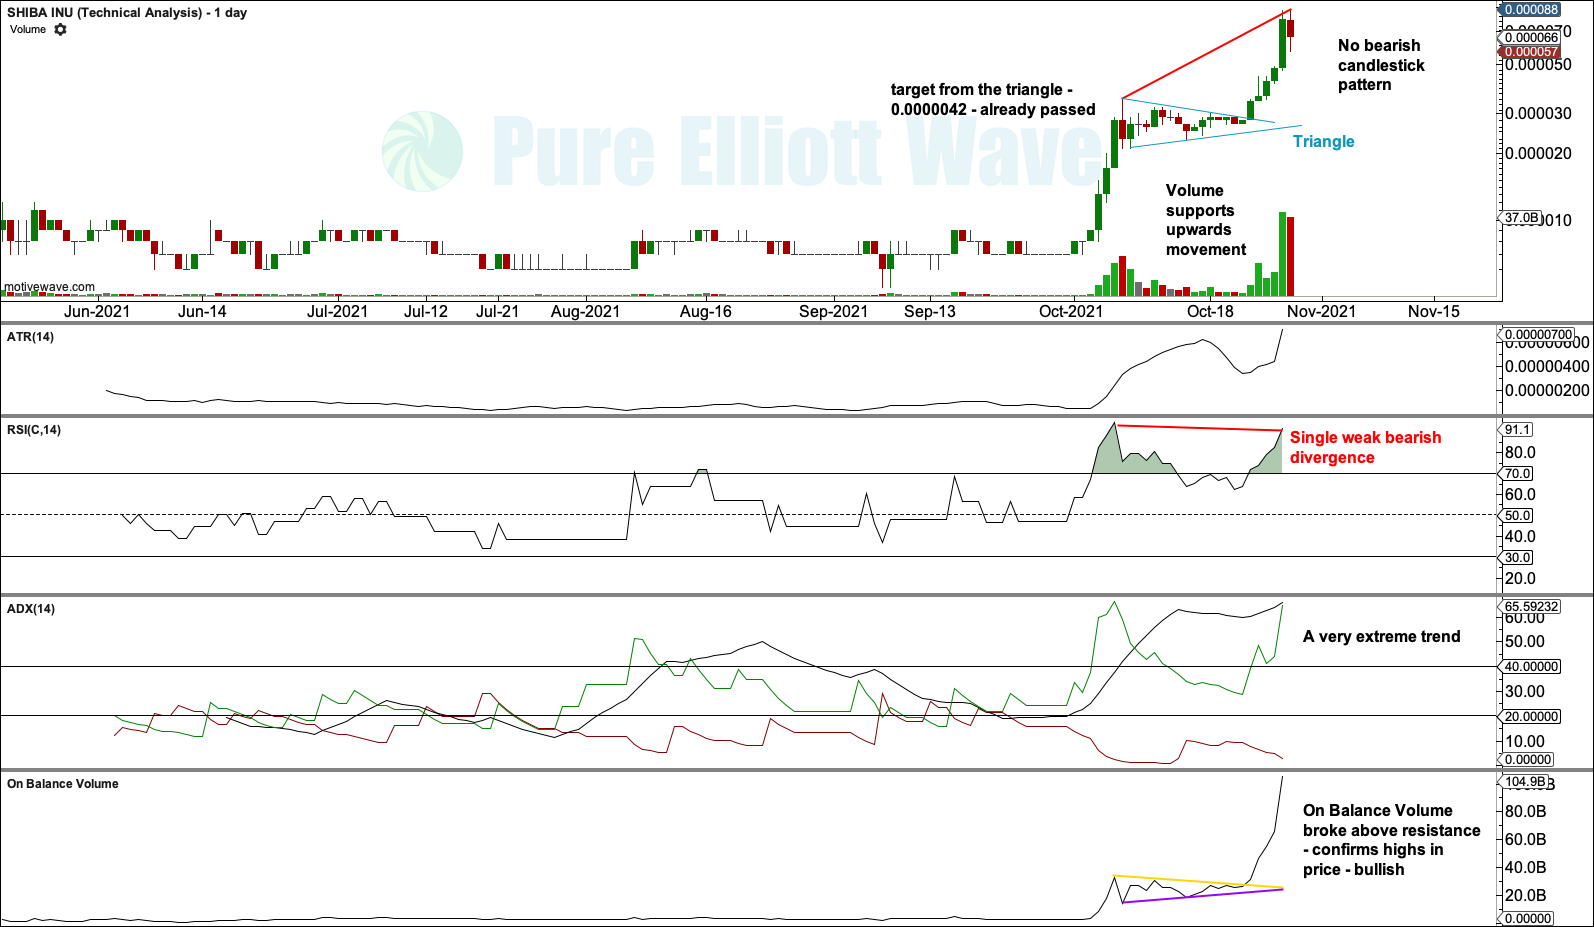
The triangle labelled here is a classic triangle pattern, which are different to Elliott wave triangles. The target calculated has passed.
The last red daily candlestick cannot be considered a Dark Cloud Cover bearish reversal pattern because it has failed by a small margin to close halfway within the real body of the prior green candlestick.
The upwards trend is very extreme, but there is not yet enough historical data for this cryptocurrency to know exactly how extreme its trends can get. However, in the world of cryptocurrencies, ADX reaching 70 is usually very extreme and trend changes are seen soon after.
Bearish divergence between price and RSI is not strong enough yet for a clear warning of a likely trend change.
Published @ 07:14 p.m. ET.
—
Careful risk management protects your investments.
Follow my two Golden Rules:
1. Invest only funds you can afford to lose.
2. Have an exit plan for both directions – where or when to take profit, and when to exit a losing investment.
—
New updates to this analysis are in bold.
 Save as PDF