BTCUSD: Elliott Wave and Technical Analysis – Review of Analysis since August 2021
WEEK BEGINNING AUGUST 23, 2021
DAILY CHART
Click chart to enlarge.
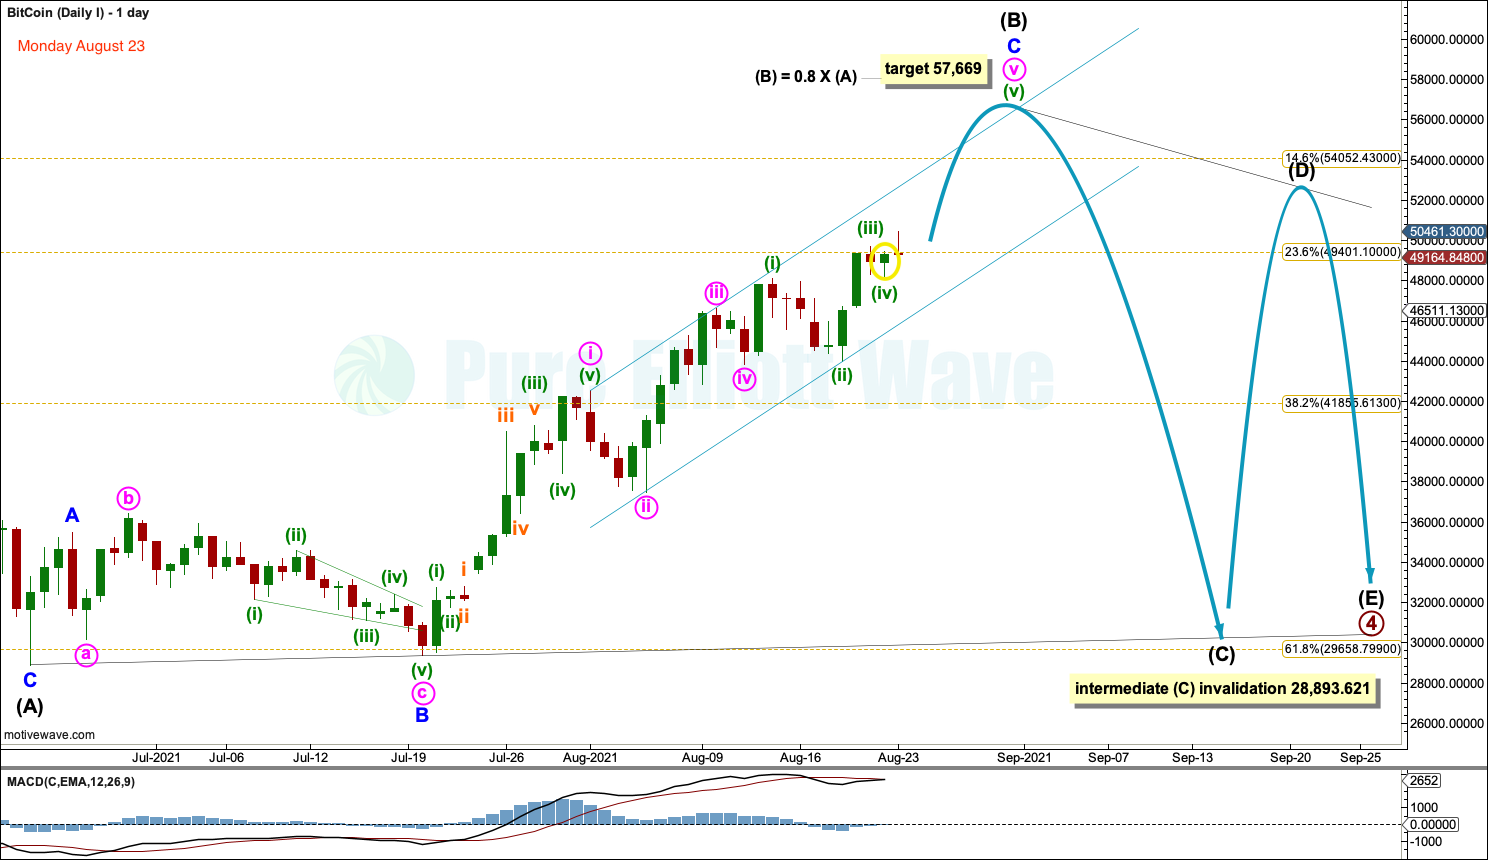
A little more upwards movement was expected to a target at 57,669 before a trend change and a deep pullback, but the pullback was not expected to move below 28,893.621, which was an area identified as providing strong support.
WEEK BEGINNING AUGUST 30, 2021
DAILY CHART
Click chart to enlarge.
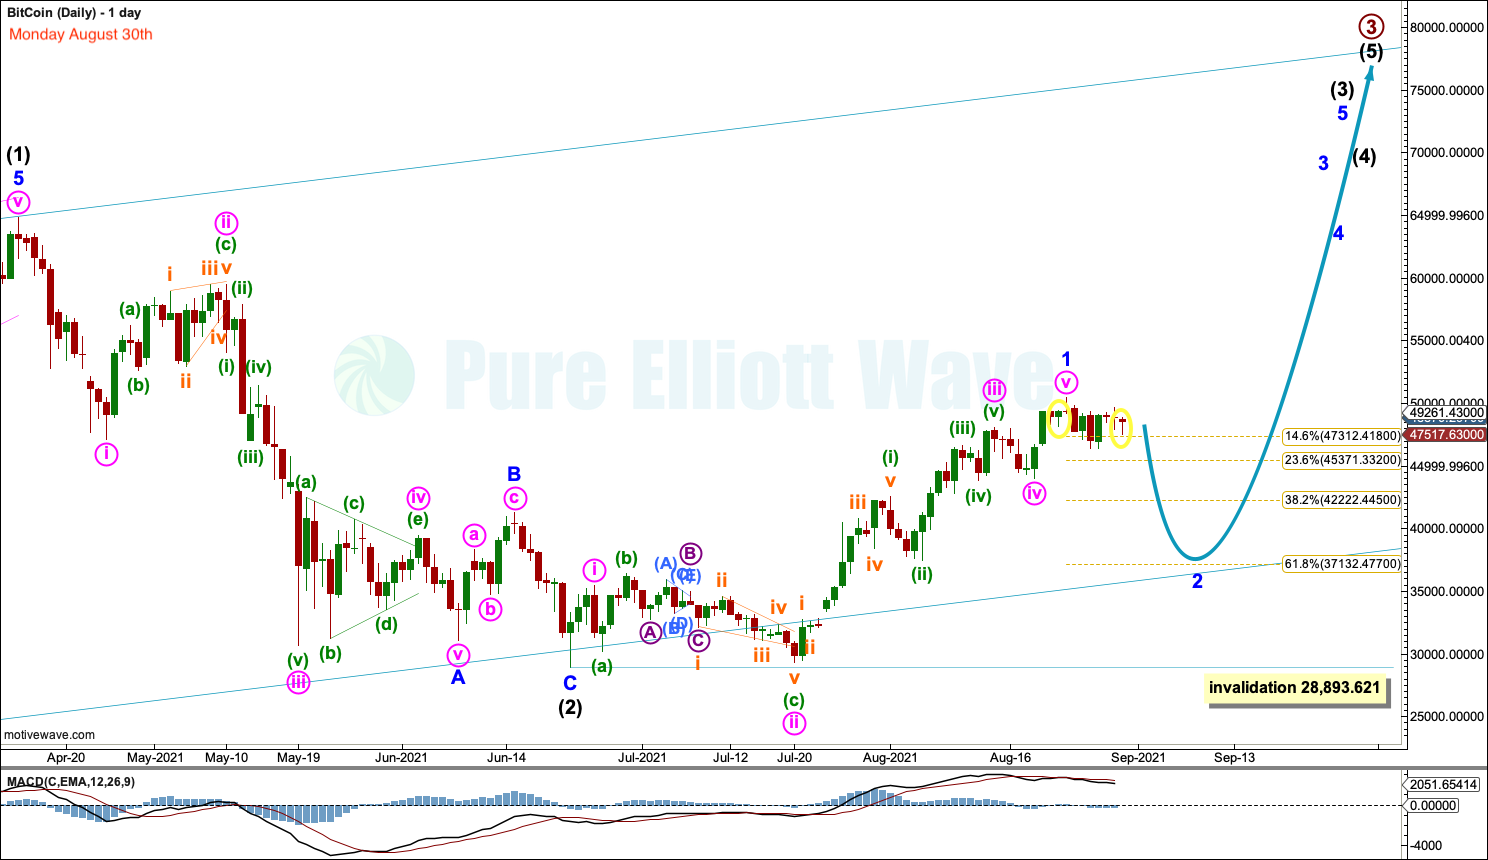
Price did move higher towards the target in the previous analysis, which was at 57,669. By this week the target had not been met.
On the 30th of August the main wave count expected a pullback to about 37,132. Over the next two weeks this was what happened, although price moved a little sideways and then higher first.
Apart from expecting a pullback, the analysis was very bullish and expected new all-time highs from Bitcoin in the near future.
WEEK BEGINNING SEPTEMBER 6, 2021
DAILY CHART
Click chart to enlarge.
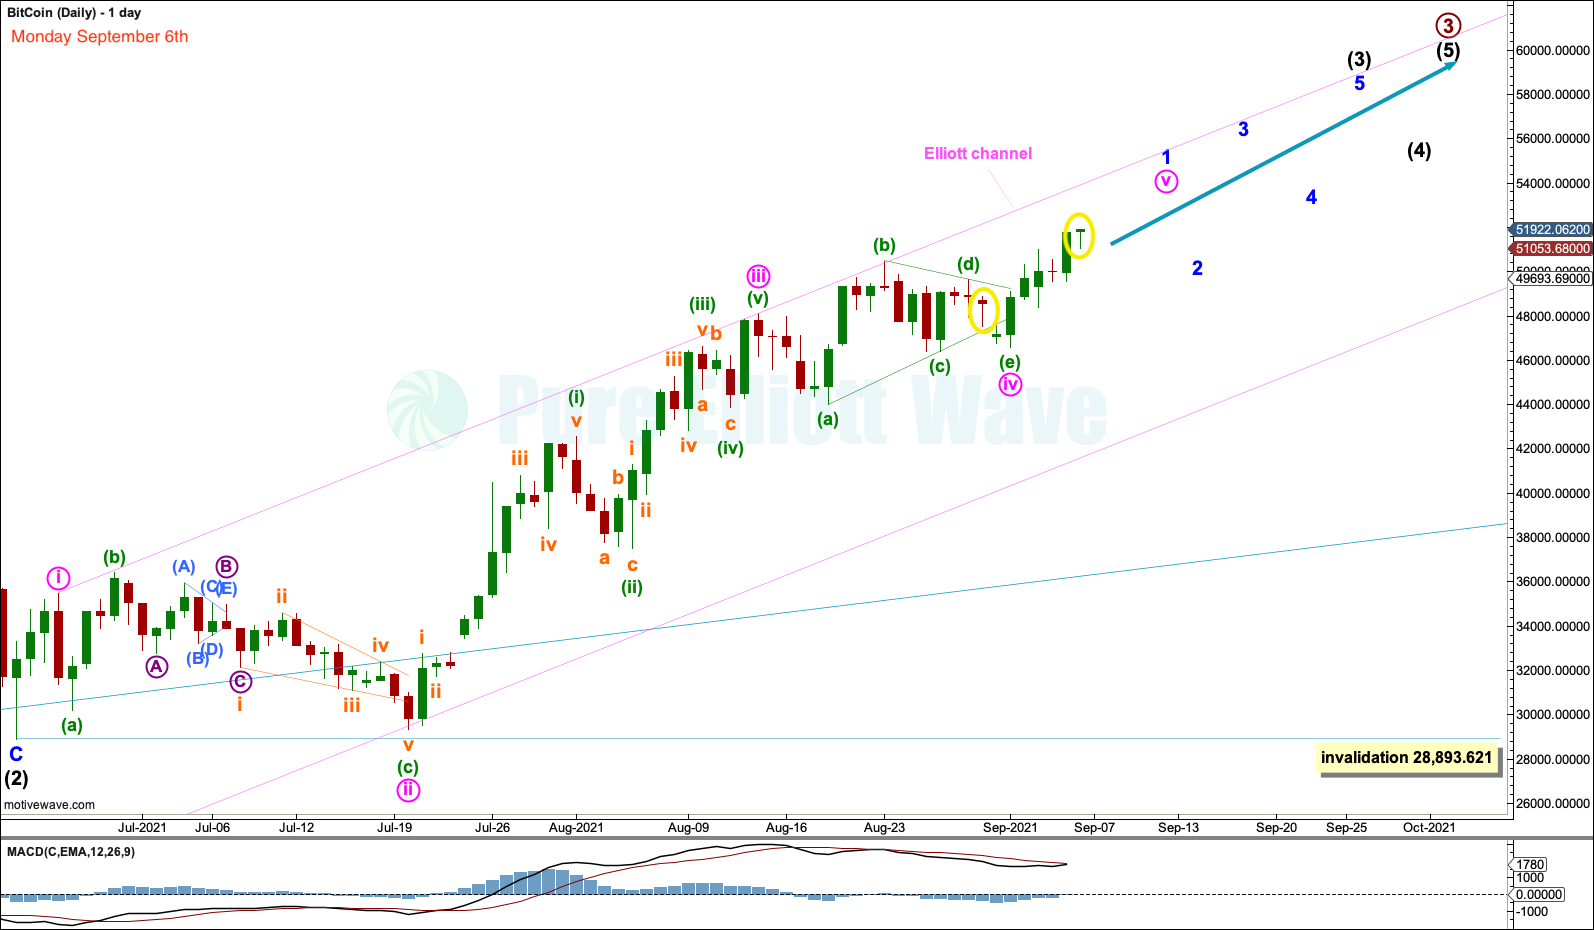
The first daily chart published this week expected an imminent trend change for a pullback to start (which would be labelled minor wave 2), but did not yet see technical evidence for that change.
Two days later on September 8th that technical evidence was found and the chart below was published in comments as an intra-week update for members:
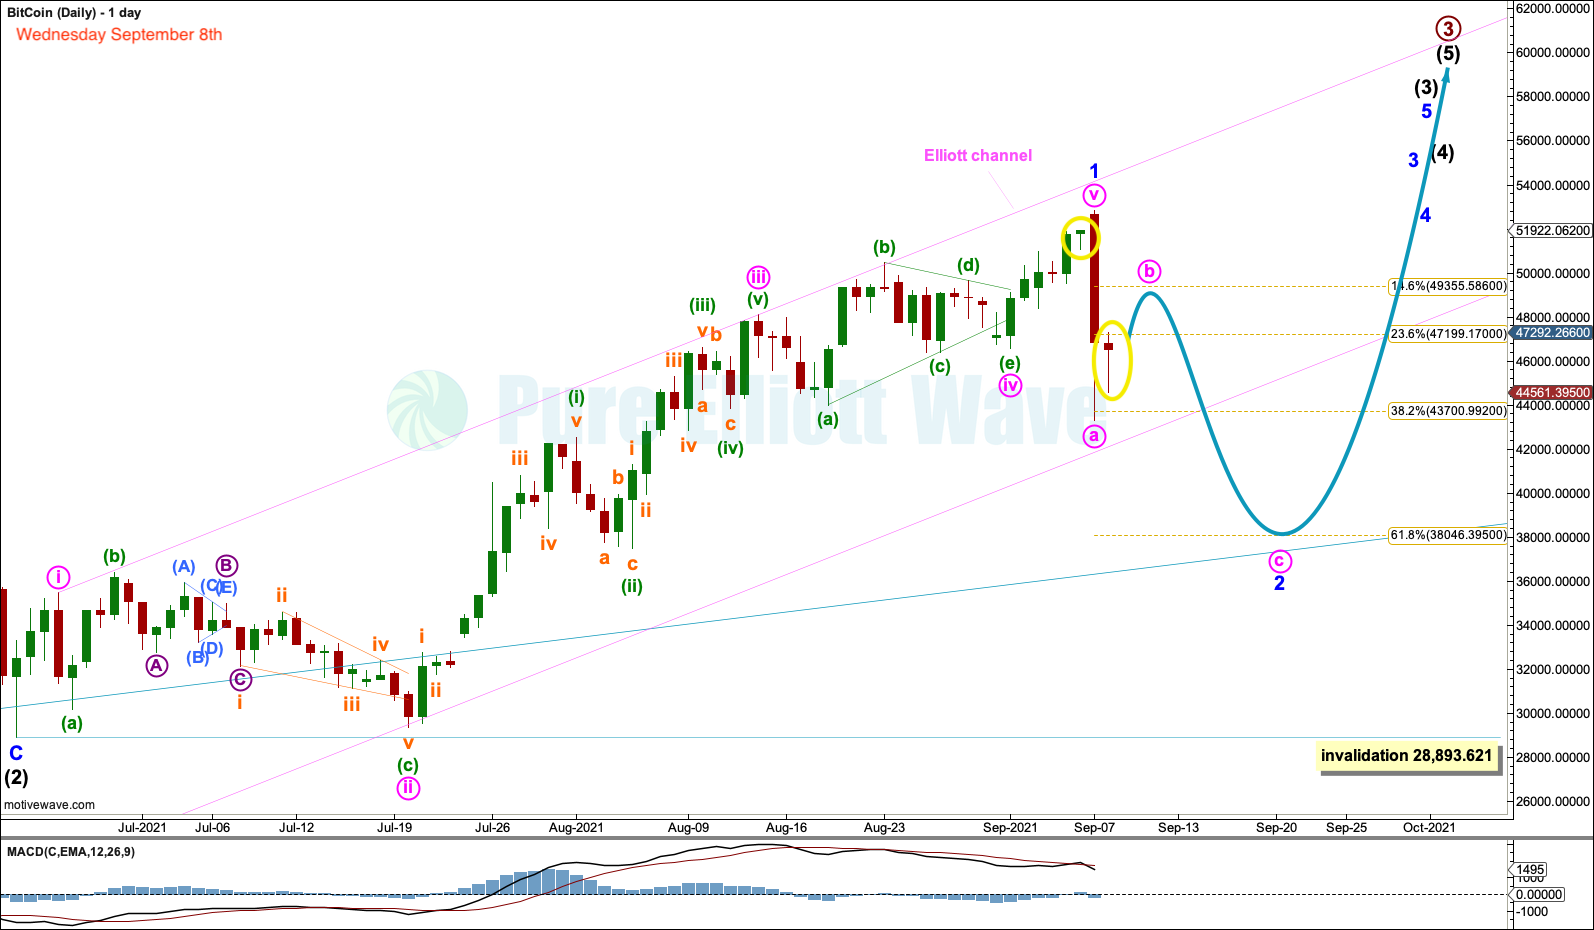
Click chart to enlarge.
The expected pullback arrived on September 7th.
WEEK BEGINNING SEPTEMBER 13, 2021
DAILY CHART
Click chart to enlarge.
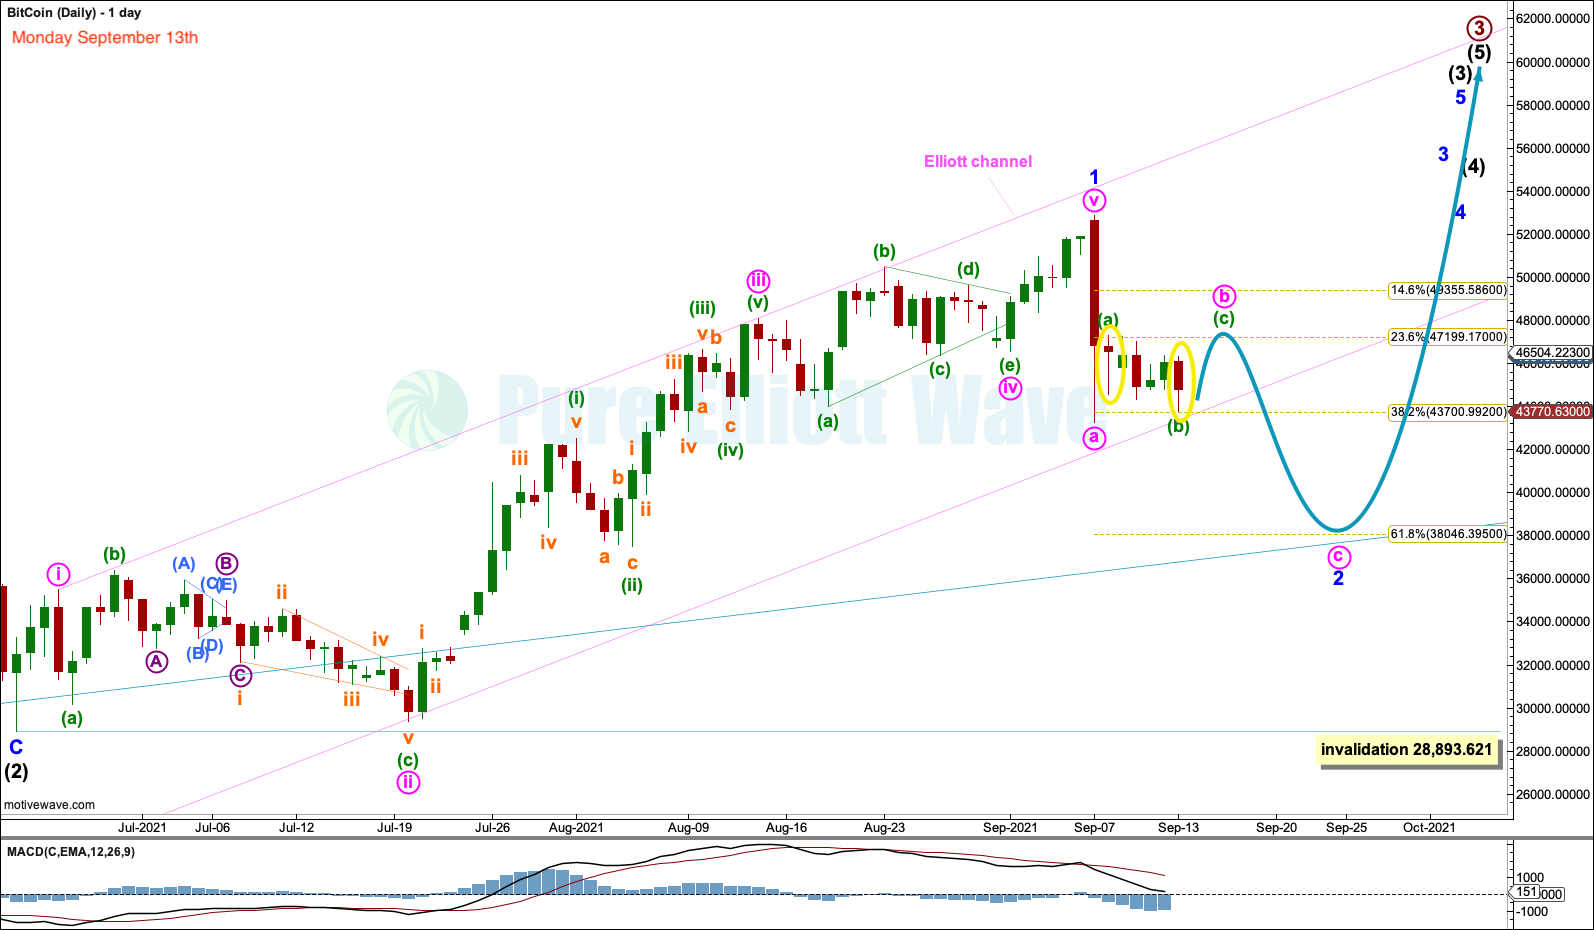
On September 13th a small bounce was expected to complete minute wave b, which was expected to move at least slightly above 47,292.266. Thereafter, the larger pullback was expected to continue towards a new target at 38,046.395.
The bounce occurred exactly as expected, reaching 48,791.78 on September 18th, before a reversal and a sharp move down.
WEEK BEGINNING SEPTEMBER 20, 2021
DAILY CHART

Click chart to enlarge.
The pullback was expected to continue. With more Elliott wave structure within the zigzag complete, the target was refined as a small zone from 39,223 to 38,046.
Price did continue lower exactly as expected finding a low on September 21 at 39,787, just $564 short of the upper edge of the target zone.
WEEK BEGINNING SEPTEMBER 27, 2021
DAILY CHART
Click chart to enlarge.
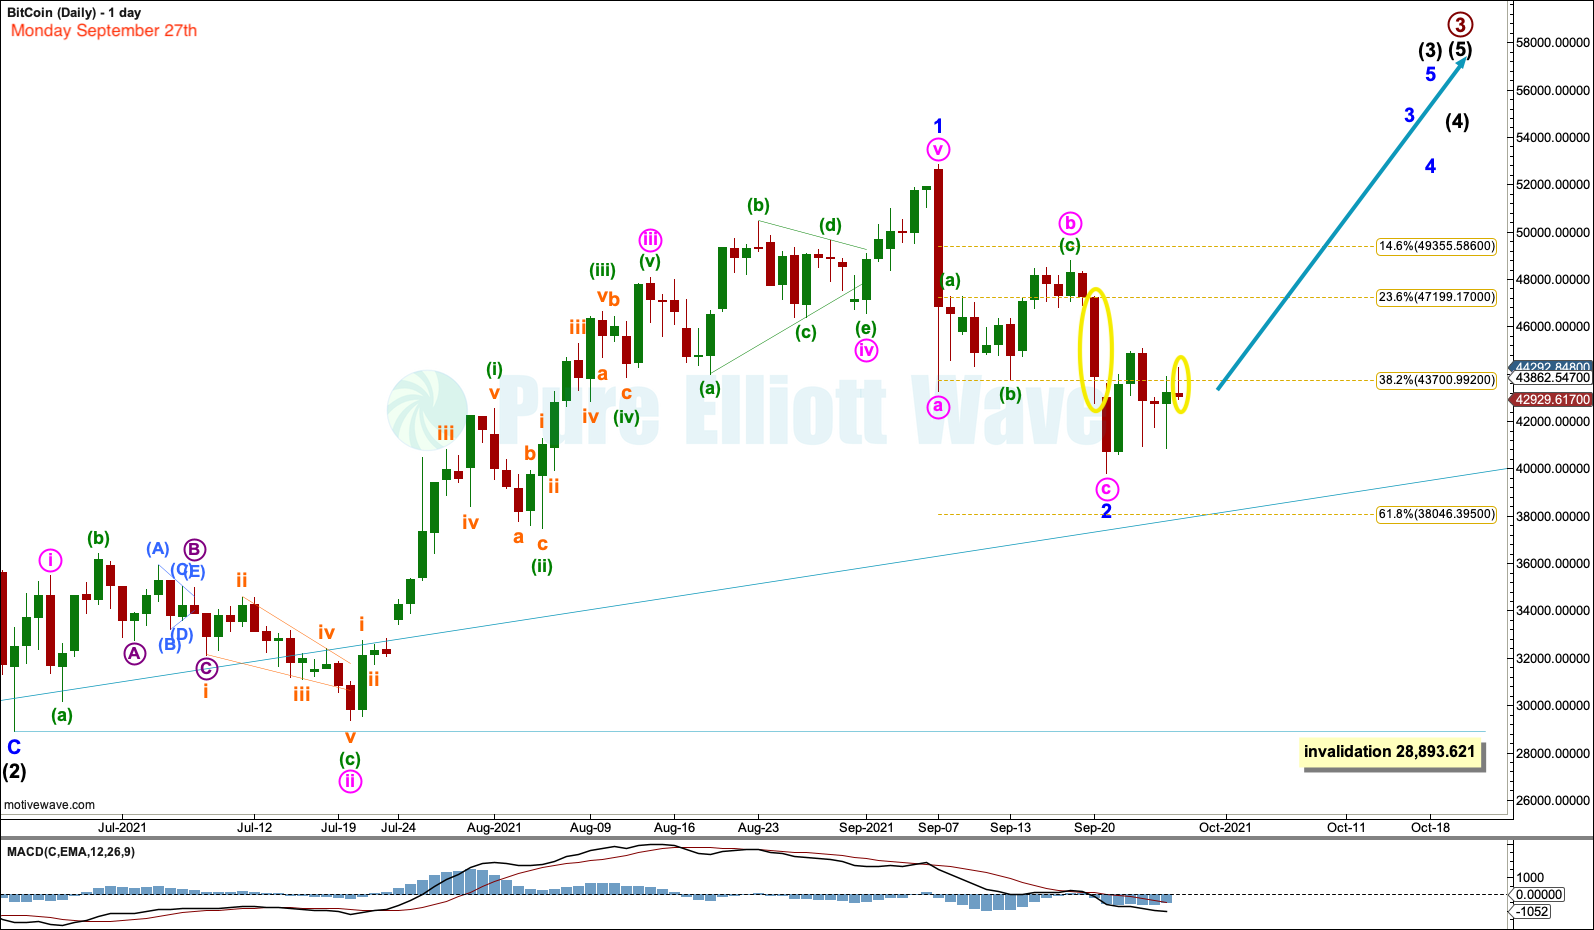
The next week expected the low was in. This was the main daily chart for the main Elliott wave count.
The summary for that week stated “The main Elliott wave count expects the next bull run may have begun for Bitcoin. Price is expected to remain above 28,893.621 and continue to new all-time highs. A new high above 48,791.78 would add confidence in this main Elliott wave count.”
WEEK BEGINNING OCTOBER 4, 2021
DAILY CHART
Click chart to enlarge.
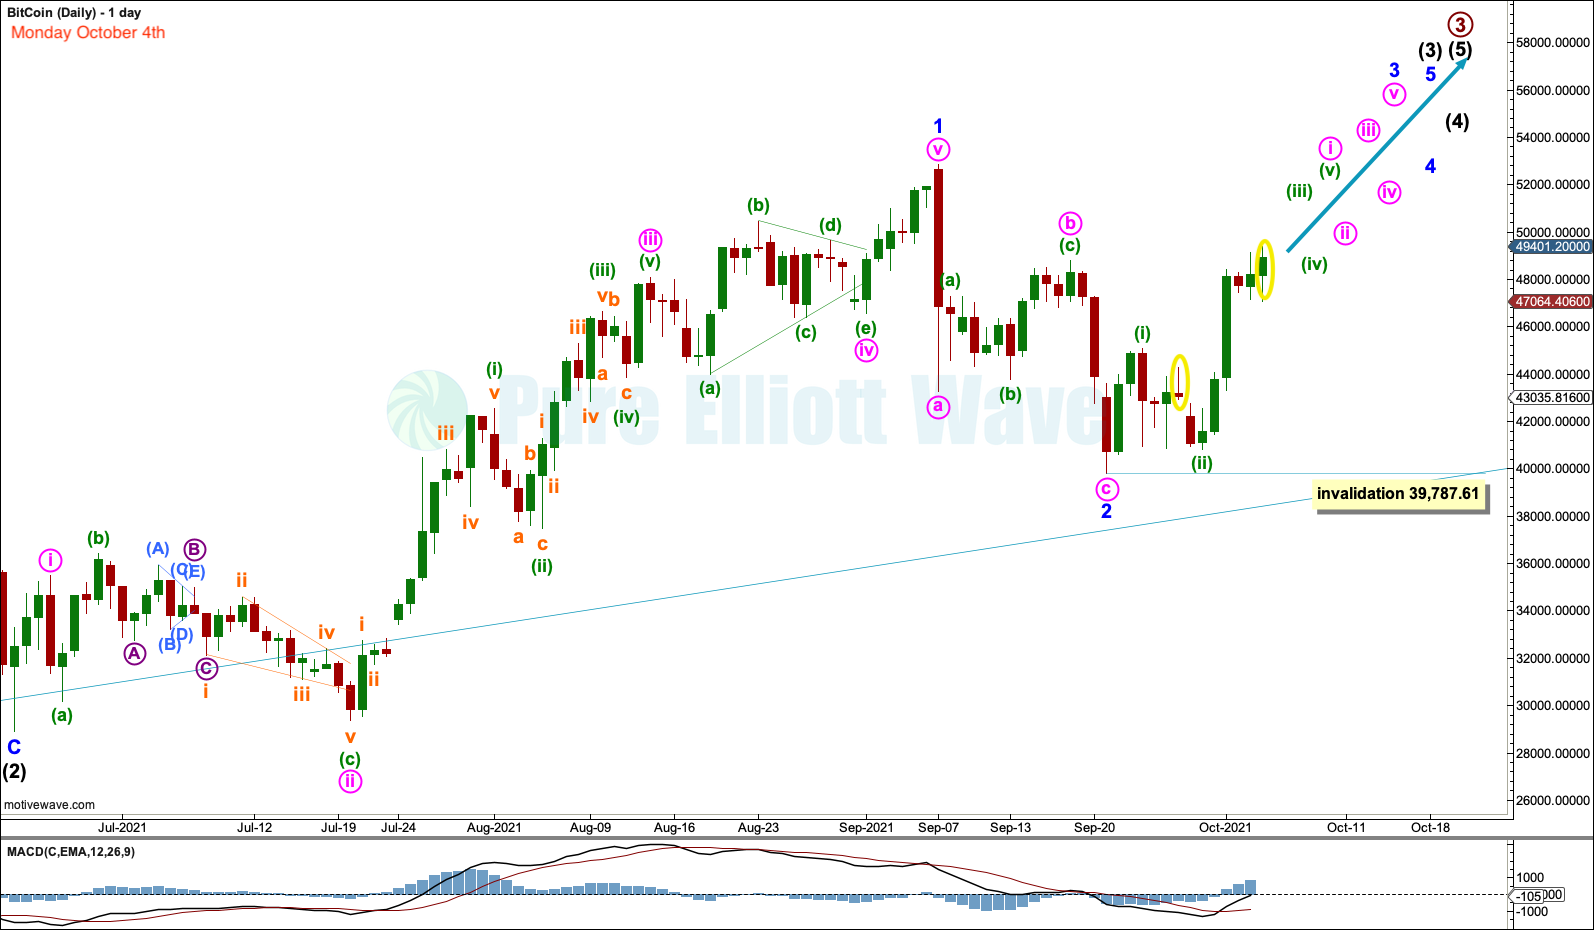
As price continued higher, the main Elliott wave count again expected a new all time high. The confidence point at 48,791.78 was passed.
WEEK BEGINNING OCTOBER 11, 2021
DAILY CHART
Click chart to enlarge.
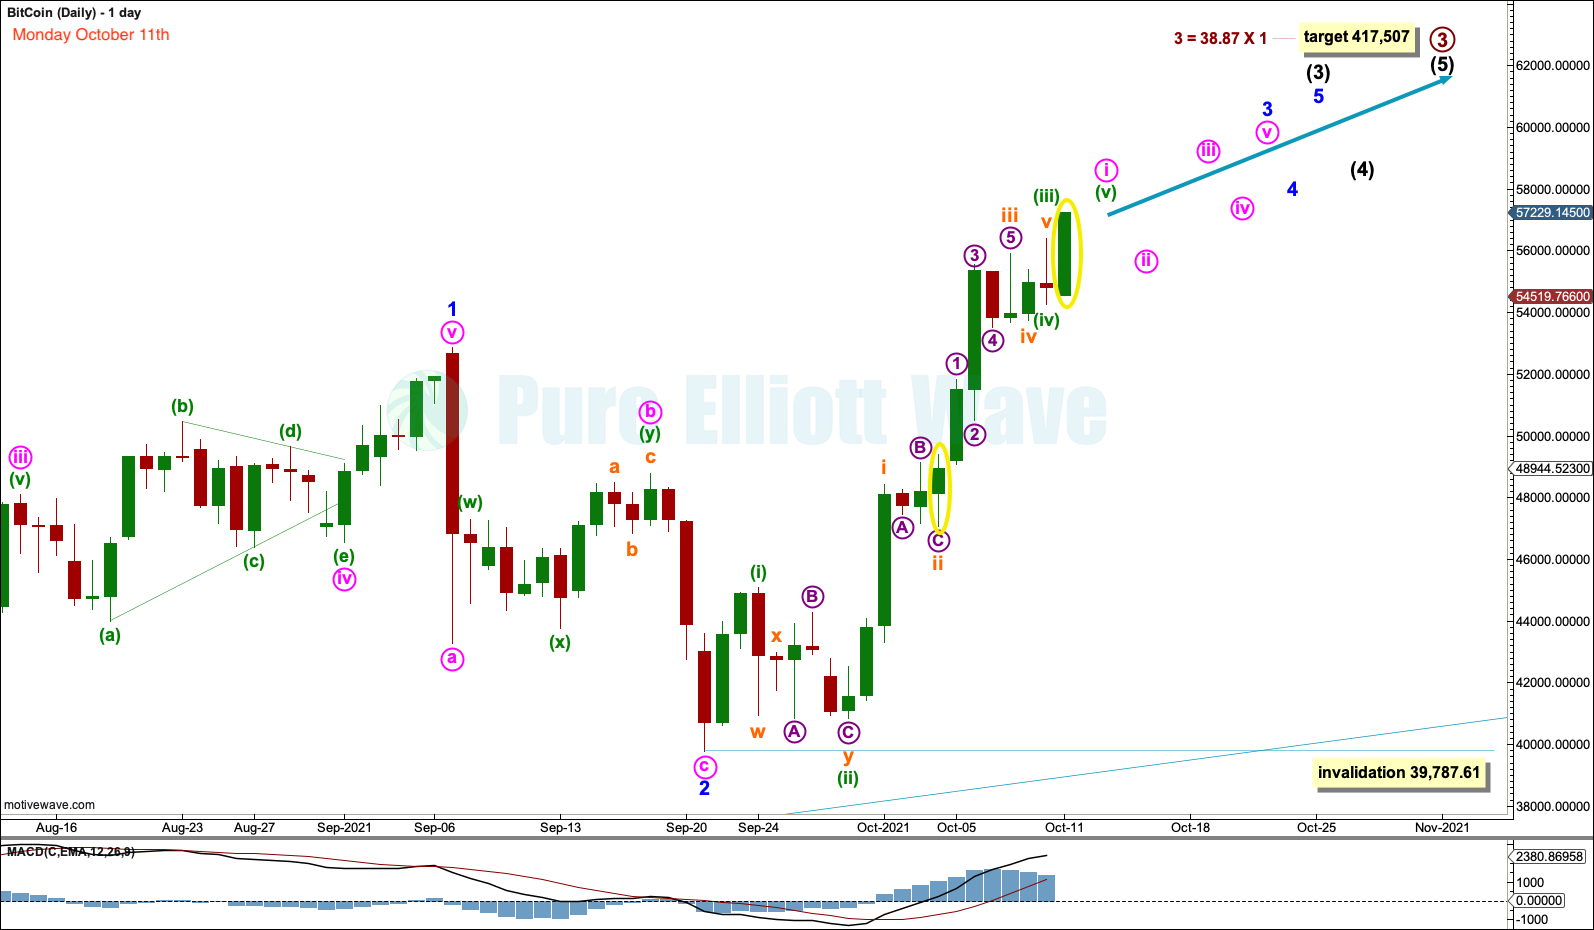
On this week both the main and alternate Elliott wave counts expected the bull market to continue for Bitcoin. New all-time highs were expected.
WEEK BEGINNING OCTOBER 18, 2021
DAILY CHART
Click chart to enlarge.
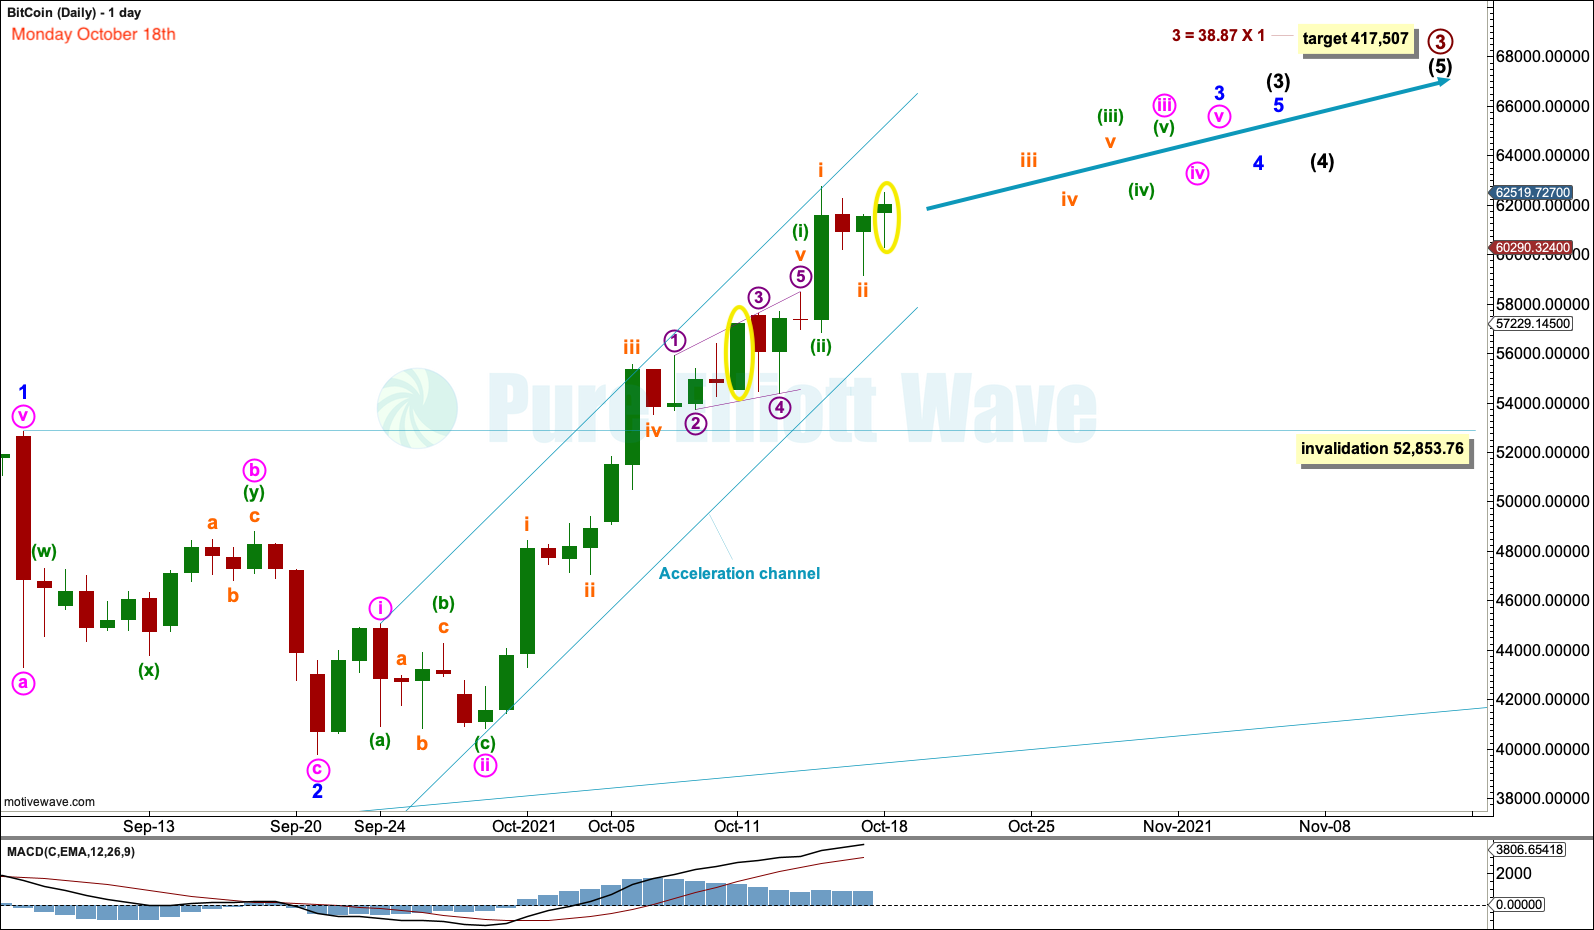
The main Elliott wave count this week expected an imminent breakout to new all-time highs. This is exactly what happened two days later on a closing basis, an event that the membership had been expecting for weeks.
WEEK BEGINNING OCTOBER 25, 2021
DAILY CHART
Click chart to enlarge.
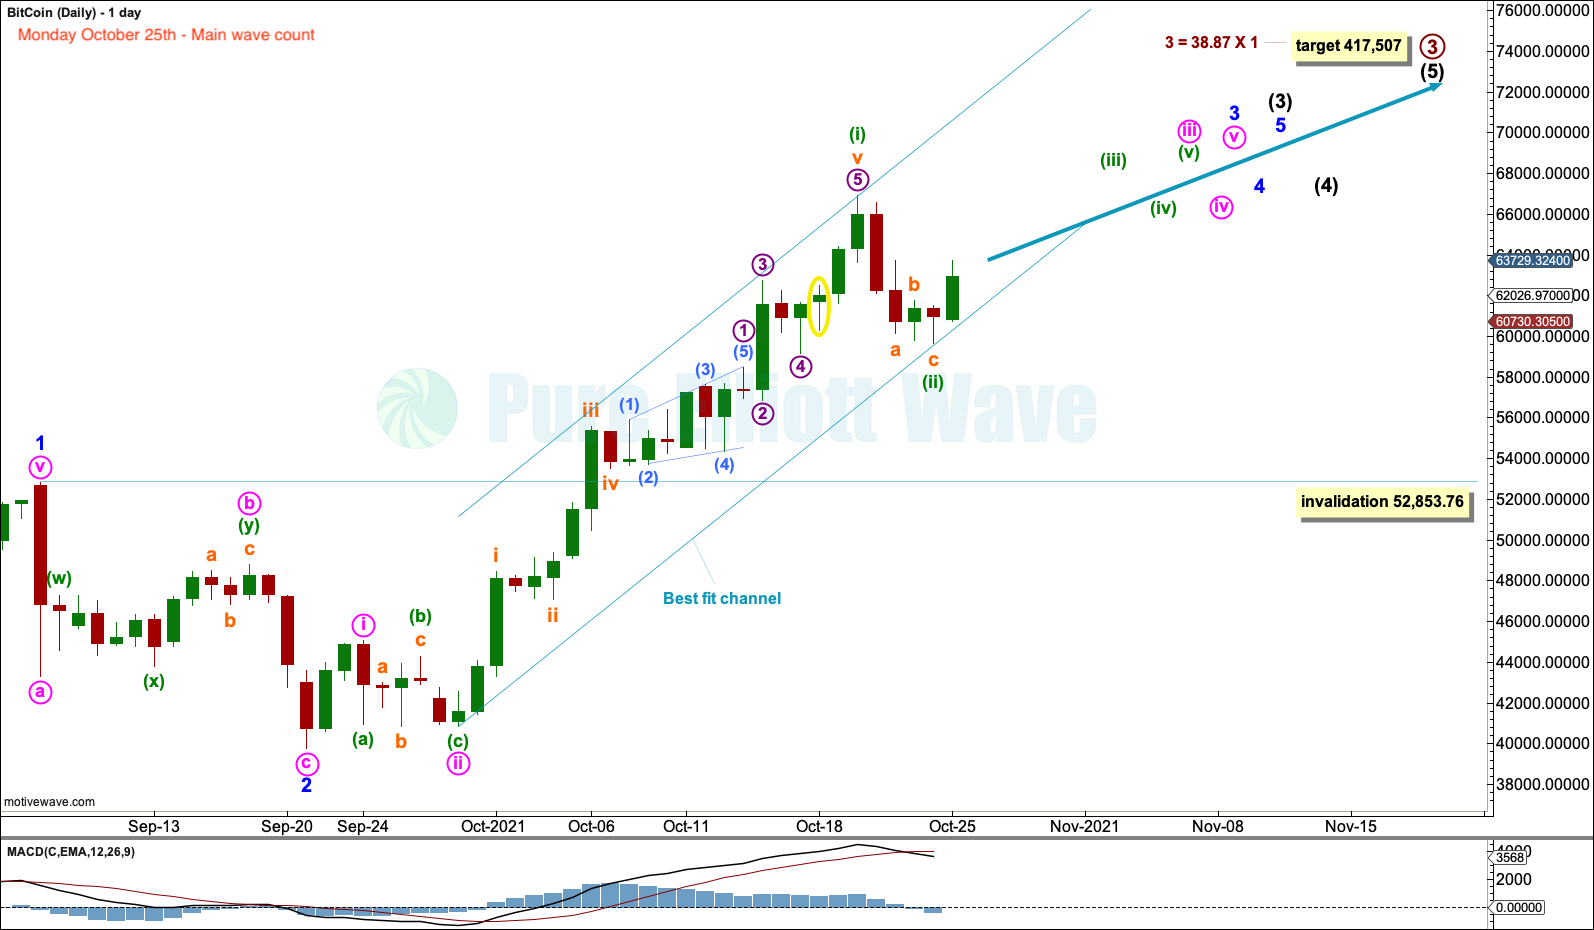
After the upwards breakout, Bitcoin saw a small pullback. The main Elliott wave count of October 25th expected the small pullback was over and Bitcoin should continue to move overall higher.
ALTERNATE DAILY CHART
Click chart to enlarge.
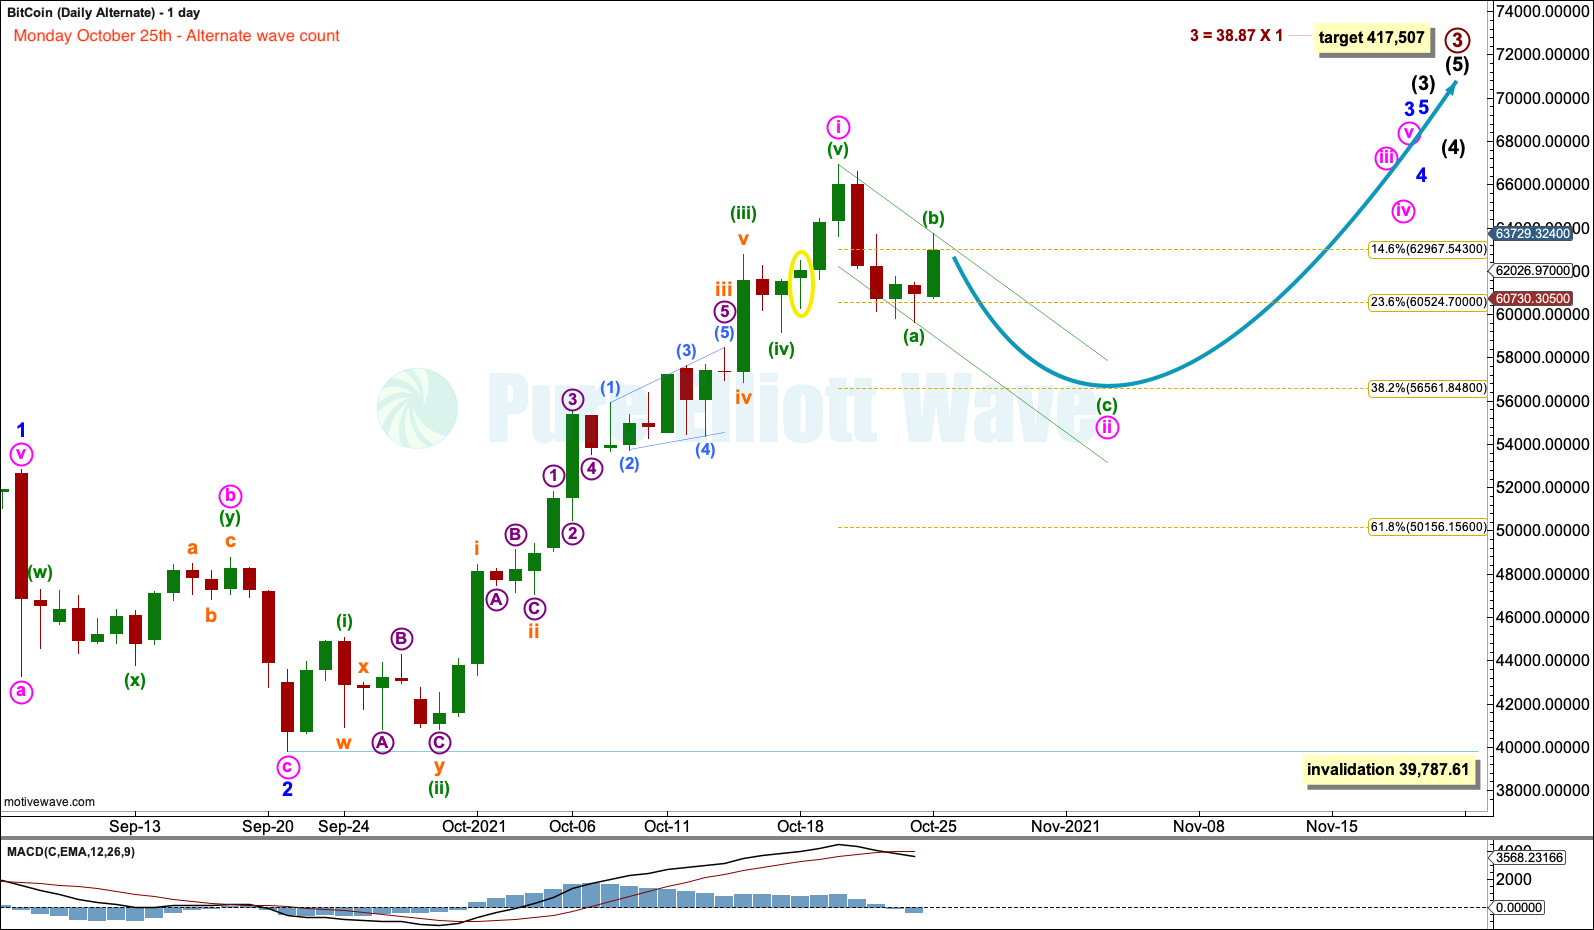
The alternate Elliott wave count differed from the main Elliott wave count only in looking out for a smaller pullback or consolidation to unfold before another upwards breakout to new all-time highs. The alternate Elliott wave count considered that Bitcoin may have some more “work” to do before the breakout could be sustained. The target for support was identified at 56,561.
Bitcoin did move a little lower to find support at 58,208 two days later on October 27th. To date this low has been held.
What will be Bitcoin’s next move? Subscribe to Pure Elliott Wave Bitcoin Weekly analysis for only $40 per month to find out.
Analysis is published each Monday when the weekly data is finalised. For members only, an article with fully annotated charts is prepared, as seen here, and a video is published on the same day.
Note: The data used for the analysis comes from Yahoo Finance BTC-USD.
Published @ 8:10 p.m. ET.
—
Careful risk management protects your investments.
Follow my two Golden Rules:
1. Invest only funds you can afford to lose.
2. Have an exit plan for both directions – where or when to take profit, and when to exit a losing investment.
—
New updates to this analysis are in bold.
—
 Save as PDF