XRPUSD: Elliott Wave and Technical Analysis – Video and Charts – November 24, 2021
Summary: A test of support is expected about 0.9311. Thereafter, an upwards breakout and a resumption of the larger upwards trend may occur.
The data used for this analysis comes from Yahoo Finance XRP-USD.
Weekly charts are on a semi-log scale. The close up daily chart is on an arithmetic scale.
MAIN ELLIOTT WAVE COUNT
MONTHLY
Click chart to enlarge.
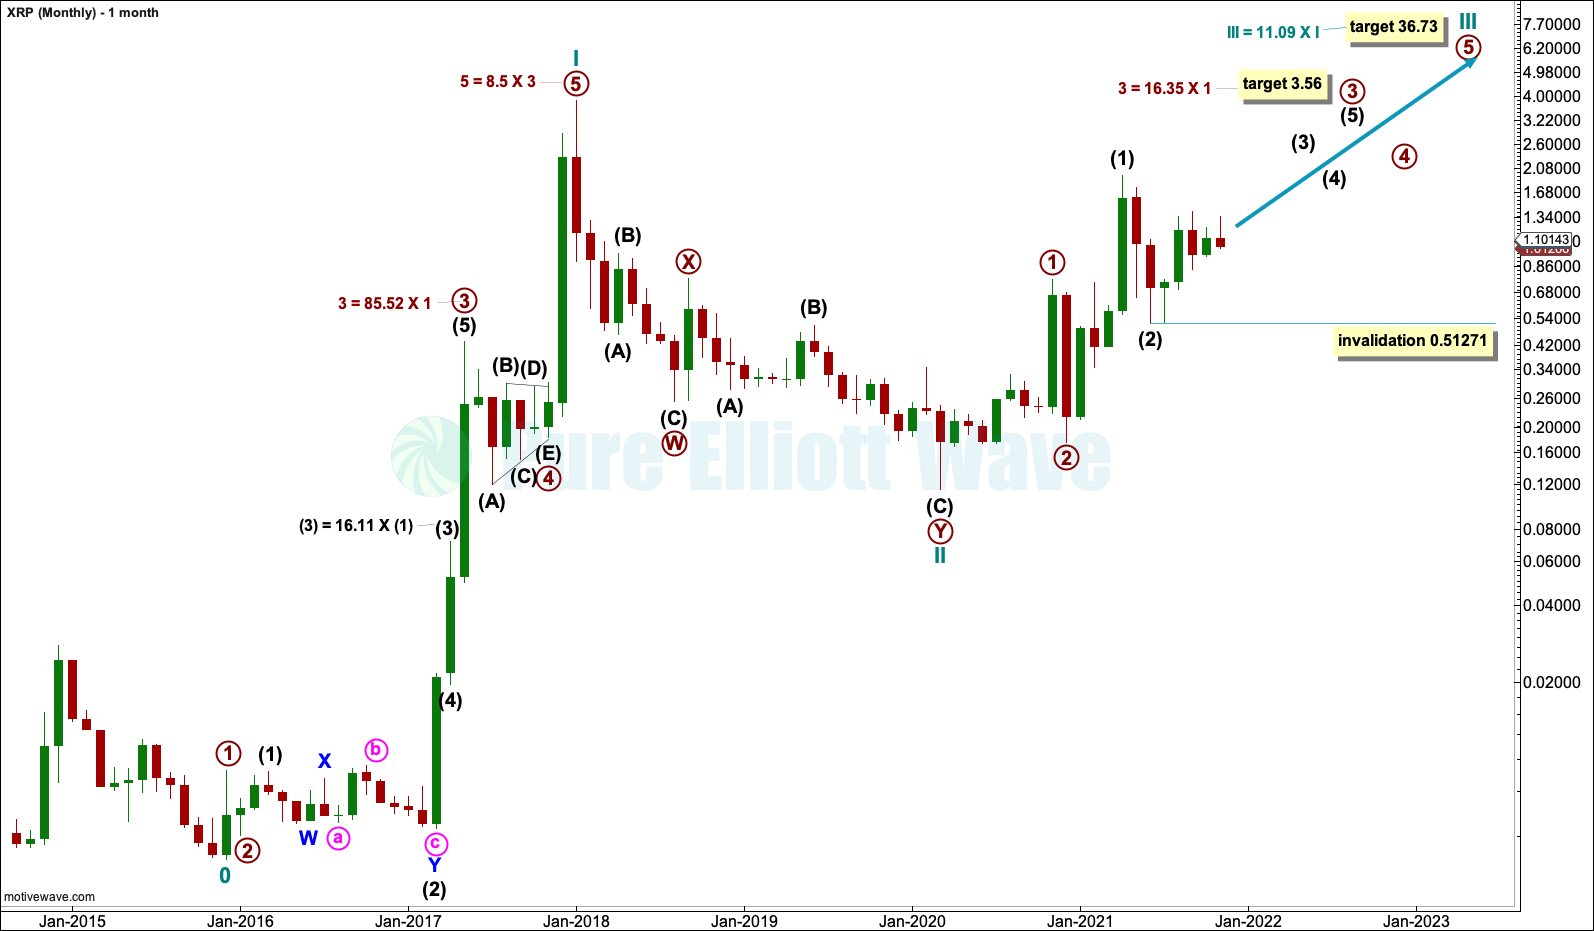
The Elliott wave count for XRP begins in December 2015. A complete Elliott five wave impulse can be seen from that low to the all time high, labelled cycle wave I, which lasted 25 months, just over 2 years. Cycle degree waves normally last from one to several years, so this degree of labelling looks correct.
Following a five up should be a three down. The three down is labelled cycle wave II and subdivides best as a double zigzag, which is a common Elliott wave structure.
Cycle wave III may have begun at the low in March 2020. Cycle wave III must move beyond the end of cycle wave I; it must move far enough above the end of cycle wave I at 3.84194 to allow room for cycle wave IV to unfold and remain above cycle wave I price territory. A target is calculated for cycle wave III using a Fibonacci ratio. If this target is wrong, then it would not be high enough; in XRP price history, its third waves within cycle wave I tend to be longer than this.
WEEKLY
Click chart to enlarge.
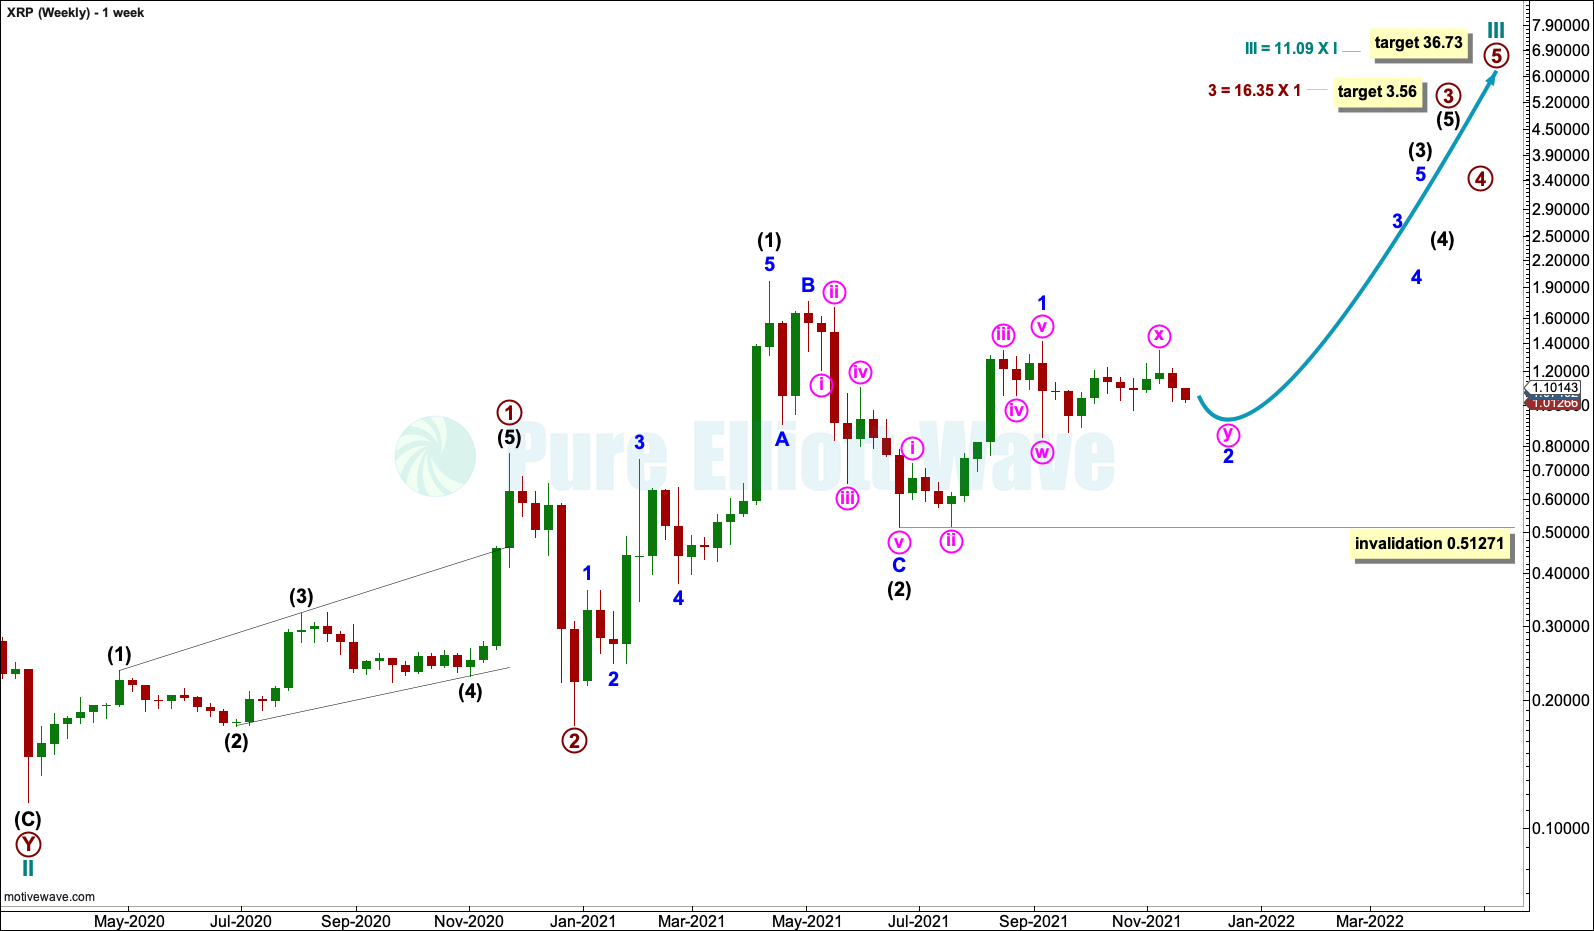
The weekly chart focusses on cycle wave III.
Cycle wave III may only subdivide as an impulse at primary degree. So far primary waves 1 and 2 may be complete. Primary wave 3 may have begun.
Primary wave 3 may only subdivide as an impulse at intermediate degree. So far intermediate waves (1) and (2) may be complete. Intermediate wave (3) may have begun.
Intermediate wave (3) may only subdivide as an impulse at minor degree. So far minor wave 1 may be complete. Minor wave 2 may continue sideways as a double combination; it may not move beyond the start of minor wave 1 below 0.51271.
When minor wave 2 may be complete, then this wave count now expects a third wave up at minor, intermediate, primary and cycle degree may begin. This is a very bullish wave count. A strong increase in upwards momentum may be expected if it is correct.
DAILY
Click chart to enlarge.
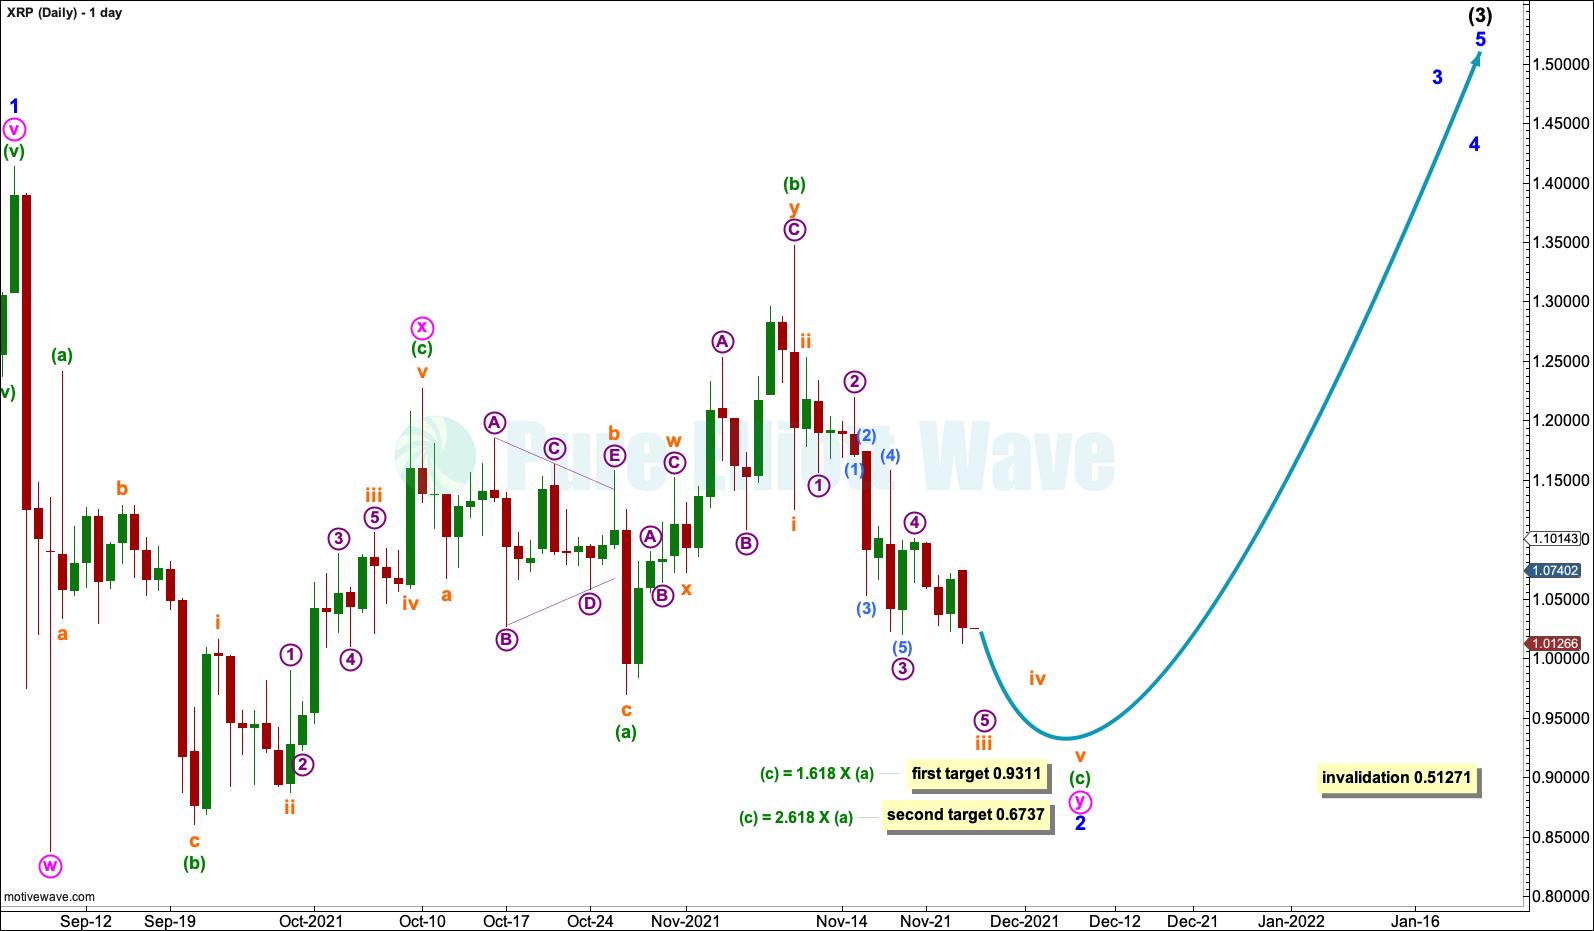
Minor wave 2 may be continuing further sideways as a double combination. The first structure in the double may be a complete zigzag, labelled minute wave w. The double may be joined by a complete three in the opposite direction, a zigzag labelled minute wave x.
The second structure in the double may be completing. Minute wave y may be an expanded flat. This labelling has a good fit and double combinations are common structures.
When minor wave 2 is complete, then it would be longer in duration than primary wave 2 and intermediate wave (2). This proportion is not ideal, but it is within allowable limits. Within the price history of XRP during the bull run from December 2015 to January 2018, it had second wave corrections of lower degrees that lasted much longer than second wave corrections of higher degrees, so this is precedented.
ALTERNATE ELLIOTT WAVE COUNT
MONTHLY
Click chart to enlarge.
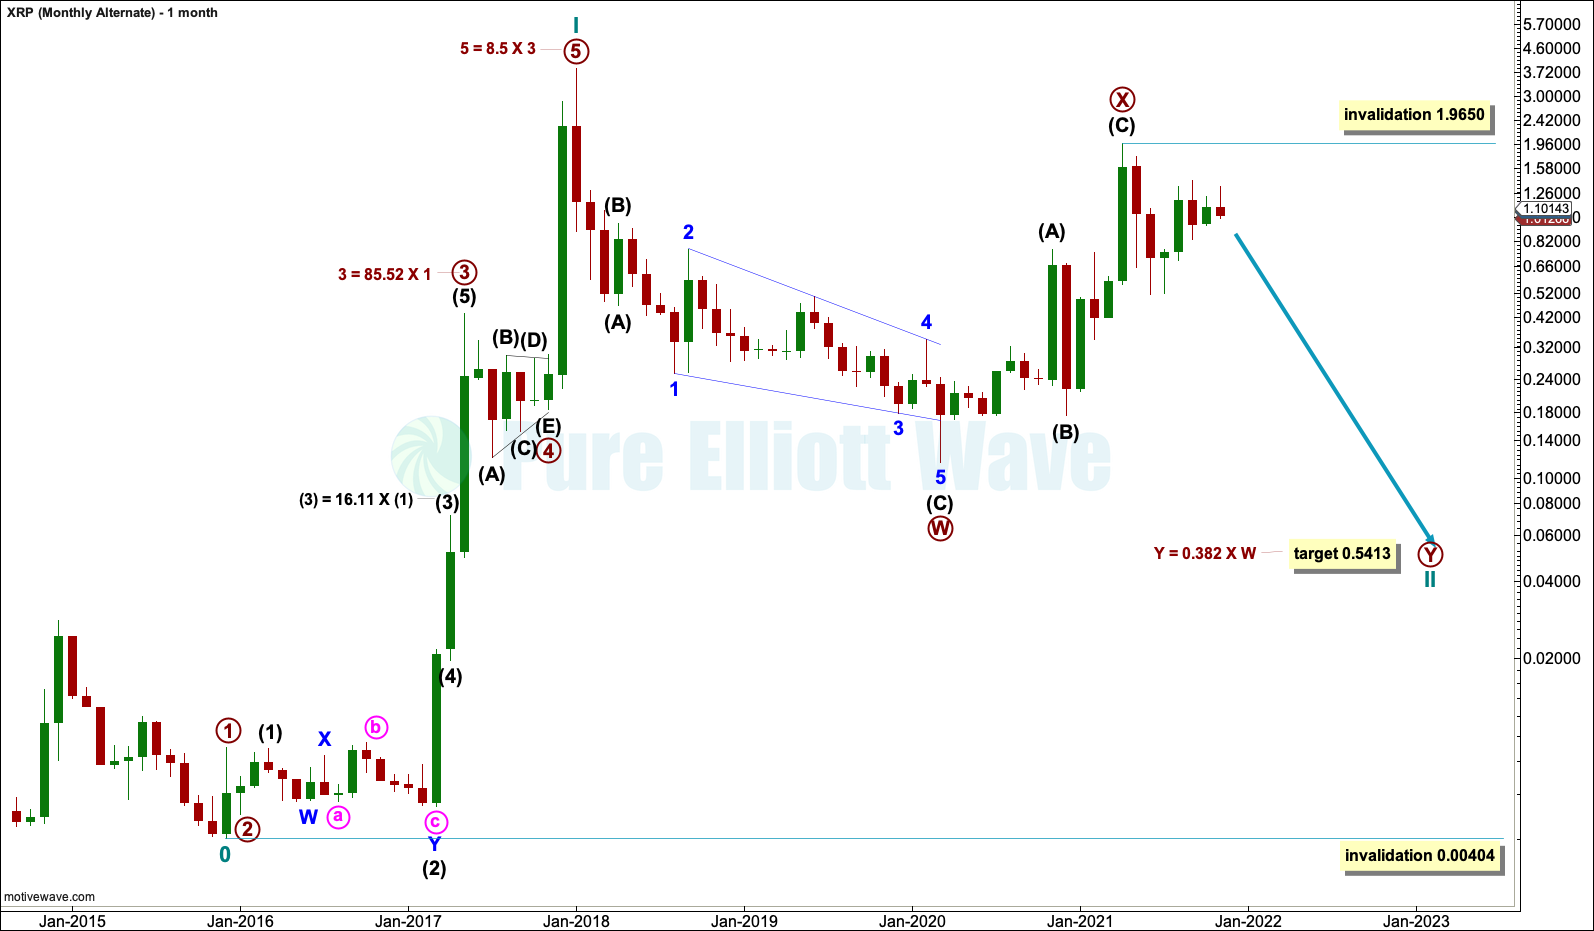
It is possible that cycle wave II may not be complete.
If the main Elliott wave count is invalidated with a new low below 0.51271, then this alternate Elliott wave count may be used.
A target is calculated for cycle wave II to continue lower as a double zigzag. Cycle wave II may not move beyond the start of cycle wave I below 0.00404.
TECHNICAL ANALYSIS
WEEKLY
Click chart to enlarge.
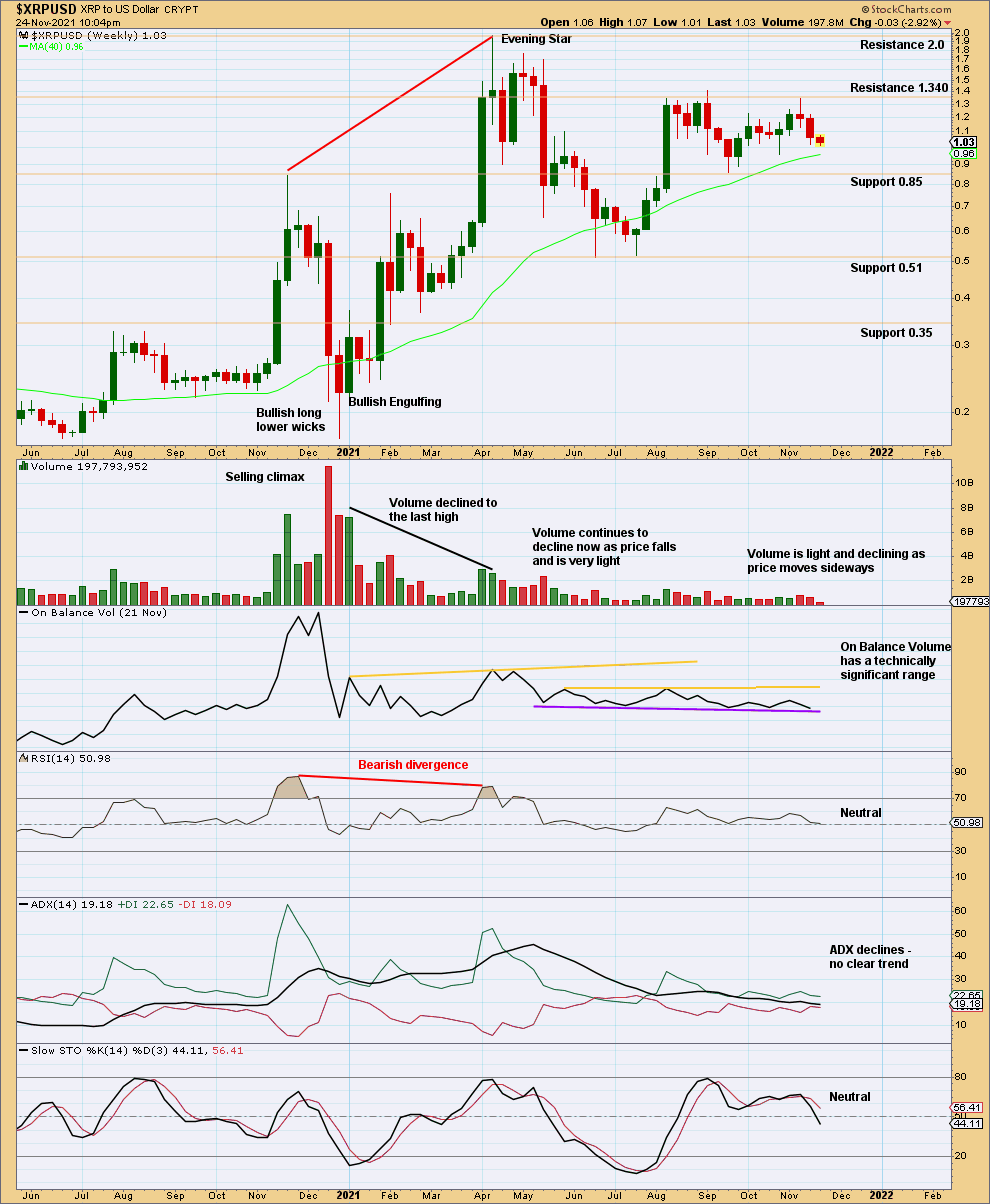
XRP is consolidating with resistance about 1.340 and support about 0.085. On Balance Volume is also within a range of resistance and support. A breakout is required for confidence in the next direction.
DAILY
Click chart to enlarge.
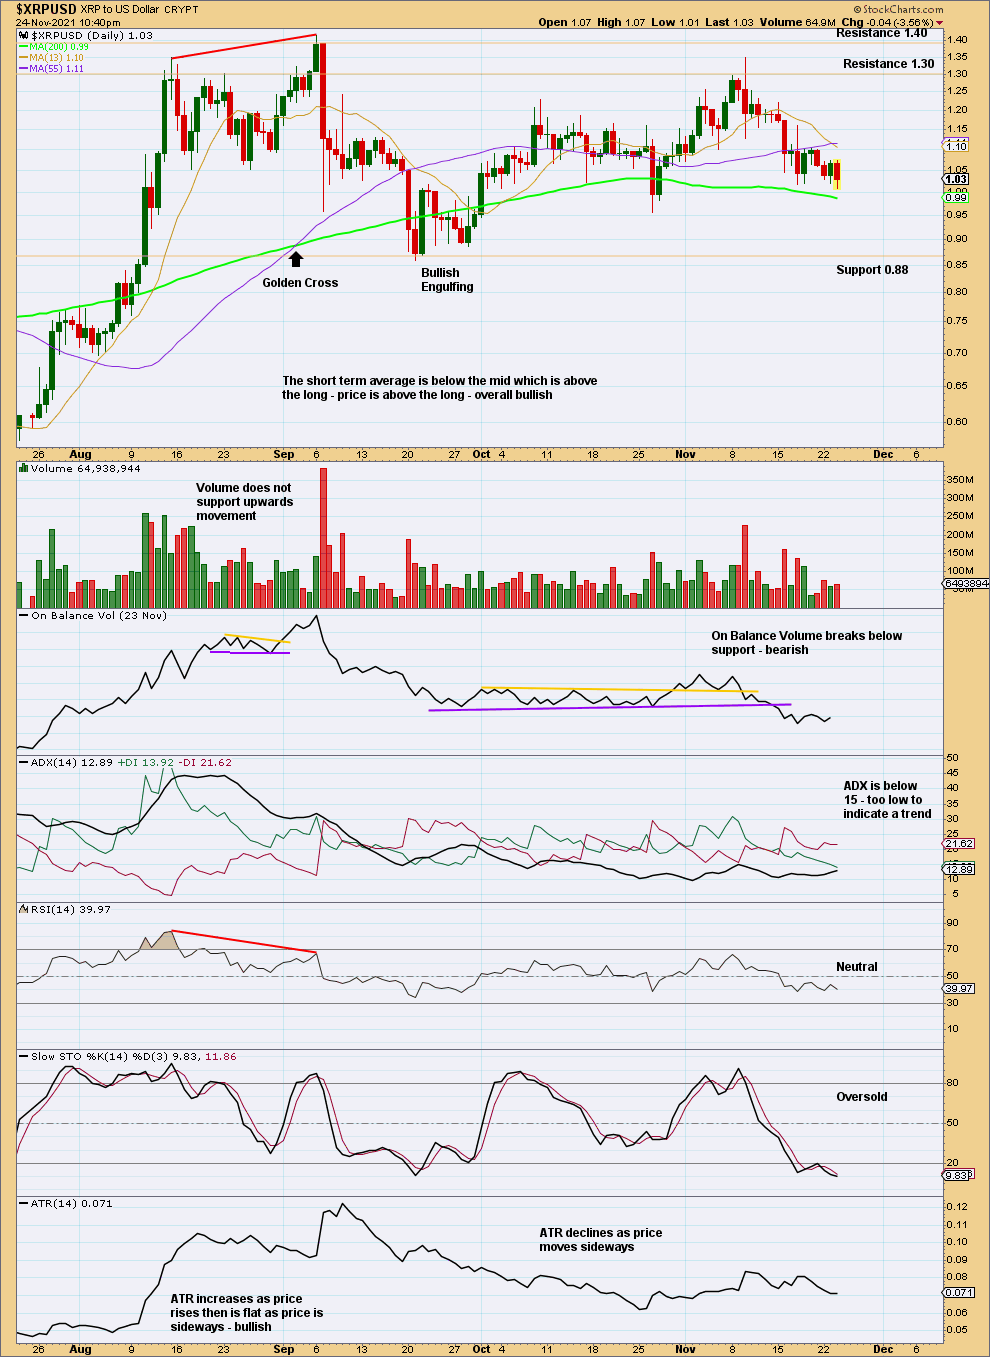
At the daily chart level, the consolidation zone looks to be with resistance about 1.30 and support about 0.88.
ADX now indicates a downwards trend. On Balance Volume gives a bearish signal. Either another test of support or a downwards breakout may reasonably be expected.
This chart suggests the lower Elliott wave target at 0.6737 may be more likely.
Published @ 07:33 p.m. ET.
—
Careful risk management protects your investments.
Follow my two Golden Rules:
1. Invest only funds you can afford to lose.
2. Have an exit plan for both directions – where or when to take profit, and when to exit a losing investment.
—
New updates to this analysis are in bold.
 Save as PDF