RIOT: Elliott Wave and Technical Analysis – Video and Charts – February 19, 2022
Summary: Downwards movement is expected to overall continue towards a target zone from 9.59 to 8.21. A new low below 0.511 is not expected.
ELLIOTT WAVE COUNT
MONTHLY CHART
Click chart to enlarge.
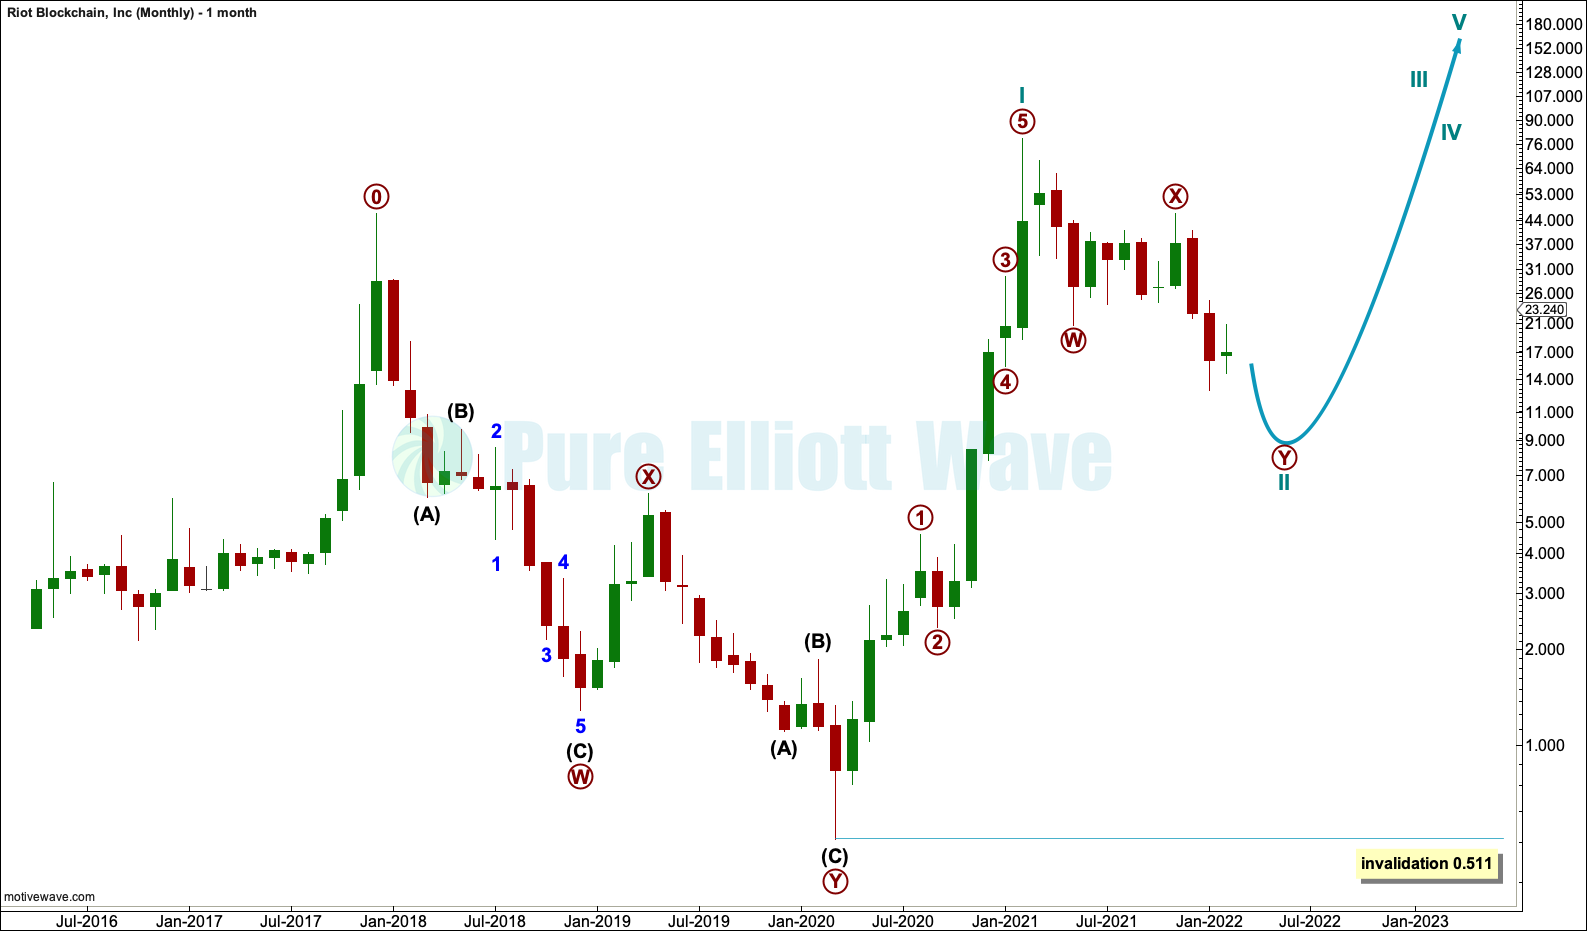
It is difficult to see where to begin the Elliott wave count for RIOT. I have analysed the structure of the bear market from December 2017 to March 2020 as a double zigzag, which is a counter trend structure, and I will see a first wave beginning at the end of it.
It is possible to see from the March 2020 low a completed five wave impulse up to the high in February 2021. This is labelled cycle wave I.
Cycle wave II may be continuing lower as a double zigzag. Cycle wave II may not move beyond the start of cycle wave I below 0.511.
WEEKLY CHART
Click chart to enlarge.
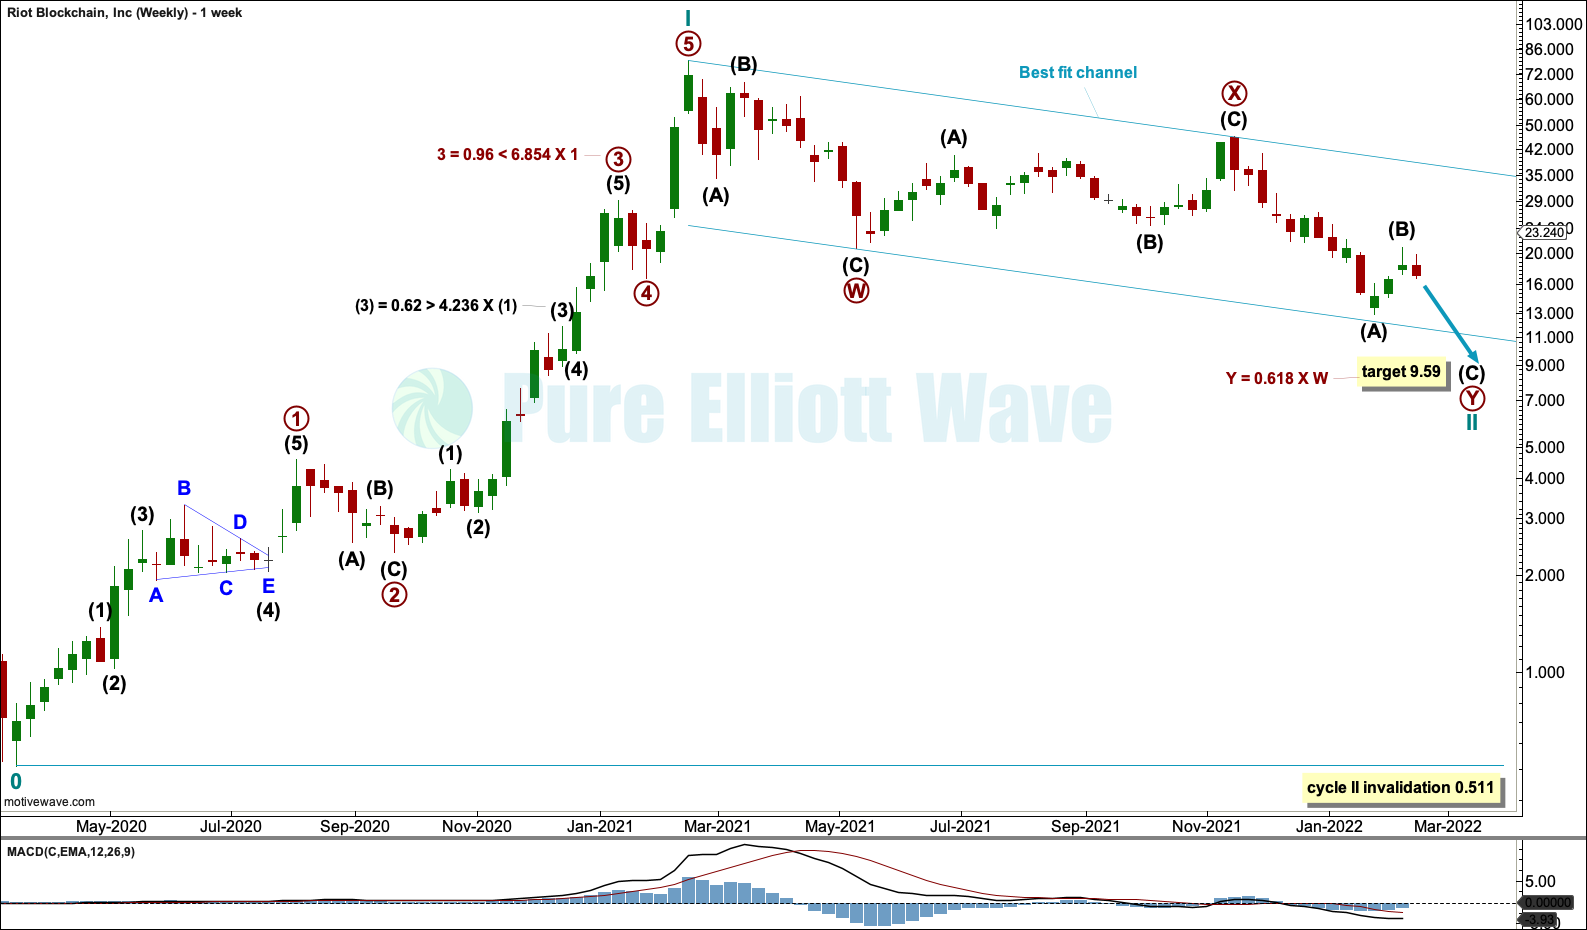
The weekly chart focuses on cycle waves I and II. Where I have found Fibonacci ratios between actionary waves within cycle wave I, these are noted on the chart. It is my judgement that a variation of less than 10% from a perfect ratio is sufficient to say the two waves exhibit a Fibonacci ratio to each other.
Where no Fibonacci ratios have been found then no notation has been made.
RIOT appears to exhibit Fibonacci ratios occasionally, but not regularly. These ratios are extreme compared to most equities but less extreme compared to most cryptocurrencies in my experience with these markets.
This may be useful in target calculation.
Cycle wave II may continue lower now as a double zigzag. This structure so far fits well within a best fit channel. This channel may be used for support and resistance while cycle wave II continues. If this channel is breached by upwards movement, then that may be taken as an indication that cycle wave II may be over and cycle wave III may then have begun.
So far cycle wave II has lasted one year, 52 weeks. It may end now sooner rather than later; cycle degree waves normally last from one to several years, with bear markets normally more brief than bull markets.
DAILY CHART
Click chart to enlarge.
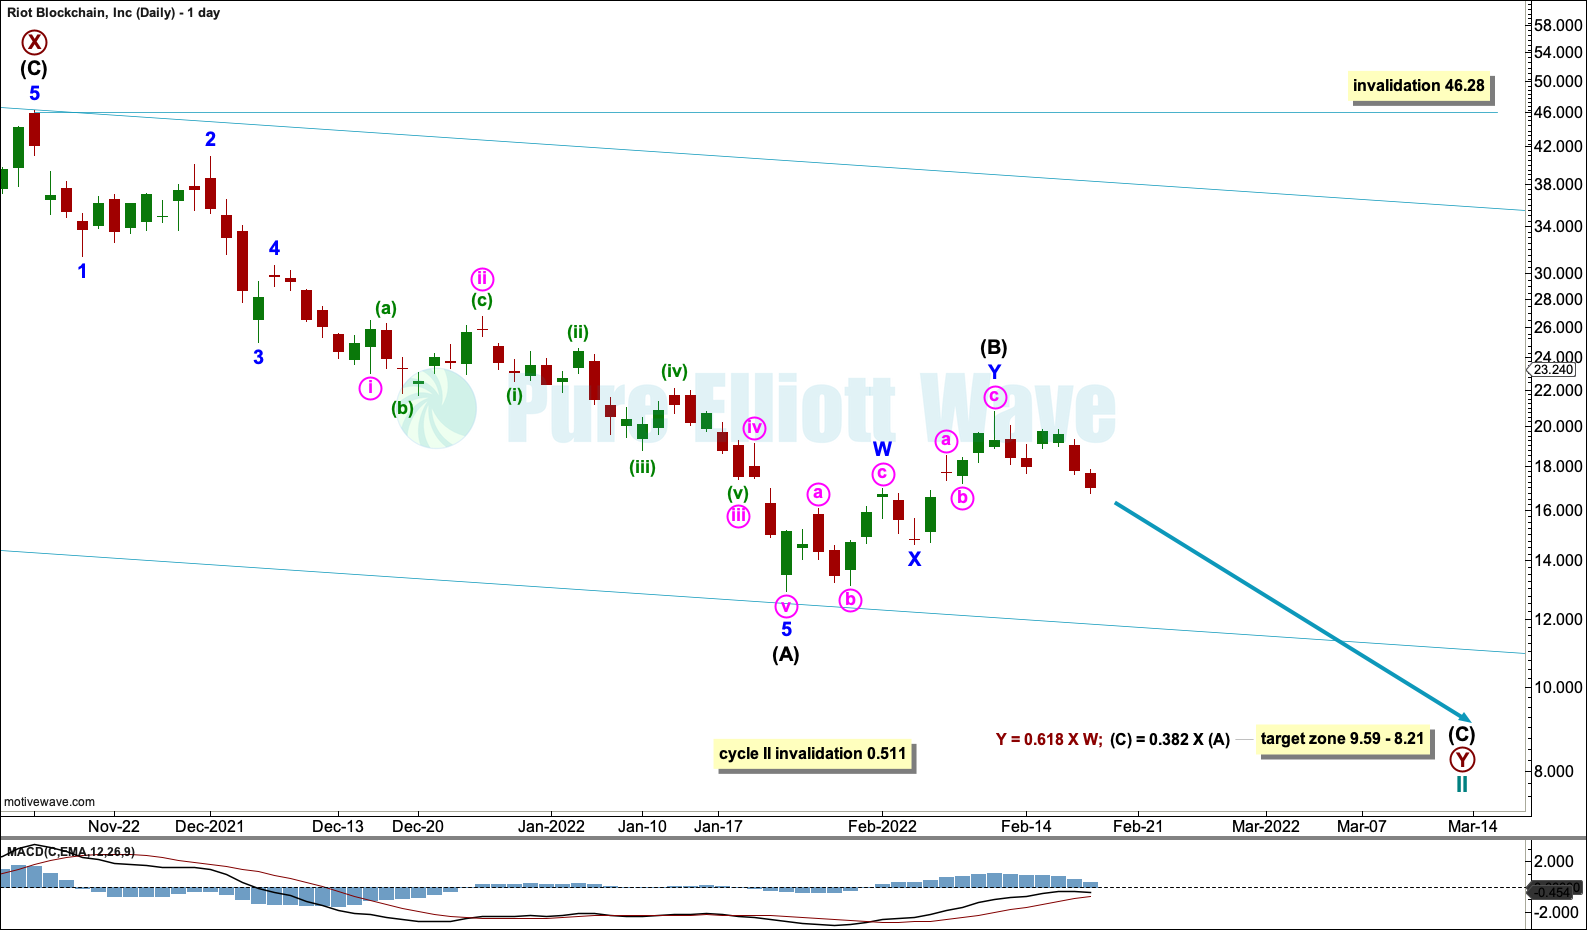
Within the double zigzag of cycle wave II: Both primary waves W and X may be complete and primary wave Y may continue lower as the second zigzag.
Within primary wave Y, intermediate waves (A) and (B) may be complete. If intermediate wave (B) moves higher, then it may not move beyond the start of intermediate wave (A) above 46.28. However, a breach of the upper edge of the channel would indicate an end to cycle wave II long before the invalidation point is reached.
A target is calculated at two degrees for cycle wave II to end.
TECHNICAL ANALYSIS
WEEKLY CHART
Click chart to enlarge. Chart courtesy of StockCharts.com.
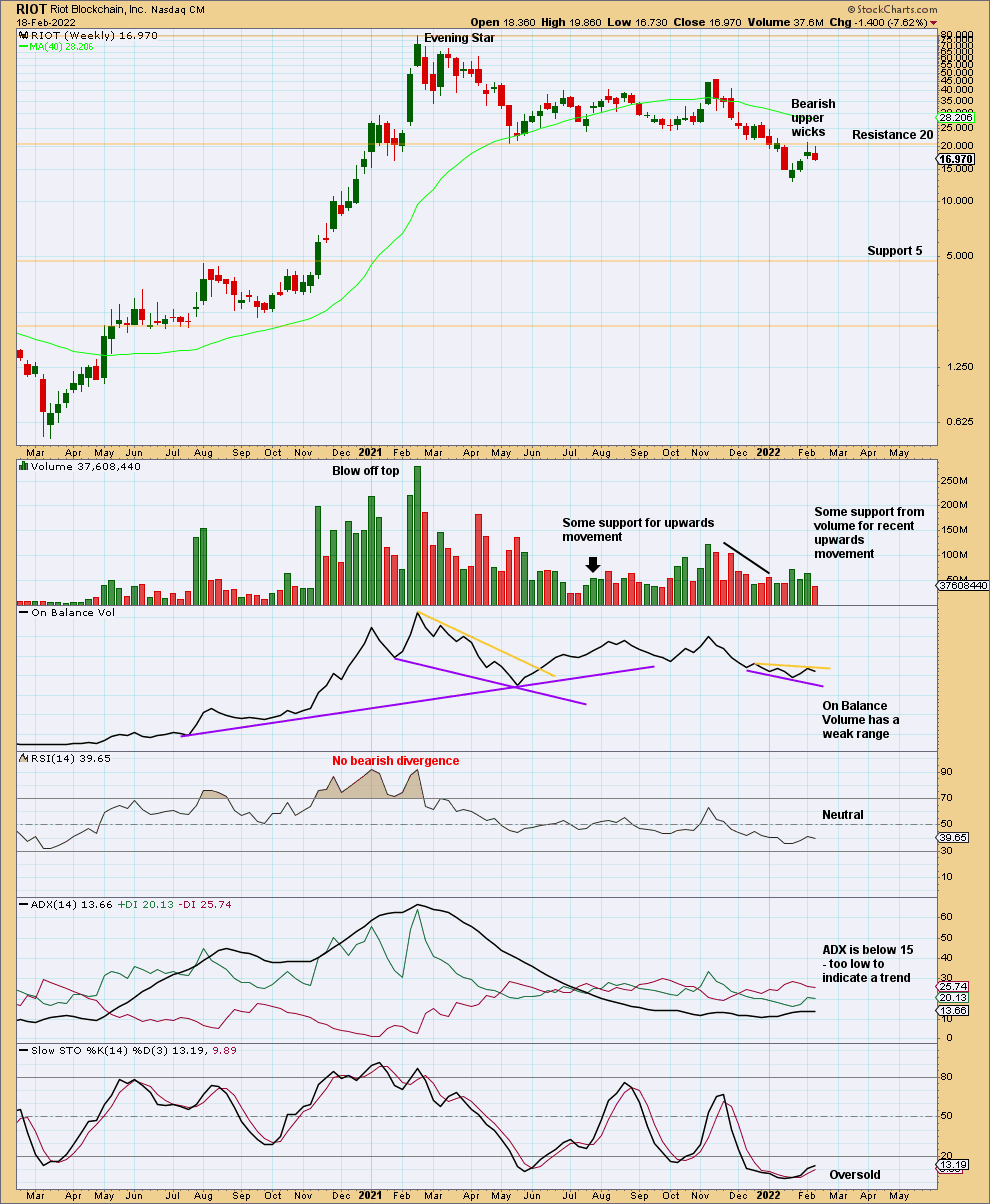
There was strong support about 20, which has now been reached. A throwback to resistance at 20 has completed. It would be reasonable now to expect price to move down and away to next support.
DAILY CHART
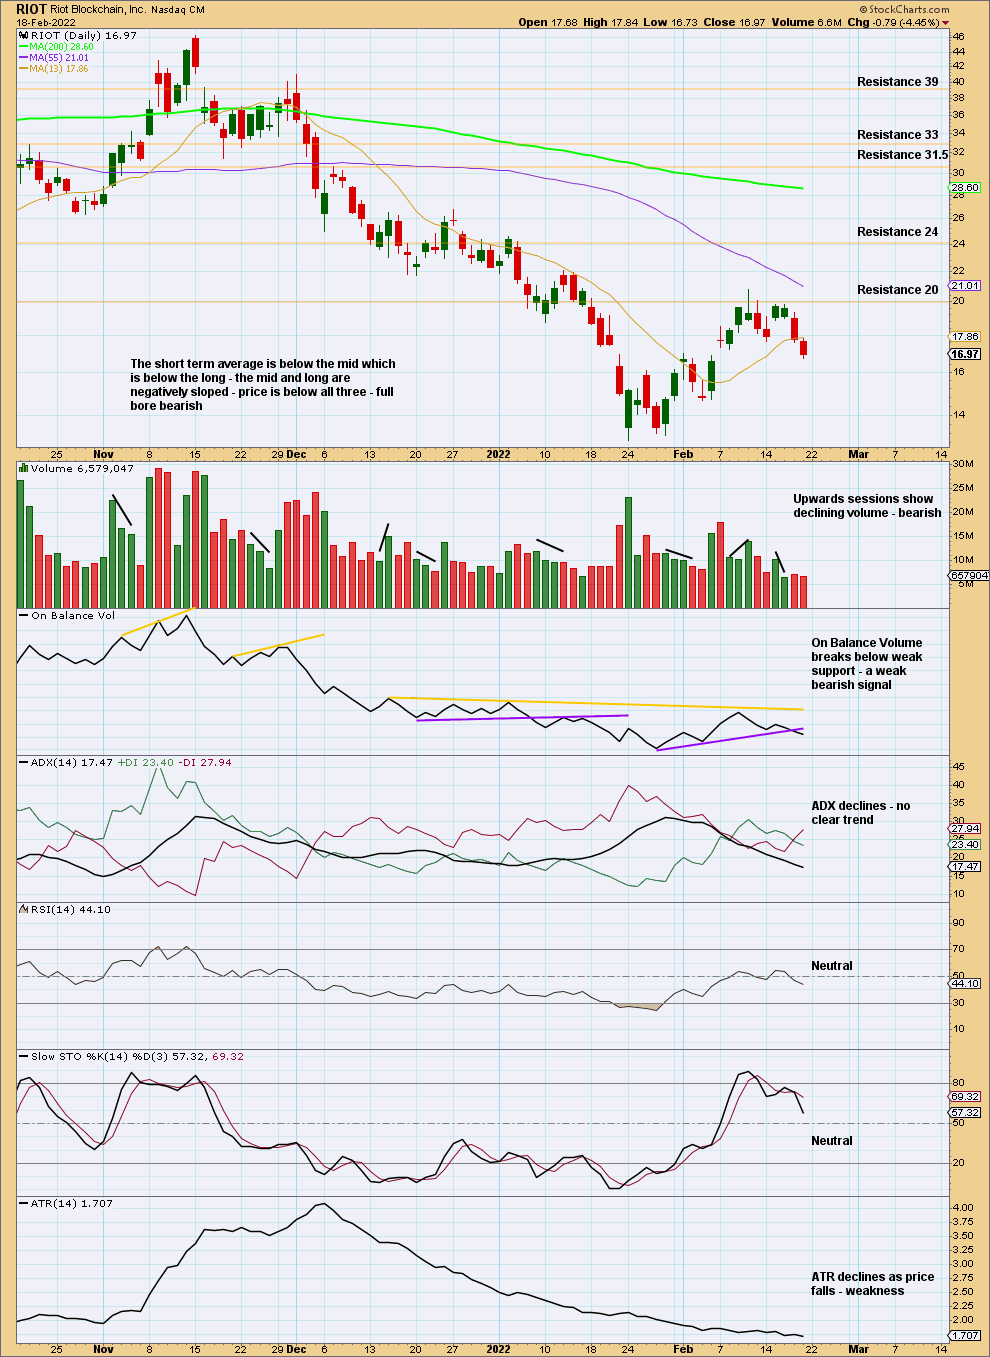
Click chart to enlarge. Chart courtesy of StockCharts.com.
There is no clear trend at either time frame. The short-term volume profile looks bearish; it looks most likely that a downwards trend may again develop here.
Published @ 11:18 p.m. ET.
—
Careful risk management protects your investment account(s).
Follow my two Golden Rules:
1. Invest only funds you are prepared to lose entirely.
2. Always have an exit strategy for both directions; when or where to take profit on a winning investment, and when or where to close a losing investment.
—
New updates to this analysis are in bold.
—
 Save as PDF