March 28, 2022: BTCUSD Elliott Wave and Technical Analysis – Weekly – Video and Charts

Summary: The upwards trend may have overall resumed. On March 27th Bitcoin broke above resistance, which was about 45,500, on an upwards session that had some support from volume (compared to the session prior). This was an important upwards breakout from a consolidation and supports the Elliott wave analysis.
The Elliott wave count expects months to overall years of upwards movement to complete a cycle degree third wave. Targets (from the monthly chart) for cycle wave III are highly provisional; they are subject to change as more structure is available to analyse. The targets in order from lowest to highest are: 223,535 (unlikely to be high enough), 775,540 and 936,671.
A new target for a primary degree third wave is calculated at 417,507. This target may be met in mid December 2022.
The low at 3,191.30 of December 15, 2018, is expected to be sustained.
A new low below 33,184.06 would invalidate the main Elliott wave count and give confidence to a more bearish alternate. At that stage, the target would be at 20,461 with a lower possible target zone from 16,310.97 to 9,751.14. This alternate still has a lower probability.
The data used for this analysis comes from Yahoo Finance BTC-USD.
Weekly charts are on a semi-log scale. The close up daily chart is on an arithmetic scale.
For notes on identifying highs and lows for Bitcoin, see this article here.
Monthly charts were last updated here.
MAIN ELLIOTT WAVE COUNT
WEEKLY
Click chart to enlarge.
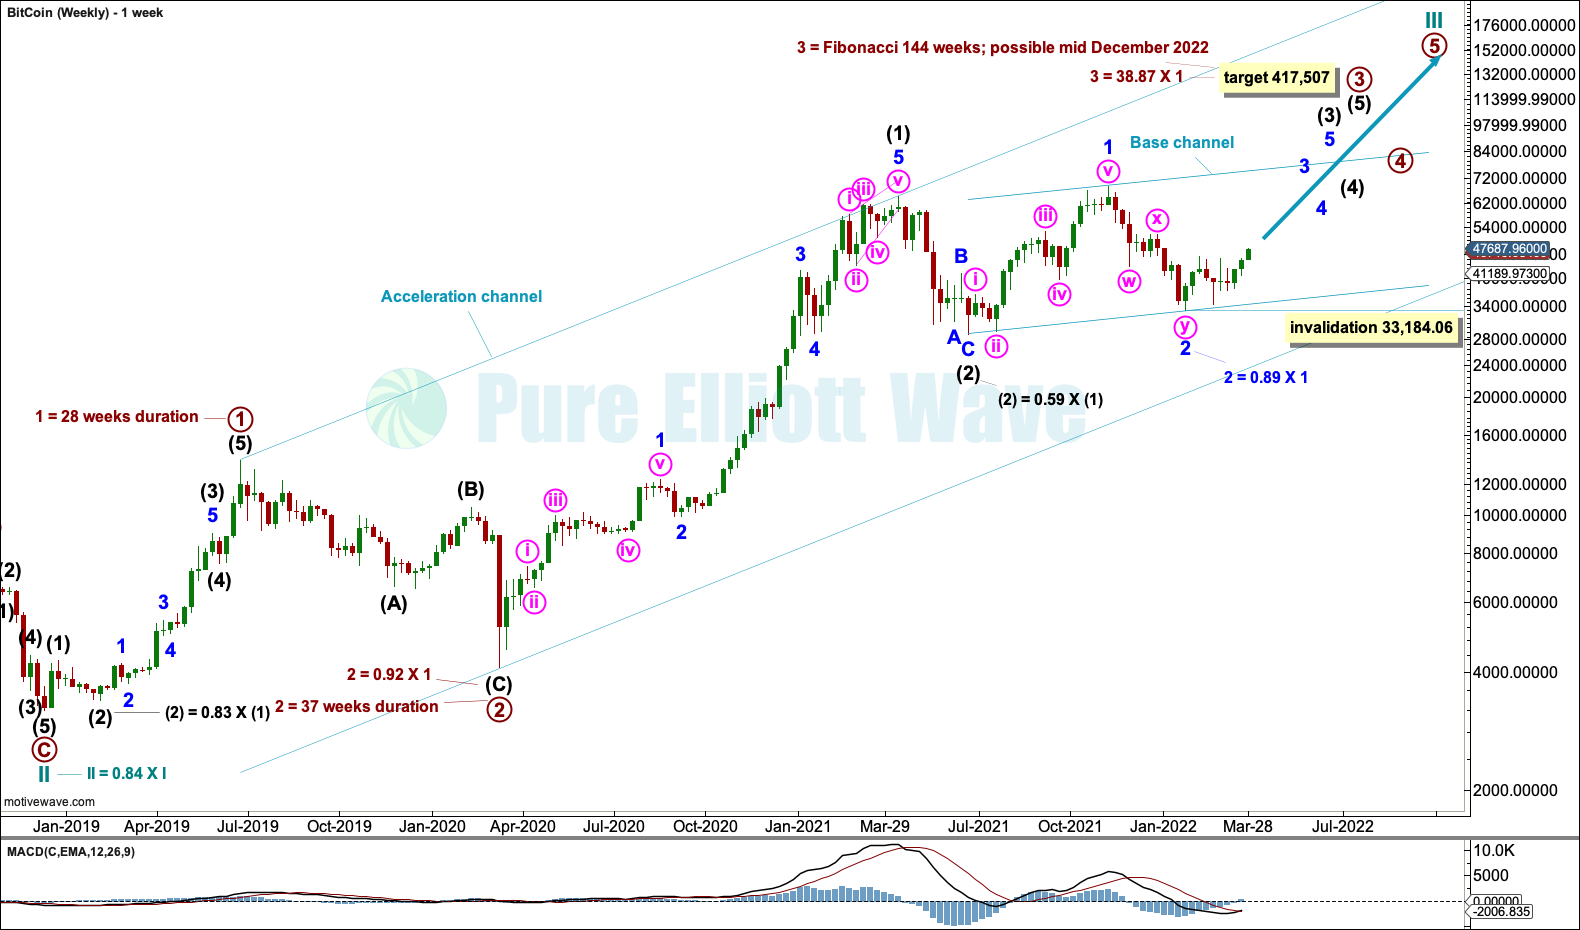
The weekly chart focusses on cycle wave III. Cycle wave III may only subdivide as an impulse. Primary waves 1 and 2 within the impulse may now be complete.
Primary wave 3 may be incomplete. Looking back at Bitcoin’s history within cycle wave I (viewed on Monthly charts), primary wave 3 was over 38 times the length of primary wave 1. At intermediate degree the lengths of third to first waves ranges from 17 times to 50 times the length of their first waves. If primary wave 3 was over at the last high, then it would be only 5.7 times the length of primary wave 1; this looks too short for normal behaviour for this market.
Intermediate waves (1) and (2) within primary wave 3 may now be complete.
All of intermediate wave (3), primary wave 3 and cycle wave III may only subdivide as impulses. Within intermediate wave (3), minor wave 2 may not move beyond the start of minor wave 1 below 28,893.621.
A target and time estimate is calculated for primary wave 3. The target considers the possibility that primary waves 3 and 1 within cycle wave III may exhibit the same relationship to each other as primary waves 3 and 1 within cycle wave I exhibited. This ratio of 38.87 is not a Fibonacci ratio.
Primary wave 3 has lasted 107 weeks so far. The possible duration for primary wave 3 of a Fibonacci 144 weeks is also highly provisional; it is provided as a rough guideline only.
Draw a base channel about minor waves 1 and 2. Minute wave ii has found support close to the lower edge of this channel. The lower trend line may continue to show where pullbacks may find support. The channel is copied over to the daily chart. Minor wave 3 should break above the upper edge of the base channel.
DAILY
Click chart to enlarge.
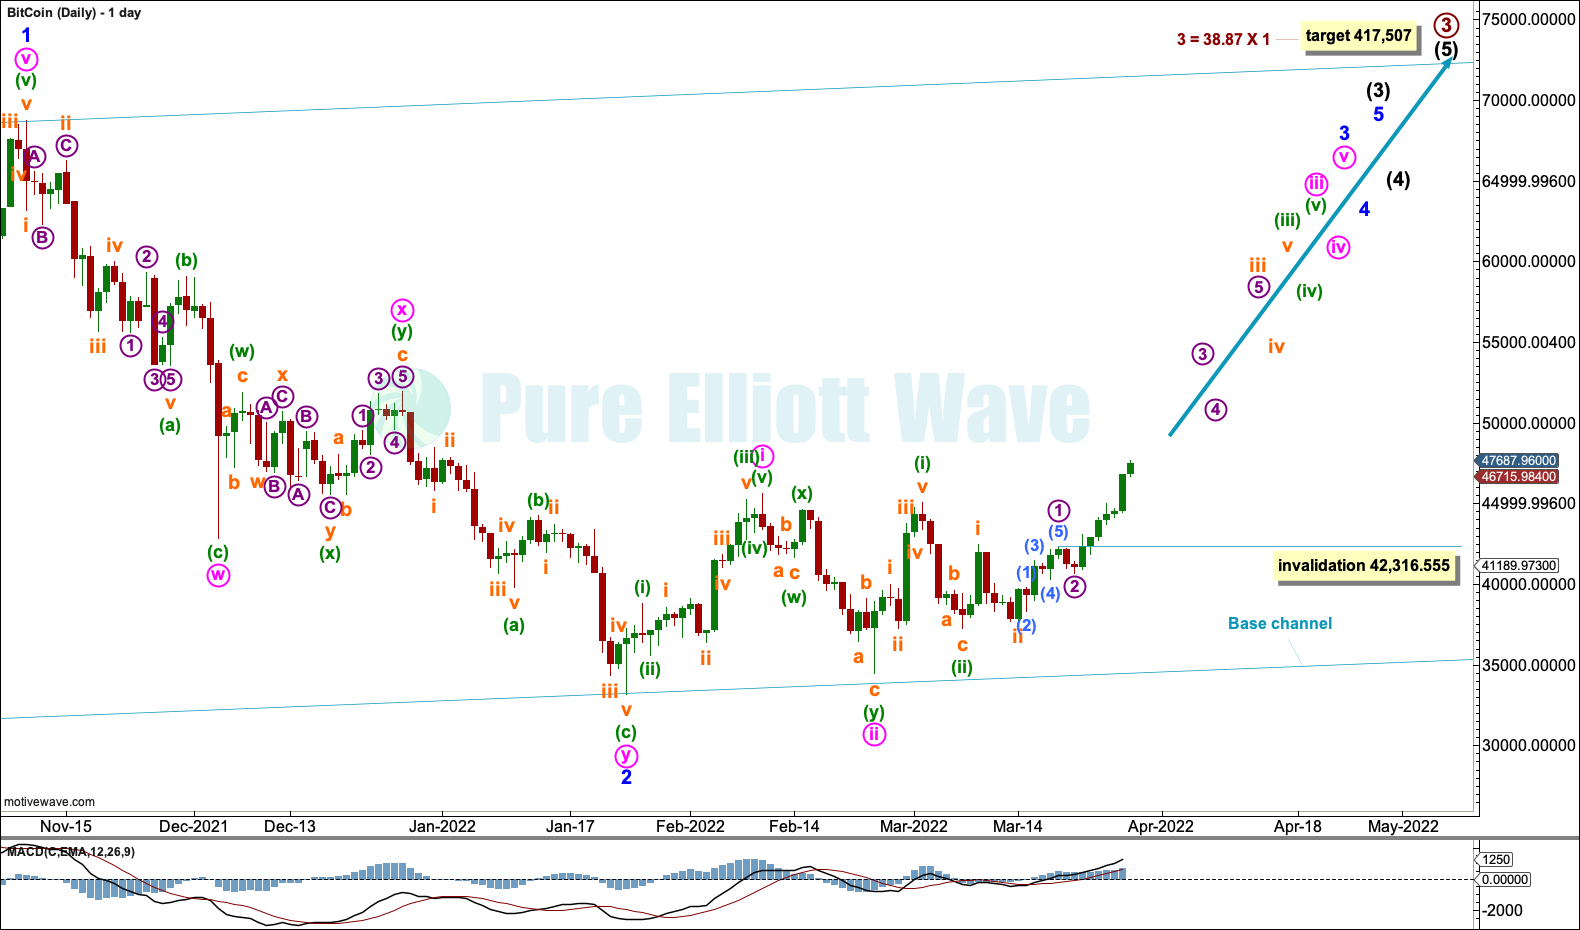
Bitcoin tends to exhibit very deep second waves. Minor wave 2 was 0.89 of minor wave 1. Now minute wave ii was 0.90 of minute wave i. This is typical behaviour for Bitcoin.
Minor wave 3 may only subdivide as an impulse.
Minute waves i and ii within minor wave 3 may be complete. Minute wave iii may be underway.
Minute wave iii may only subdivide as an impulse. Minuette waves (i) and (ii) may be complete. Minuette wave (ii) may be another typically deep second wave.
Minuette wave (iii) may only subdivide as an impulse. Subminuette waves i and ii may be complete. Subminuette wave ii may be yet another typically deep second wave. This is how Bitcoin’s new impulses start.
Subminuette wave iii may only subdivide as an impulse. Micro waves 1 and 2 within subminuette wave iii may be complete. Micro wave 3 has now moved above the end of micro wave 1, meeting a core Elliott wave rule for a third wave. Micro wave 4 may not move into micro wave 1 price territory below 42,316.555.
This wave count now expects a third wave at eight degrees (micro, subminuette, minuette, minute, minor, intermediate, primary and cycle) may be in an early stage. This is a very bullish wave count.
ALTERNATE ELLIOTT WAVE COUNT
WEEKLY
Click chart to enlarge.
This alternate wave count is presented in the spirit of always trying to consider “what if?”. What if the main wave count is wrong? What else could be happening? It is good practice to always consider alternate wave counts, to not get stuck on just one.
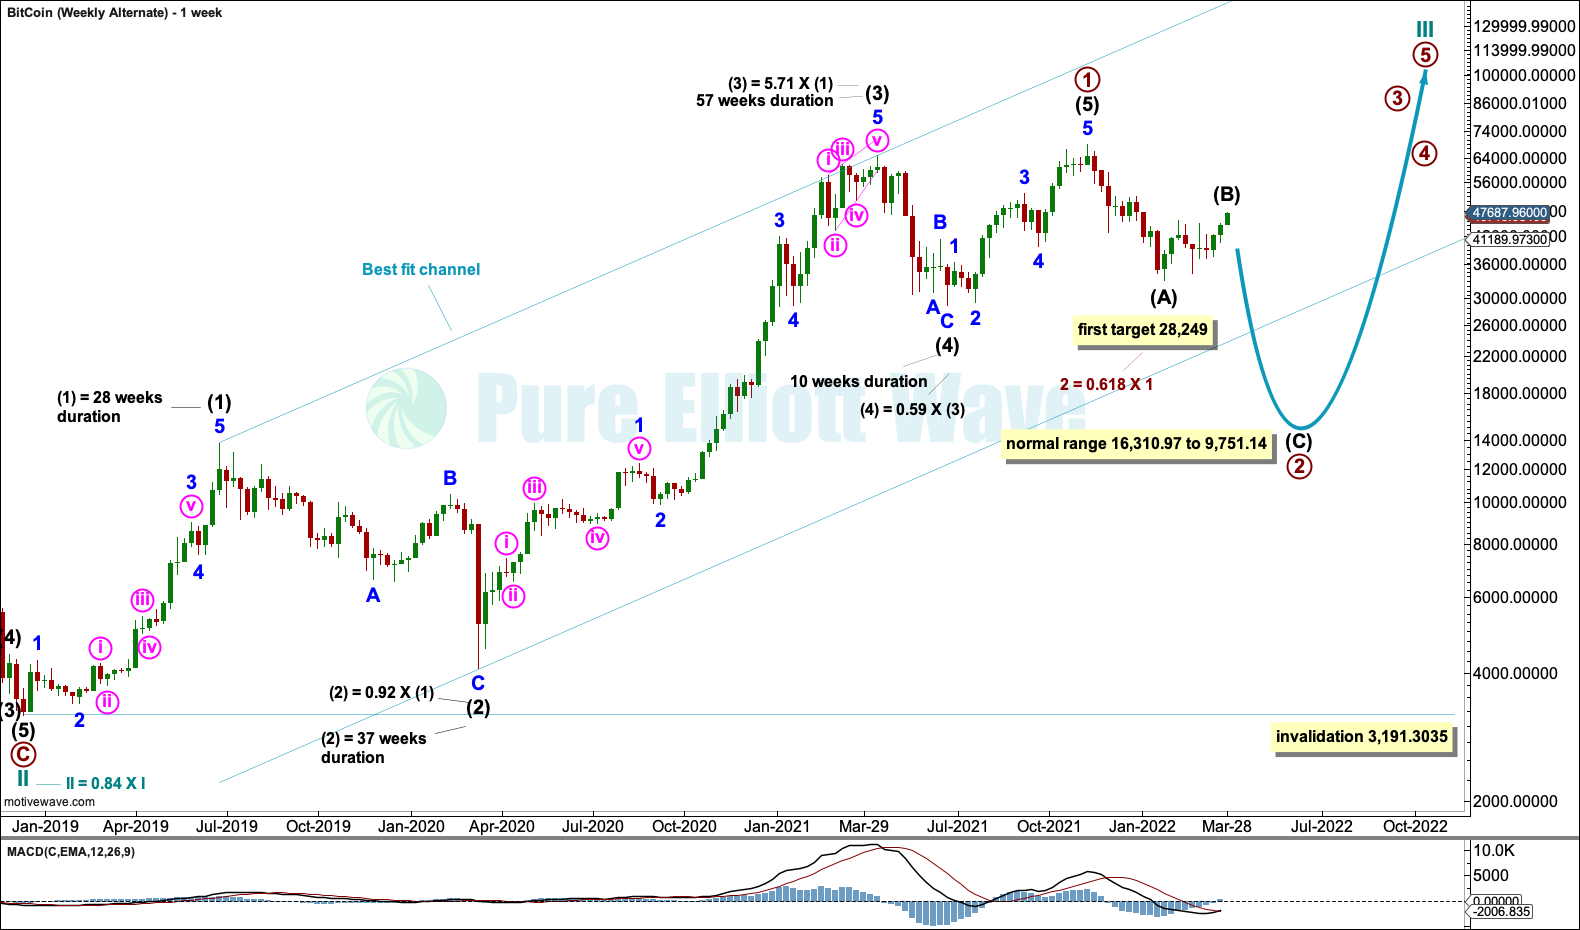
This wave count is judged to have a low probability. There is some technical evidence of a major high forming in November 2021, although not enough to judge this alternate wave count more likely than the main wave count.
It is possible that primary wave 1 may be complete.
Intermediate wave (3) within primary wave 1 is just 5.71 times the length of intermediate wave (1). For most markets this would be considered very long, but the price history of Bitcoin illustrates that for this market it is remarkably short. It is this aspect that is judged to reduce the probability of this wave count.
There is alternation in depth but not structure between intermediate waves (2) and (4). Intermediate wave (2) is a deep single zigzag with an extended minor wave A. Intermediate wave (4) is a shallow single zigzag with an extended minor wave A. The proportion between intermediate waves (2) and (4) is acceptable; they both show clearly on higher time frames.
Primary wave 2 may be very deep and may last up to a year, although it may be more brief than this and may be over within 6 months. The target for support at the 0.618 Fibonacci ratio of primary wave 1 may not be low enough; primary degree corrections for Bitcoin tend to be in the 80% to 90% range, which is from 16,310.97 to 9,751.14.
Primary wave 2 may not move beyond the start of primary wave 1 below 3,191.3035.
DAILY
Click chart to enlarge.
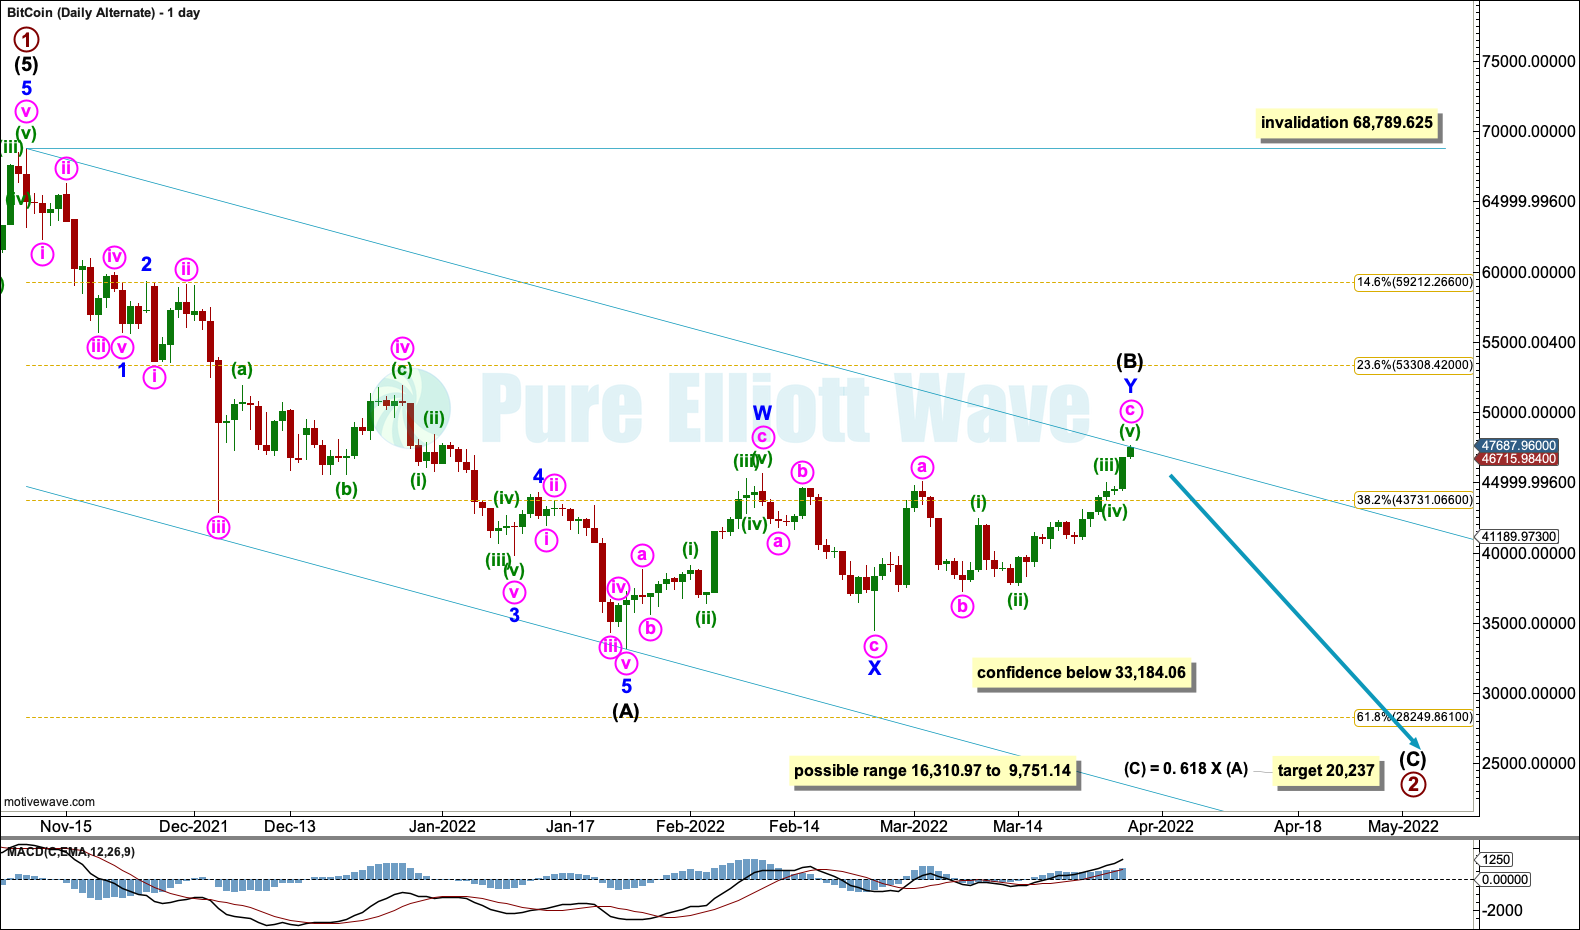
Primary wave 2 may continue lower as a single zigzag.
This wave count sees a triangle for intermediate wave (B) complete. A target is calculated for intermediate wave (C) to end primary wave 2. This would see primary wave 2 not overlap back into the price territory of cycle wave I, which ended in December 2017. Bitcoin does not tend to move back below major highs during deeper corrections. This target has a higher probability; if it is wrong, then it may be too low despite the normal zone of 80% to 90%.
Primary wave 2 may not move beyond the start of primary wave 1 below 3,191.3035.
Draw a channel about primary wave 2. Draw the first trend line from the start of intermediate wave (A) to the end of intermediate wave (B), then place a parallel copy on the end of intermediate wave (A). Look for intermediate wave (C) to find support at the lower edge of the channel. When the channel is breached by subsequent upwards movement, it may then be used to indicate a trend change.
SECOND ALTERNATE ELLIOTT WAVE COUNT
WEEKLY
Click chart to enlarge.
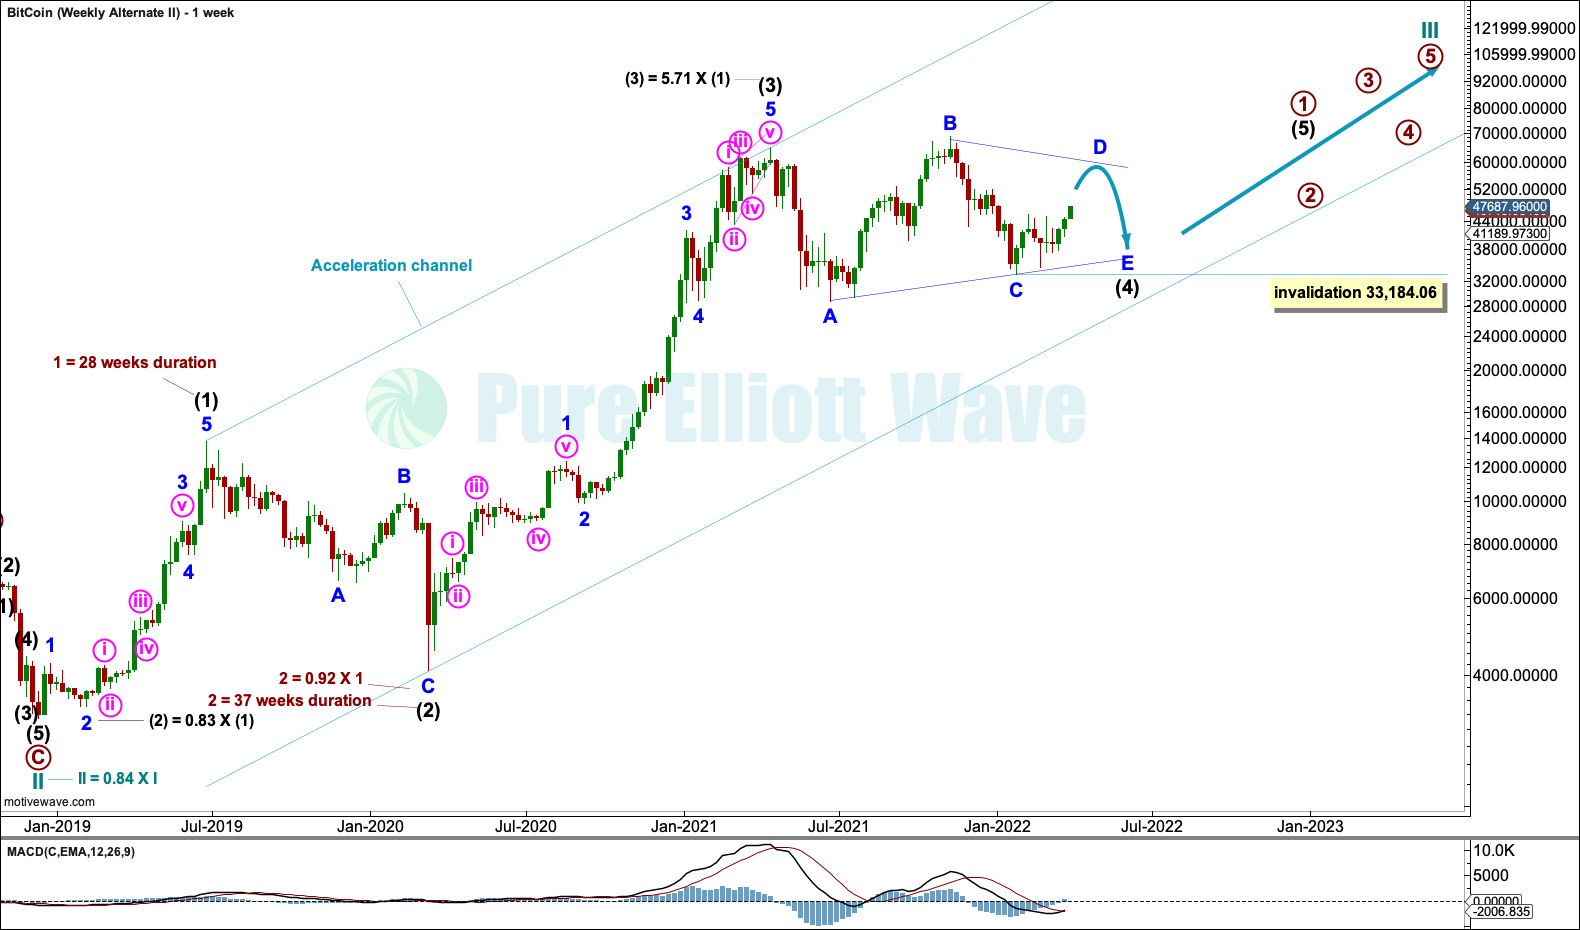
It is possible that primary wave 1 may be incomplete and that intermediate wave (4) may be completing as a triangle.
Within the triangle, minor wave E may not move beyond the end of minor wave C below 33,184.06.
If price remains above the invalidation point and continues sideways to form a triangle, then this may become the main Elliott wave count.
Within the triangle, an upwards swing for minor wave D may end below or about the same level as minor wave B at 67,657.805. Minor wave D may not move reasonably beyond the end of minor wave B at 67,657.805.
TECHNICAL ANALYSIS
WEEKLY
Click chart to enlarge.
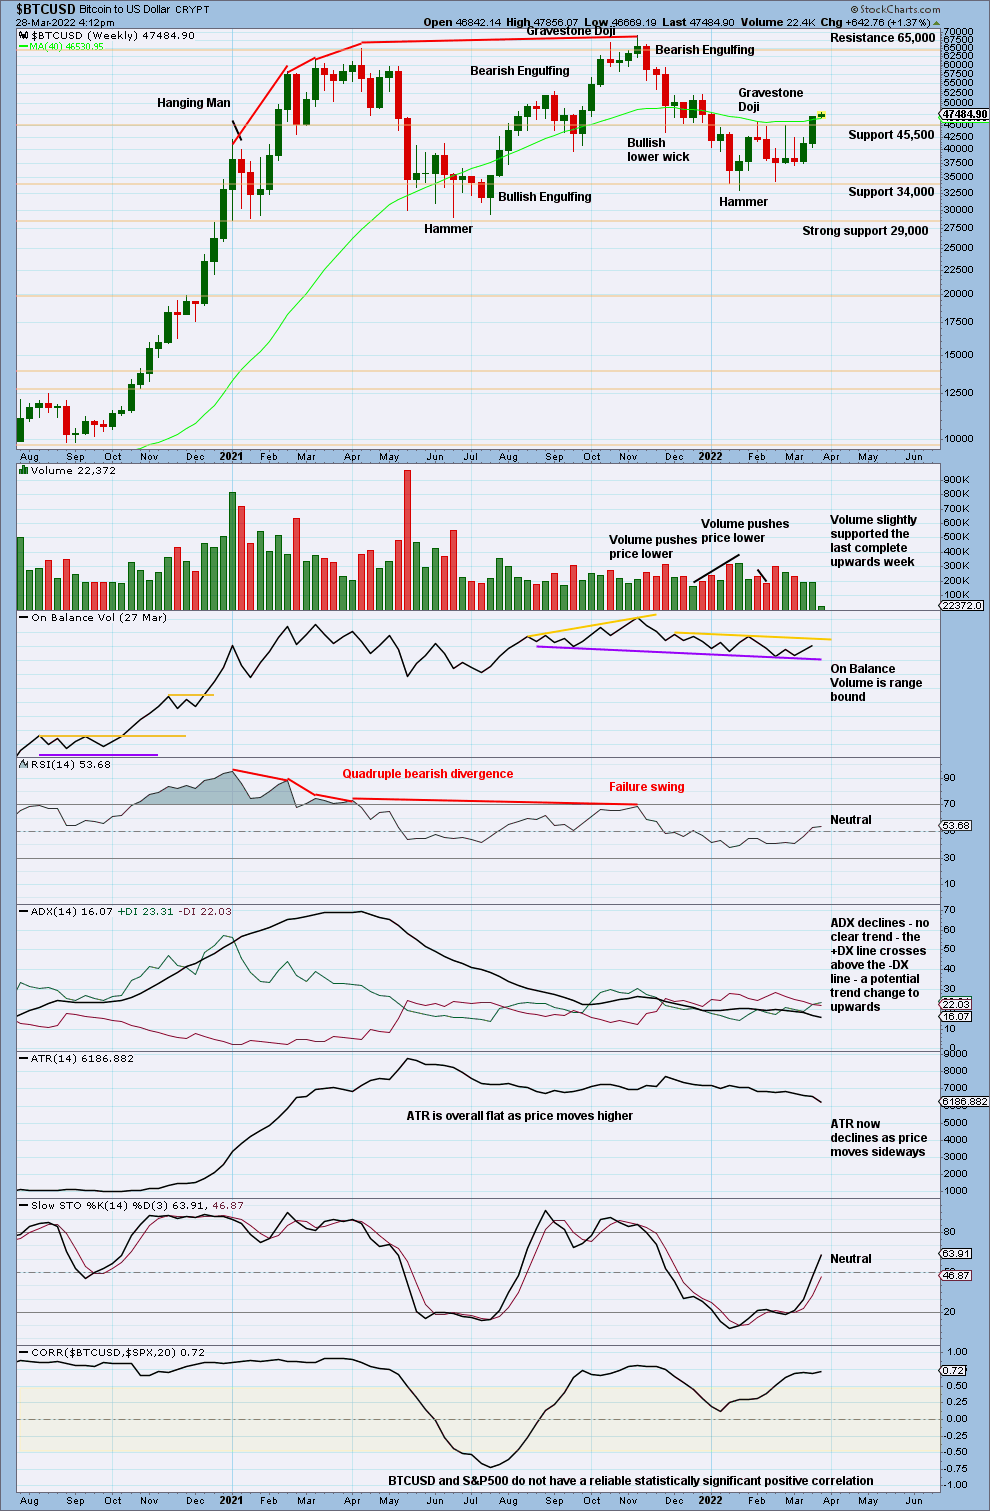
There is now a bullish candlestick pattern at the low for the week of January 24th that has some support from volume. This supports the main Elliott wave count.
This week sees an upwards breakout above resistance, which was about 45,500. The breakout has support from volume, so confidence in it may be had. Next resistance is about 50,000 to 51,000 (shown on the daily chart below) and after that the prior all time high about 65,000.
DAILY
Click chart to enlarge.
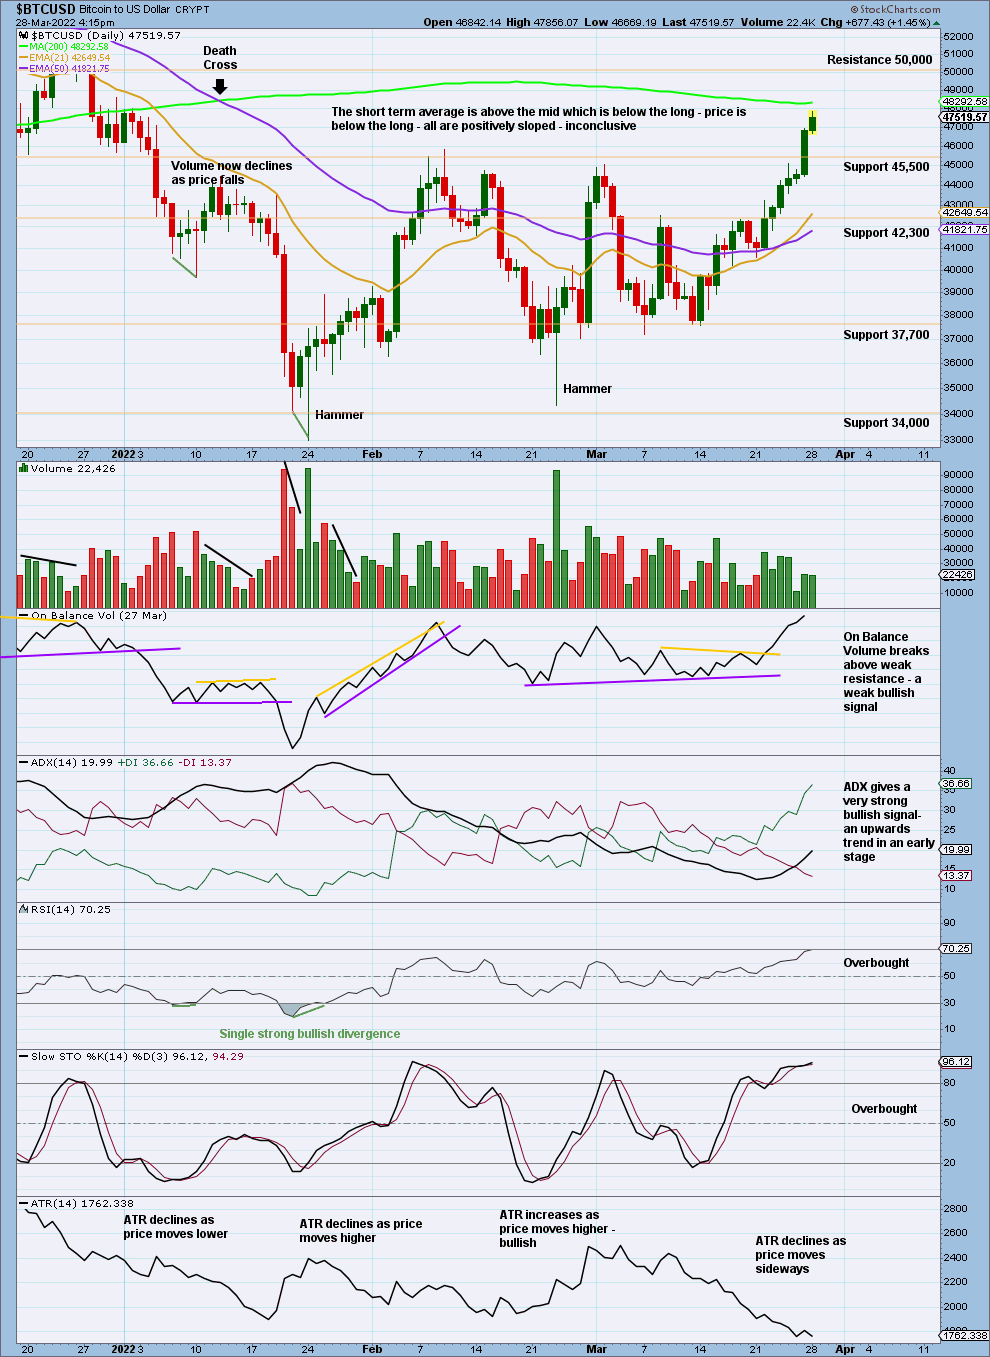
Bitcoin’s lows are much harder to identify than its highs.
There is now a bullish candlestick pattern at the daily chart level as well as the weekly chart level, at the low for January 24, 2022. Both have support from volume. At the daily chart level, this comes after some bullish divergence between price and RSI.
Another Hammer candlestick for February 24th supports the main Elliott wave count.
The upwards breakout on March 27th has support from volume compared to the session immediately prior, although overall there is a little decline in volume as price rises. This is a feature of the early stages of prior strong bullish runs for Bitcoin, so it is not of a concern. ADX gives a very strong bullish signal. RSI is just now overbought, but it may reach more deeply overbought and remain there while price travels a considerable distance, so this is not of a concern. This chart has the look of an early stage of a strong bull run for this market and is what the Elliott wave analysis expects.
Published @ 07:43 p.m. ET.
—
Careful risk management protects your investments.
Follow my two Golden Rules:
1. Invest only funds you can afford to lose.
2. Have an exit plan for both directions – where or when to take profit, and when to exit a losing investment.
—
New updates to this analysis are in bold.
—
 Save as PDF