July 2, 2022: MSTR (MicroStrategy Inc.) Technical Analysis – Charts
Price is consolidating.
Summary: There is some evidence of a possible low with bullish divergence, but an upwards breakout above 265 is required for confidence.
TECHNICAL ANALYSIS
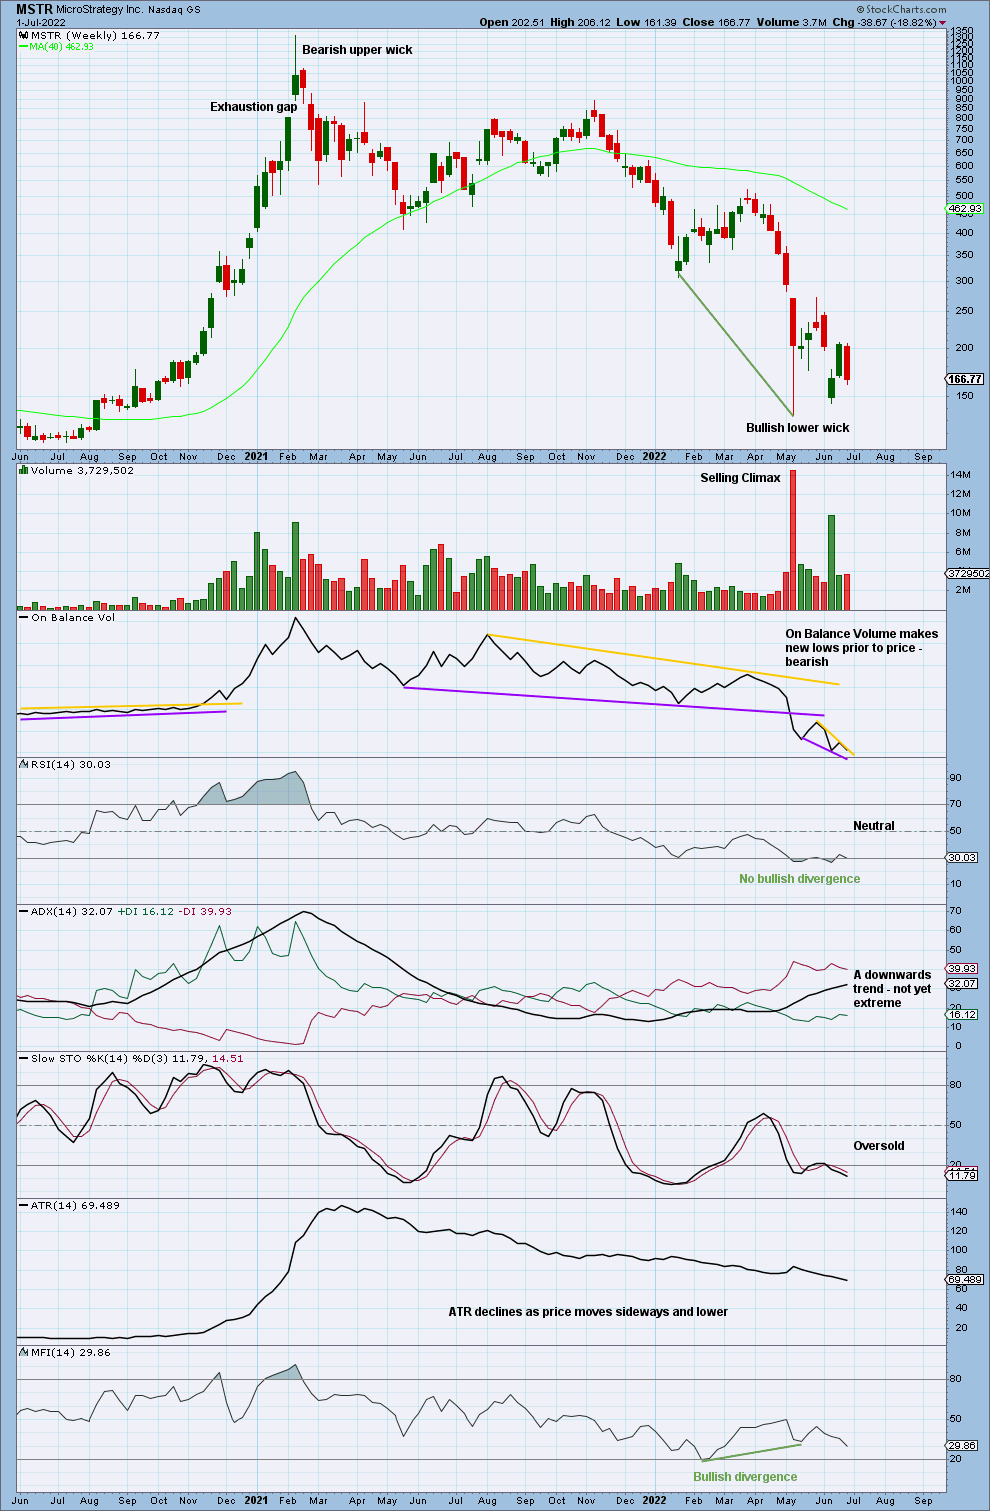
WEEKLY CHART
Click chart to enlarge. Chart courtesy of StockCharts.com.
There is some bullish divergence between price and Money Flow after RSI reached oversold. But there is no bullish candlestick pattern and no push from volume for upwards movement.
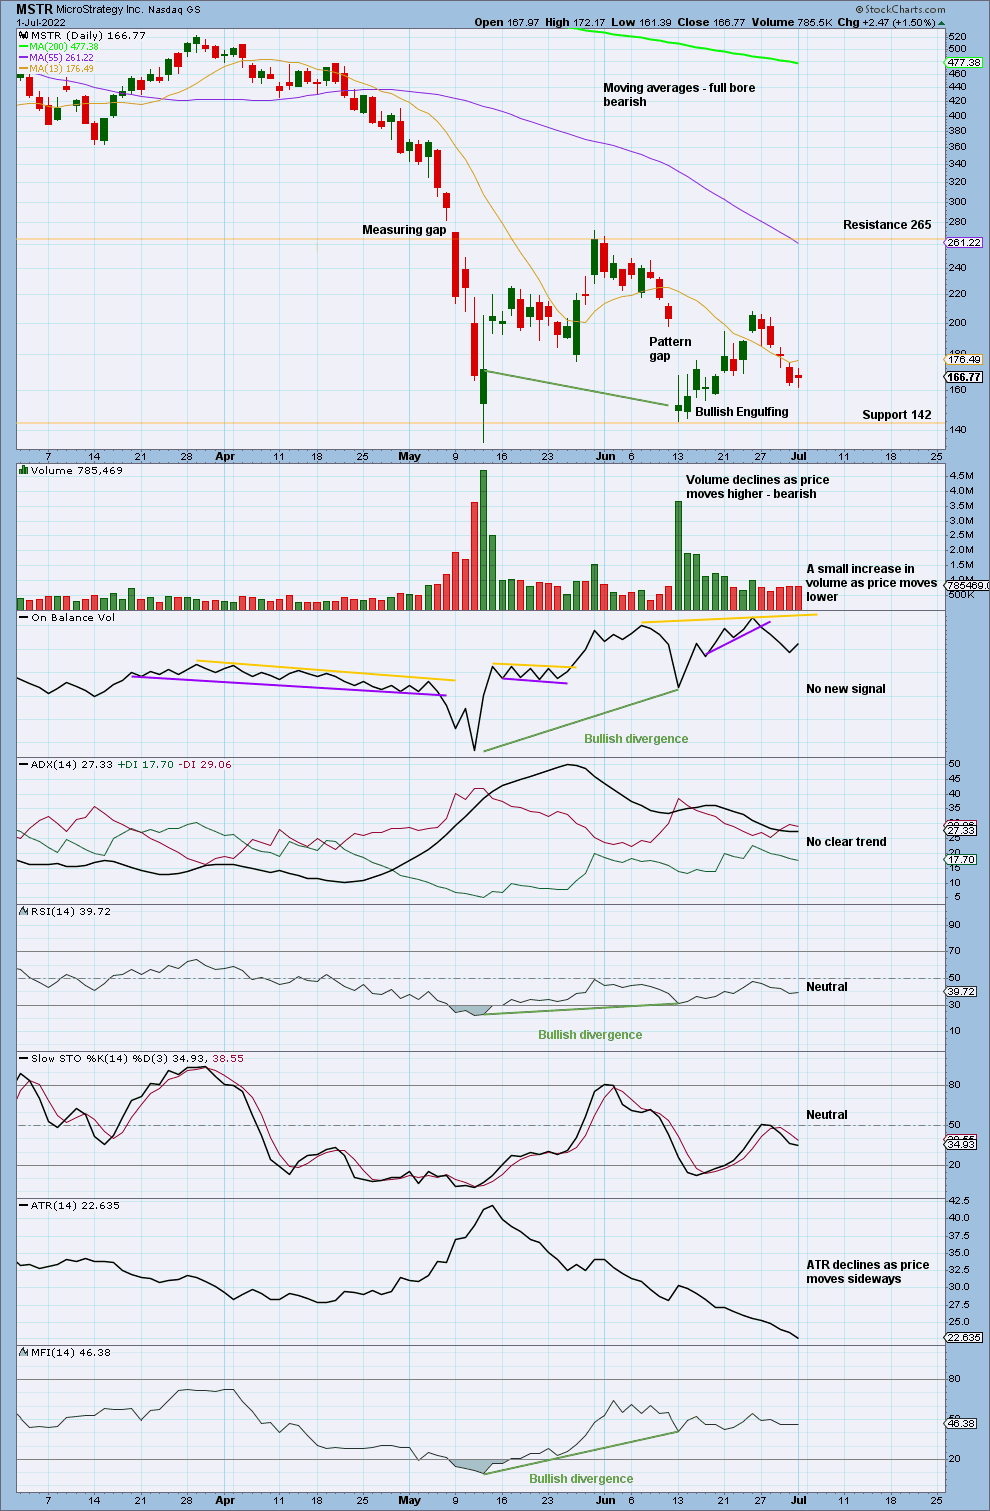
DAILY CHART
Click chart to enlarge. Chart courtesy of StockCharts.com.
Price is consolidating with resistance about 265 and support about 142. Currently, price is close to the middle of this zone and Stochastics is neutral and close to 50. It is not clear if an upwards or downwards swing is underway. A breakout from this consolidation is required for confidence in the direction of the next trend.
Published @ 04:20 p.m. ET.
—
Careful risk management protects your investment account(s).
Follow my two Golden Rules:
1. Invest only funds you are prepared to lose entirely.
2. Always have an exit strategy for both directions; when or where to take profit on a winning investment, and when or where to close a losing investment.
—
New updates to this analysis are in bold.
—
 Save as PDF