July 19, 2022: WNDW (SolarWindow Technologies) Technical Analysis – Charts
It is possible that a sustainable low may be in, but a bullish view would require a break above a resistance line on the weekly chart.
Summary: A pennant pattern may be completing on the daily chart. If there is an upwards breakout from this pattern, then a target would be about 4.66.
TECHNICAL ANALYSIS
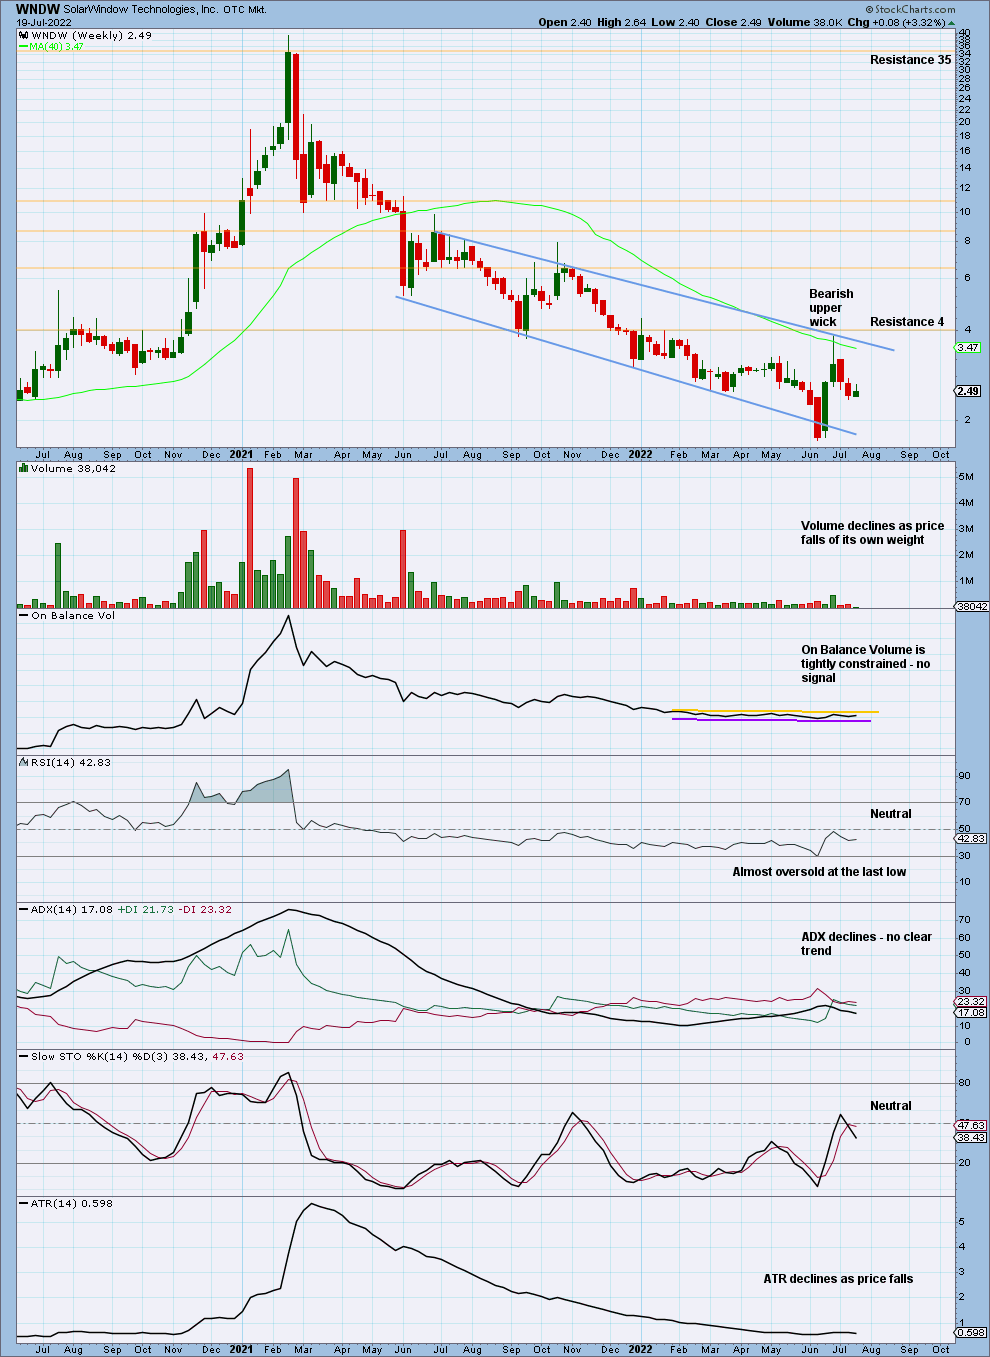
WEEKLY CHART
Click chart to enlarge.
While ADX is declining, there may still be a downwards trend in place, which would not be extreme.
The bounce of the last few weeks may be a countertrend movement. A breach of the downwards sloping resistance line would increase the probability of a trend change to bullish.
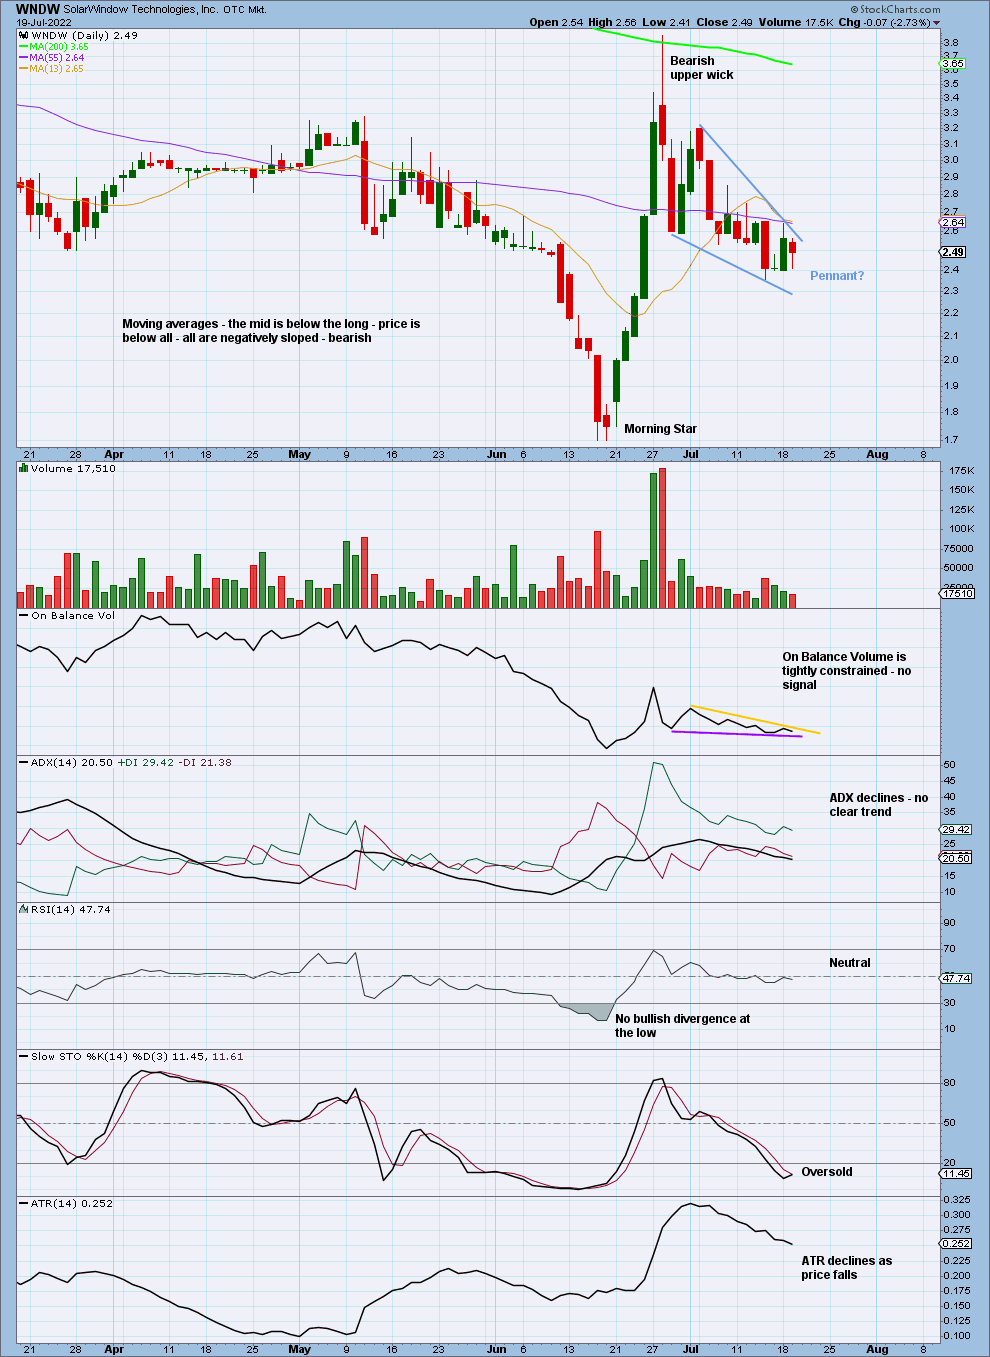
DAILY CHART
Click chart to enlarge.
For the short term, a pennant pattern may be completing. An upwards breakout would be required for confidence in this pattern. A target would be about 4.66.
On Balance Volume may break out first, which would provide a signal. If On Balance Volume breaks out with price, then it would provide confirmation.
Published @ 12:15 a.m. ET on July 20, 2022.
—
Careful risk management protects your trading account(s).
Follow my two Golden Rules:
1. Always trade with stops.
2. Risk only 1-5% of equity on any one trade.
—
New updates to this analysis are in bold.
—
 Save as PDF