August 7, 2022: ETH-USD (Ethereum) Elliott Wave and Technical Analysis – Video and Charts
Summary: It is possible that a low may now be in place for Ethereum. A third wave at primary and cycle degrees may have just begun. Confidence may be had now with a breach of the channel on the main daily chart and a new high above 1,746.5098. Further very strong confidence would come if price makes a new high above 3,573.96.
A possible target for primary wave 3 is calculated at 54,226.
Alternatively, if price makes a new low below 896.109, then a target for support is calculated now at 860.
The data used for this analysis comes from Yahoo Finance ETH-USD.
All charts are on a semi-log scale.
MAIN ELLIOTT WAVE COUNT
MONTHLY
Click chart to enlarge.
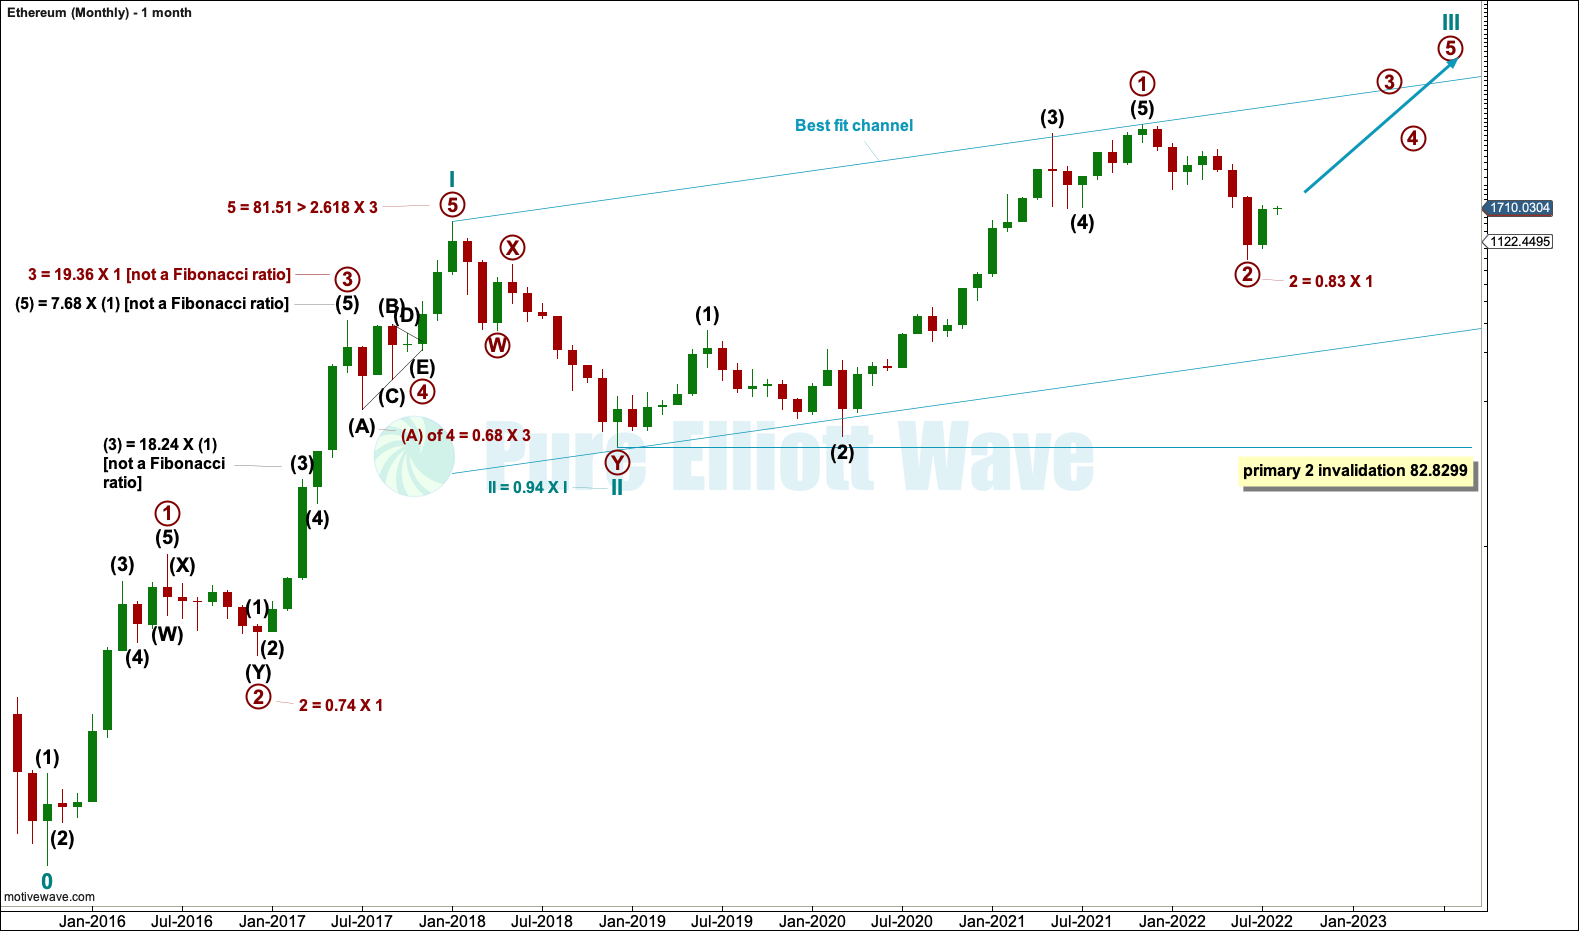
The monthly chart looks at the entire price history of Ethereum. The Elliott wave count begins at the low of October 2015.
From October 2015 to December 2017 this upwards wave subdivides perfectly as an Elliott wave impulse, labelled cycle wave I. The impulse lasted just over two years, which is within the expected duration for a cycle degree wave, so confidence that this degree of labelling is correct may be had.
Within cycle wave I, note that wave lengths noted on the chart are not Fibonacci ratios but guides to expected behaviour for Ethereum. Prior Ethereum price history exhibits very long third waves and fifth waves which are longer than third waves.
The depth of primary wave 2 and the deepest part of primary wave 4 within cycle wave I are also noted. Ethereum has had deep corrections, but not as deep as other cryptocurrencies, within cycle wave I.
Within cycle wave III, primary wave 2 may not move beyond the start of primary wave 1 below 82.8299. If primary wave 2 within cycle wave III is over at the last low, then it would be 0.83 of primary wave 1. This is a normal to be expected depth.
Cycle wave III may only subdivide as an impulse. It must move far enough above the end of cycle wave I to allow room for cycle wave IV to unfold and remain above cycle wave I price territory.
WEEKLY
Click chart to enlarge.
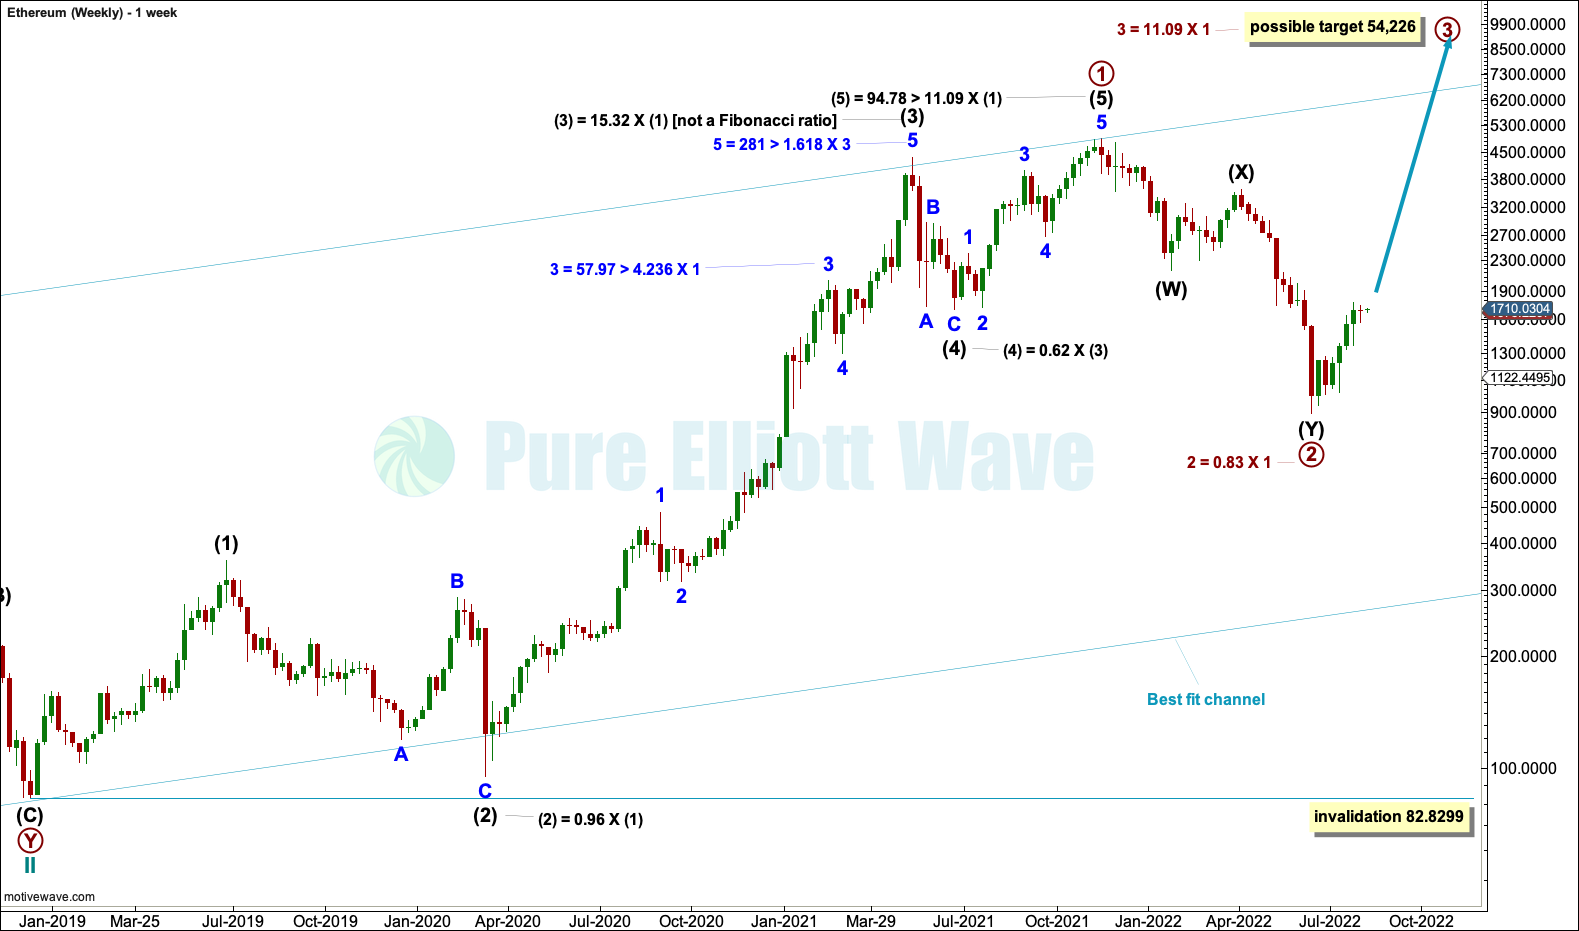
Ethereum does exhibit Fibonacci ratios between its actionary waves; they tend to be extreme Fibonacci ratios. Within primary wave 1, the ratios are noted on the chart.
The structure of primary wave 1 may be complete. Primary wave 2 may be a complete double zigzag. The second zigzag labelled intermediate wave (Y) is analysed on daily charts below.
*How to read the notations: For example, for minor wave 3 within intermediate wave (3) the notation “3 = 57.97 > 4.236 X 1” is read as minor wave 3 was 57.97 longer than 4.236 the length of minor wave 1.
DAILY
Click chart to enlarge.
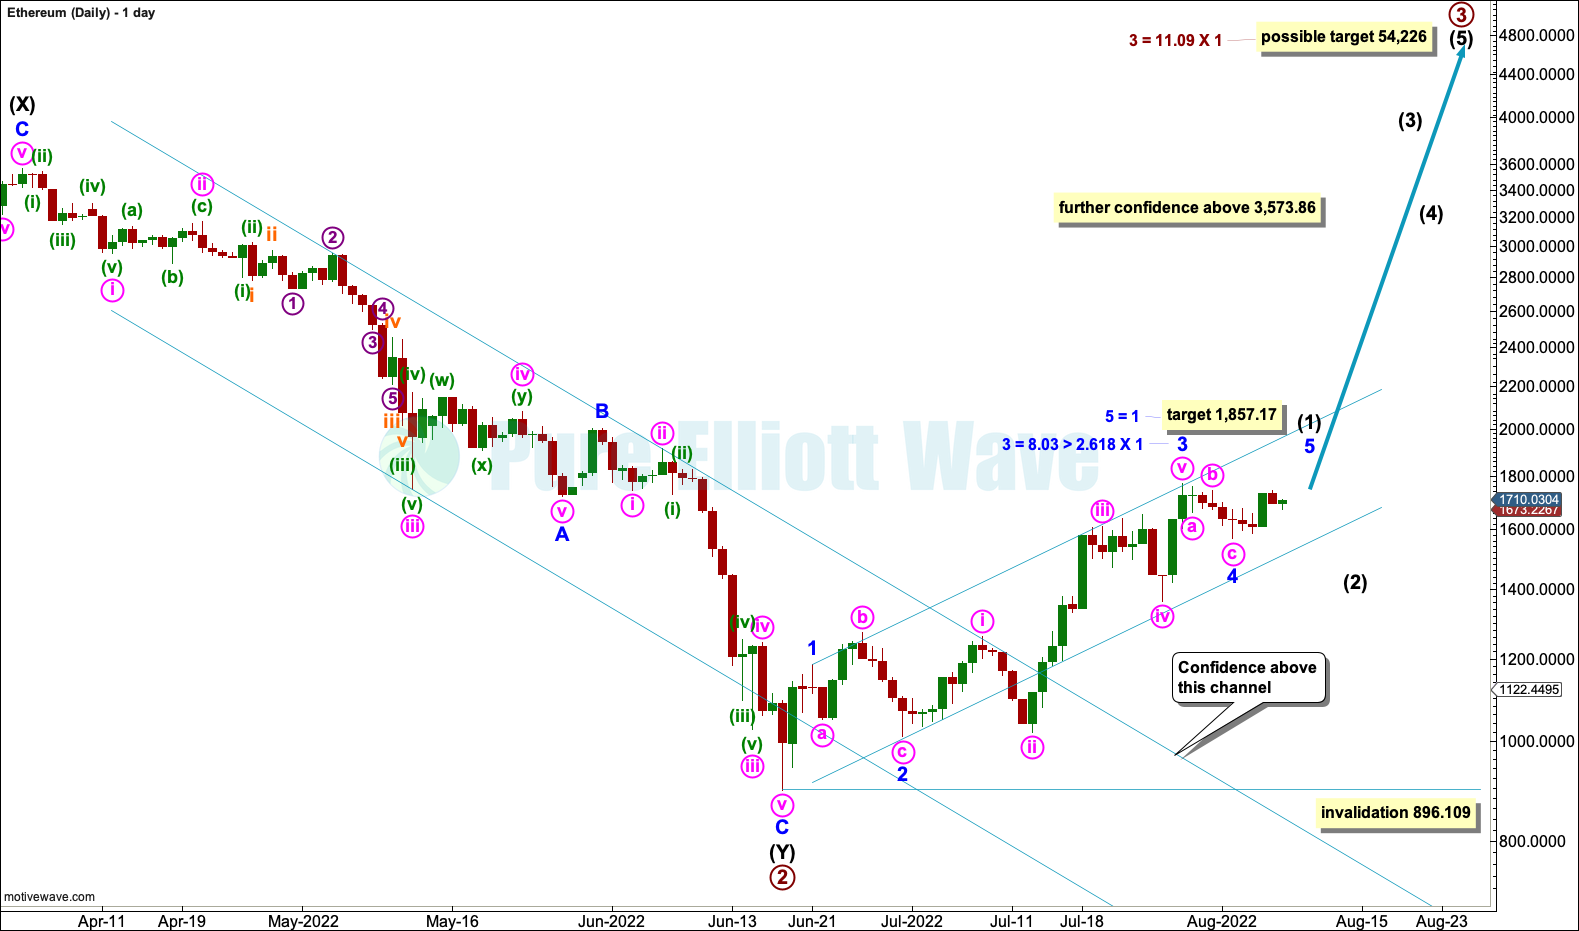
It is possible that intermediate wave (Y) may be complete.
The channel drawn about intermediate wave (Y) is a best fit channel drawn to contain as much of intermediate wave (Y) as possible. The breach of this channel may be used as an indication of a trend change. A new high above 1,746.5098 has invalidated the alternate daily chart in last analysis and adds further confidence to this main wave count.
A channel is drawn about new upwards movement using Elliott’s technique. Draw the first trend line from the end of minor wave 1 to the end of minor wave 3, then place a parallel copy on the low of minor wave 2. This channel contains most of intermediate wave (1) so far, including the end of minor wave 4, and it may show where minor wave 5 may end at resistance at the upper edge. A subsequent breach of the channel in the opposite direction may then be used as an indication of a trend change.
Intermediate wave (1) may be nearing an end. When intermediate wave (1) may be over, then another deep pullback for intermediate wave (2) may begin. Intermediate wave (2) may last a few weeks and may not move beyond the start of intermediate wave (1) below 896.109.
DAILY ALTERNATE
Click chart to enlarge.
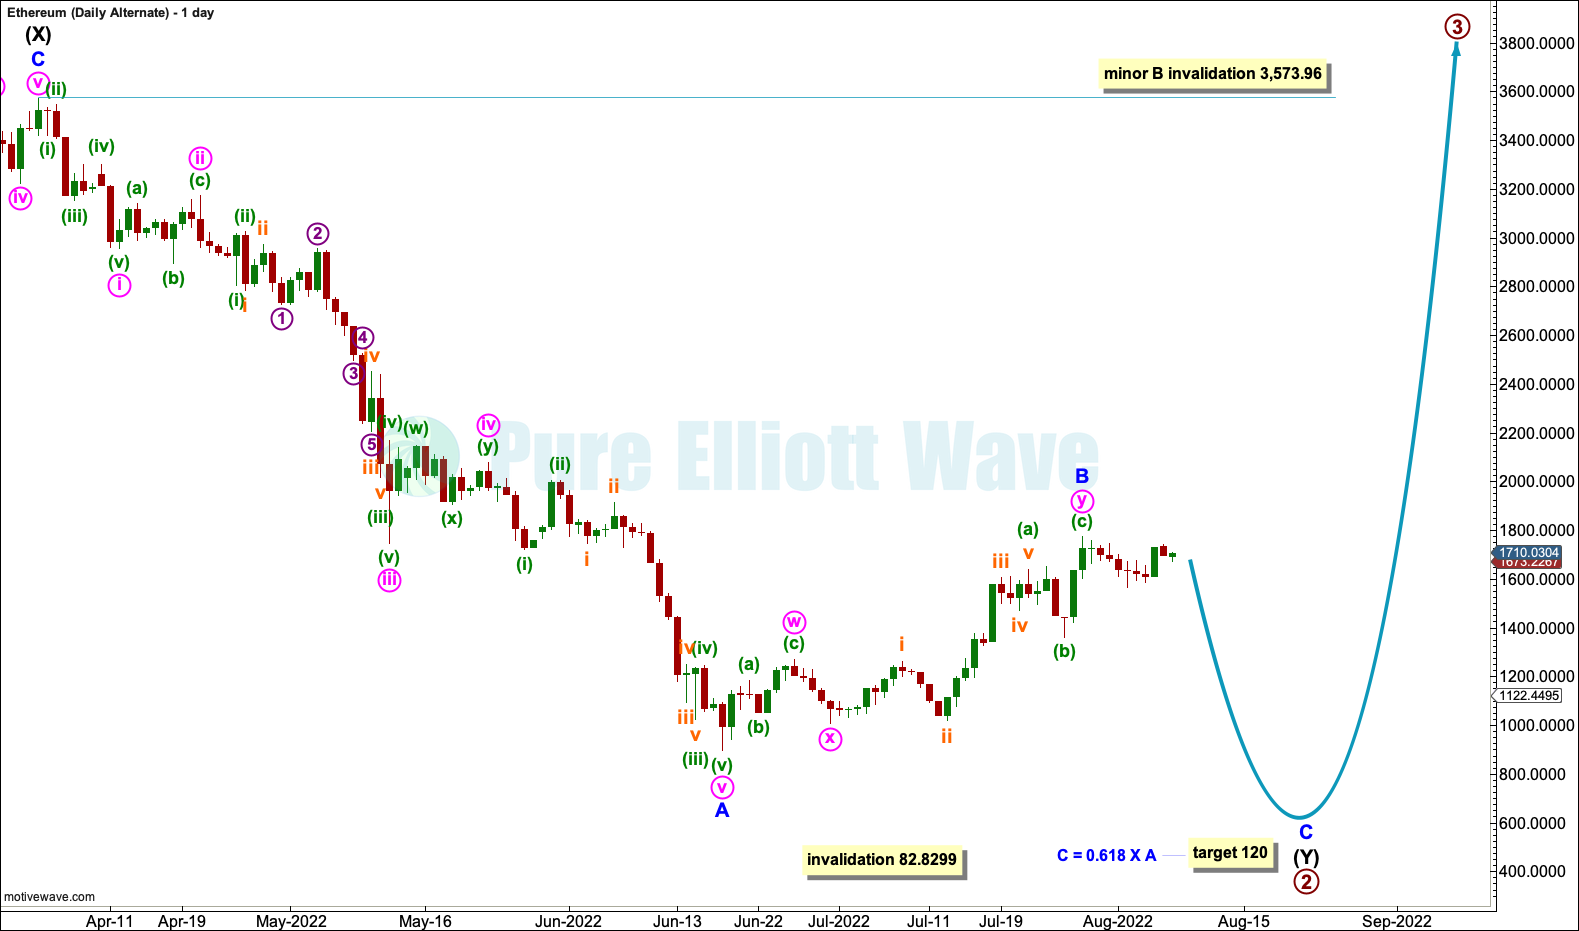
This wave count is new.
It is also possible that primary wave 2 may be incomplete. Intermediate wave (Y) may be an incomplete zigzag with only minor waves A and B complete. A target is calculated for minor wave C. Within intermediate wave (Y), if minor wave B continues higher, then it may not move beyond the start of minor wave A above 3,573.96.
Primary wave 2 may not move beyond the start of primary wave 1 below 82.8299.
WEEKLY ALTERNATE
Click chart to enlarge.
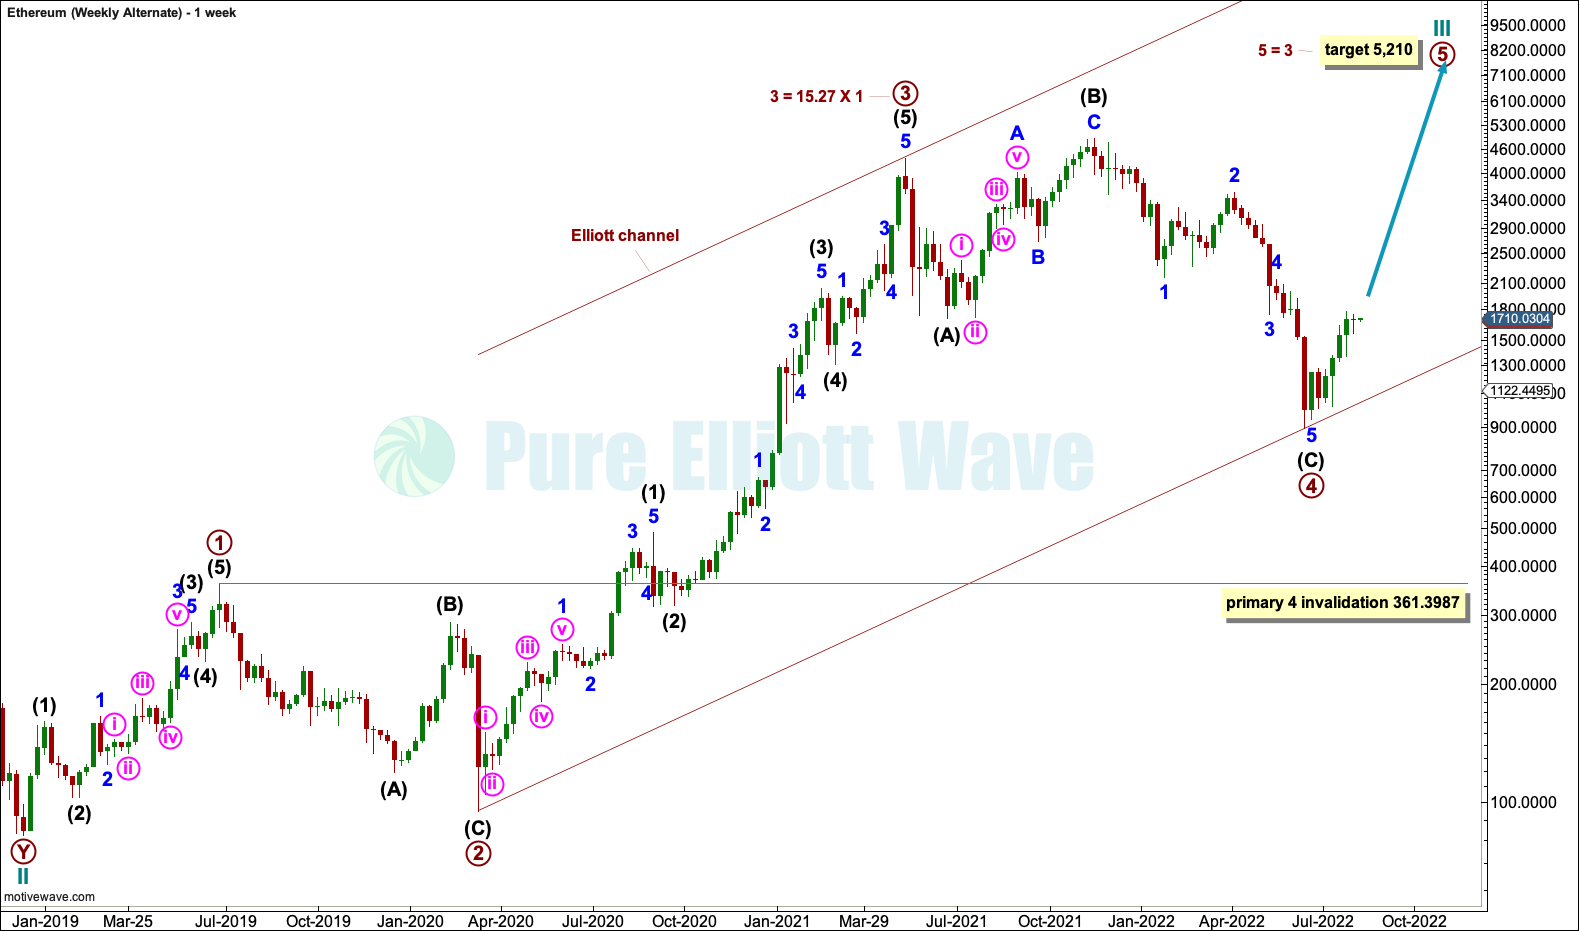
Primary waves 1, 2, 3 and 4 within the impulse of cycle wave III may be complete.
Primary wave 2 was a deep 0.95 zigzag, lasting 37 weeks. Primary wave 4 may be a complete expanded flat, lasting 58 weeks.
It is common to see fourth waves within commodities and cryptocurrencies that are more brief than their counterpart second waves. Here, primary wave 4 is longer lasting than primary wave 2; this reduces the probability of this wave count to an alternate.
TECHNICAL ANALYSIS
WEEKLY
Click chart to enlarge.
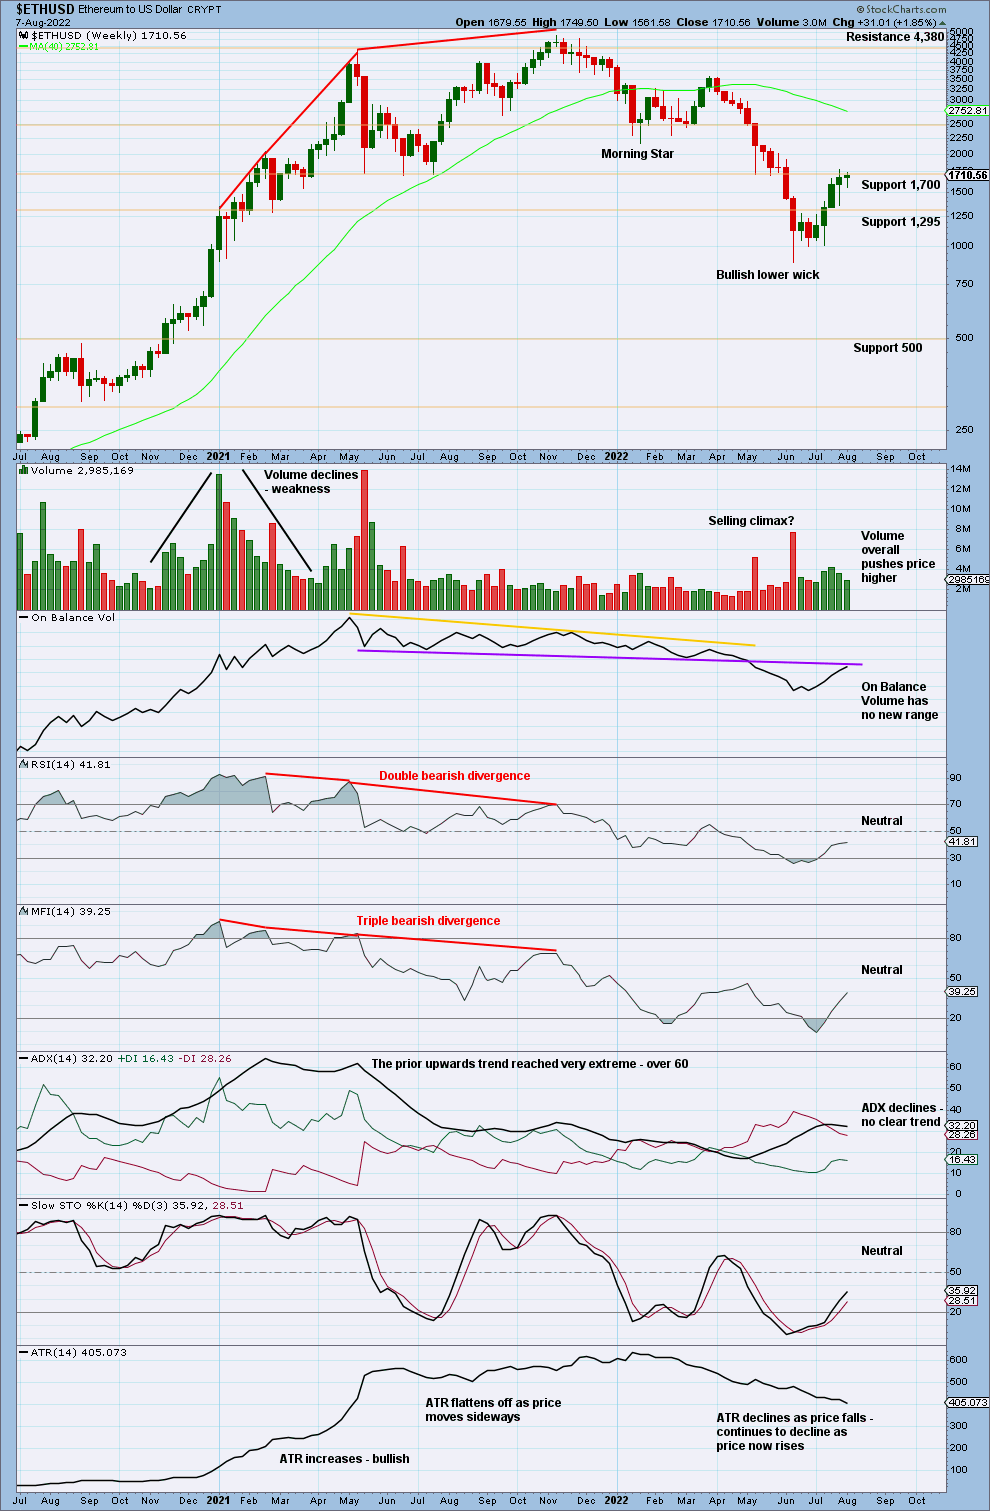
RSI reached oversold on the weekly chart at the last low. This has only happened once before, in December 2018, which was a sustainable low.
Upwards movement now has some support from volume.
DAILY
Click chart to enlarge.
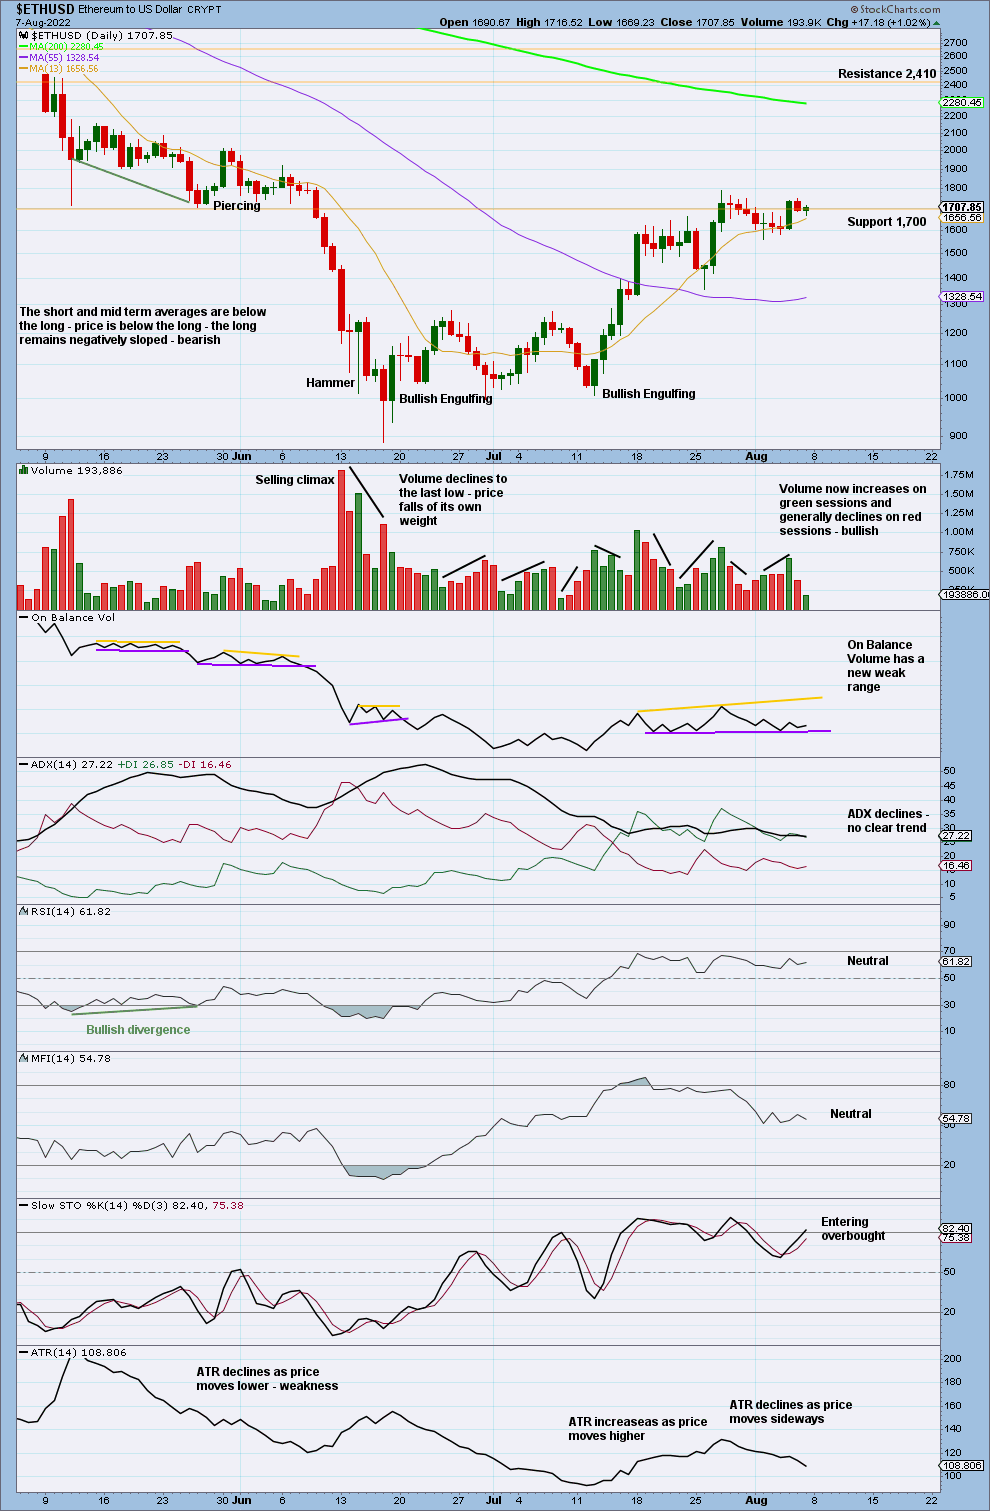
The strongest bullish candlestick reversal pattern is a Bullish Engulfing pattern. Ethereum has formed a Bullish Engulfing pattern at the low in the context of a very extreme trend and oversold RSI. This is a strong suggestion that this low may be sustainable. The only cause for concern in this picture is the Bullish Engulfing pattern lacks support from volume.
The short-term volume profile is now bullish.
Upwards movement also has strength in increasing range.
Published @ 03:03 p.m. ET.
—
Careful risk management protects your investments.
Follow my two Golden Rules:
1. Invest only funds you can afford to lose.
2. Have an exit plan for both directions – where or when to take profit, and when to exit a losing investment.
—
New updates to this analysis are in bold.
–