August 1, 2022: HUT (Hut 8 Mining Corp.) Technical Analysis – Charts
Summary: HUT may have formed a sustainable low in July 2022.
TECHNICAL ANALYSIS
WEEKLY CHART

Click chart to enlarge. Chart courtesy of StockCharts.com.
After ADX indicated a downwards trend, RSI reached oversold. There, a bullish candlestick pattern has formed that has support from volume. With volume continuing to strongly push price higher, this looks more like the start of a new bullish trend than a bounce within an ongoing bear market. However, it must be noted that this has happened before during January 2022 and yet the bear market continued. This time there is a longer run of bullish weekly candlesticks that have greater support from volume.
DAILY CHART
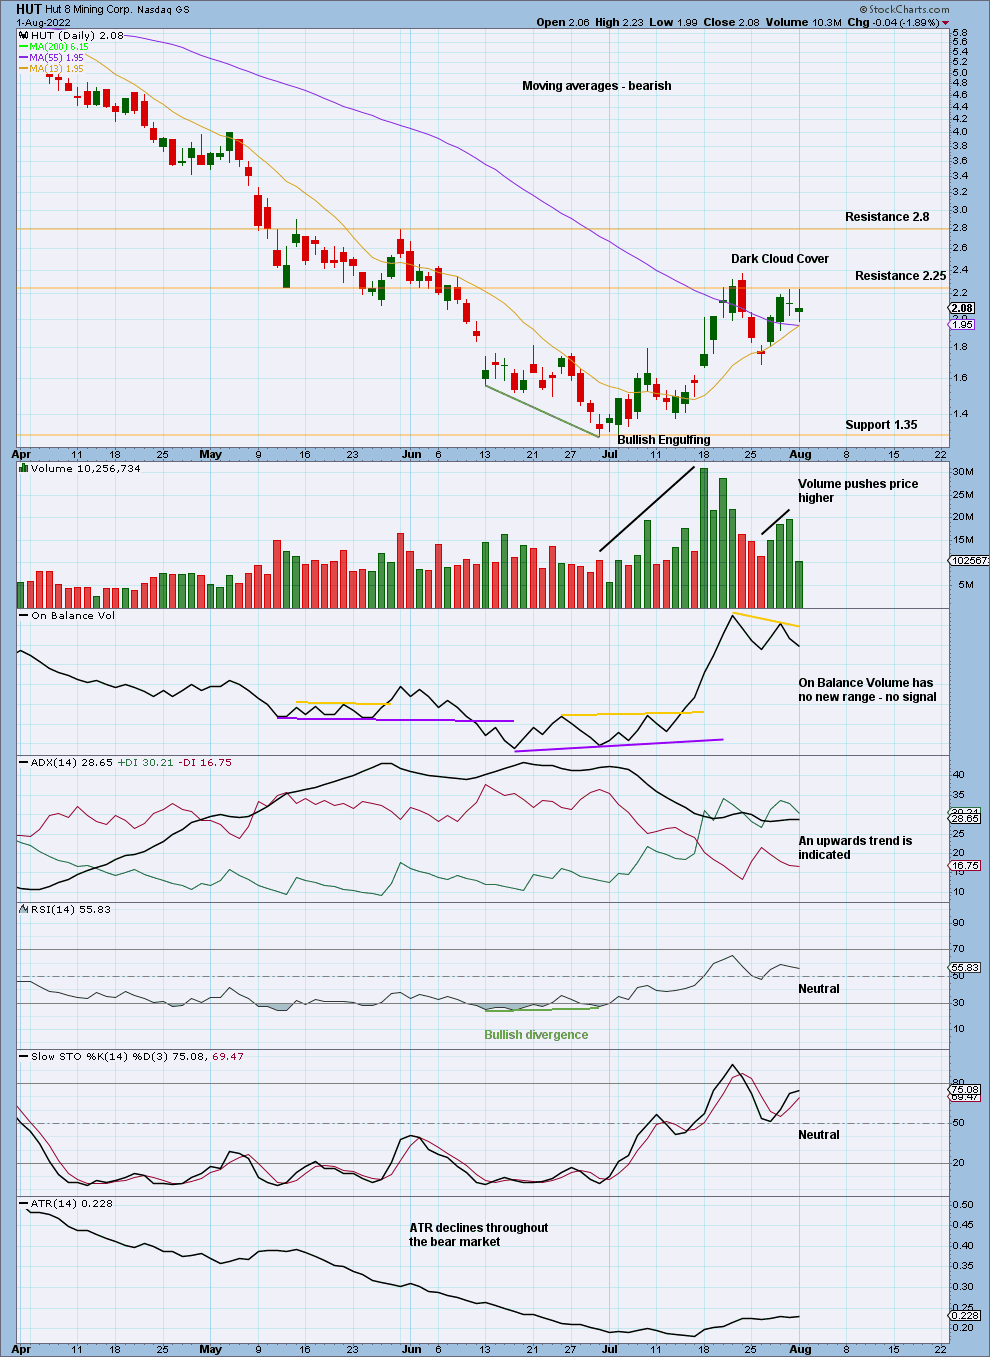
Click chart to enlarge. Chart courtesy of StockCharts.com.
The prior downwards trend reached very extreme. RSI reached oversold and exhibited bullish divergence. In this context a bullish candlestick pattern has formed on the daily chart, so it should be given weight.
Published @ 05:02 p.m. ET.
—
Careful risk management protects your trading account(s).
Follow my two Golden Rules:
1. Invest only funds you can afford to lose.
2. Have an exit strategy for both directions; when to take profit and when to exit a losing investment.
 Save as PDF