August 30, 2022: Natural Gas Elliott Wave and Technical Analysis – Video and Charts
Summary: There is an upwards trend in place, but this is extreme at the weekly chart level. This trend is vulnerable to change.
Assume the trend remains the same, until proven otherwise. It would be safest to assume the upwards trend may continue while price remains above 7.542.
A new low below 7.542 would indicate a trend change. At that stage, a target for downwards movement would be at 3.011.
MONTHLY
Click chart to enlarge.
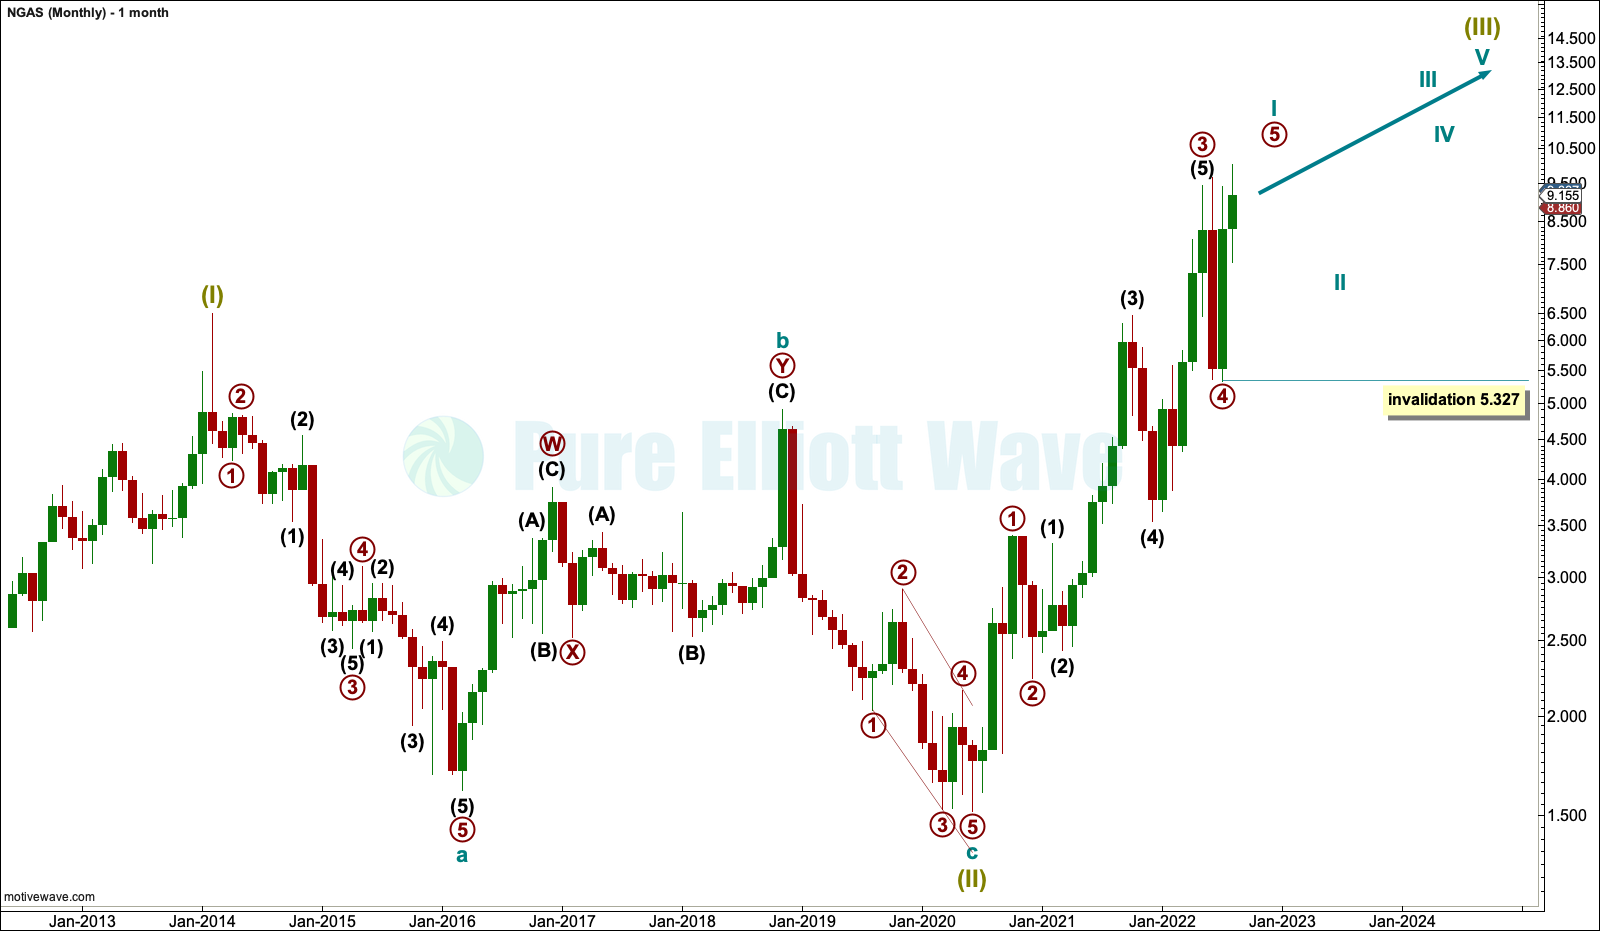
Data from FXCM for Natural Gas begins in June 2012.
An impulse higher ending in February 2014 is labelled as a potential first wave. The following bear market subdivides as a zigzag and is labelled as a complete second wave at Super Cycle degree.
A third wave up at Super Cycle degree may have begun. Within the third wave, cycle wave I may be either nearing an end (main wave count) or may already be over (alternate wave count).
MAIN ELLIOTT WAVE COUNT
WEEKLY

Click chart to enlarge.
It is always safest to assume that the trend remains the same, until proven otherwise. For this reason, this is the main wave count which expects the existing upwards trend may continue.
Within cycle wave I: Primary waves 1 through to 4 may be complete and primary wave 5 may be underway.
Within primary wave 5, no second wave correction may move beyond its start below 5.327.
DAILY
Click chart to enlarge.
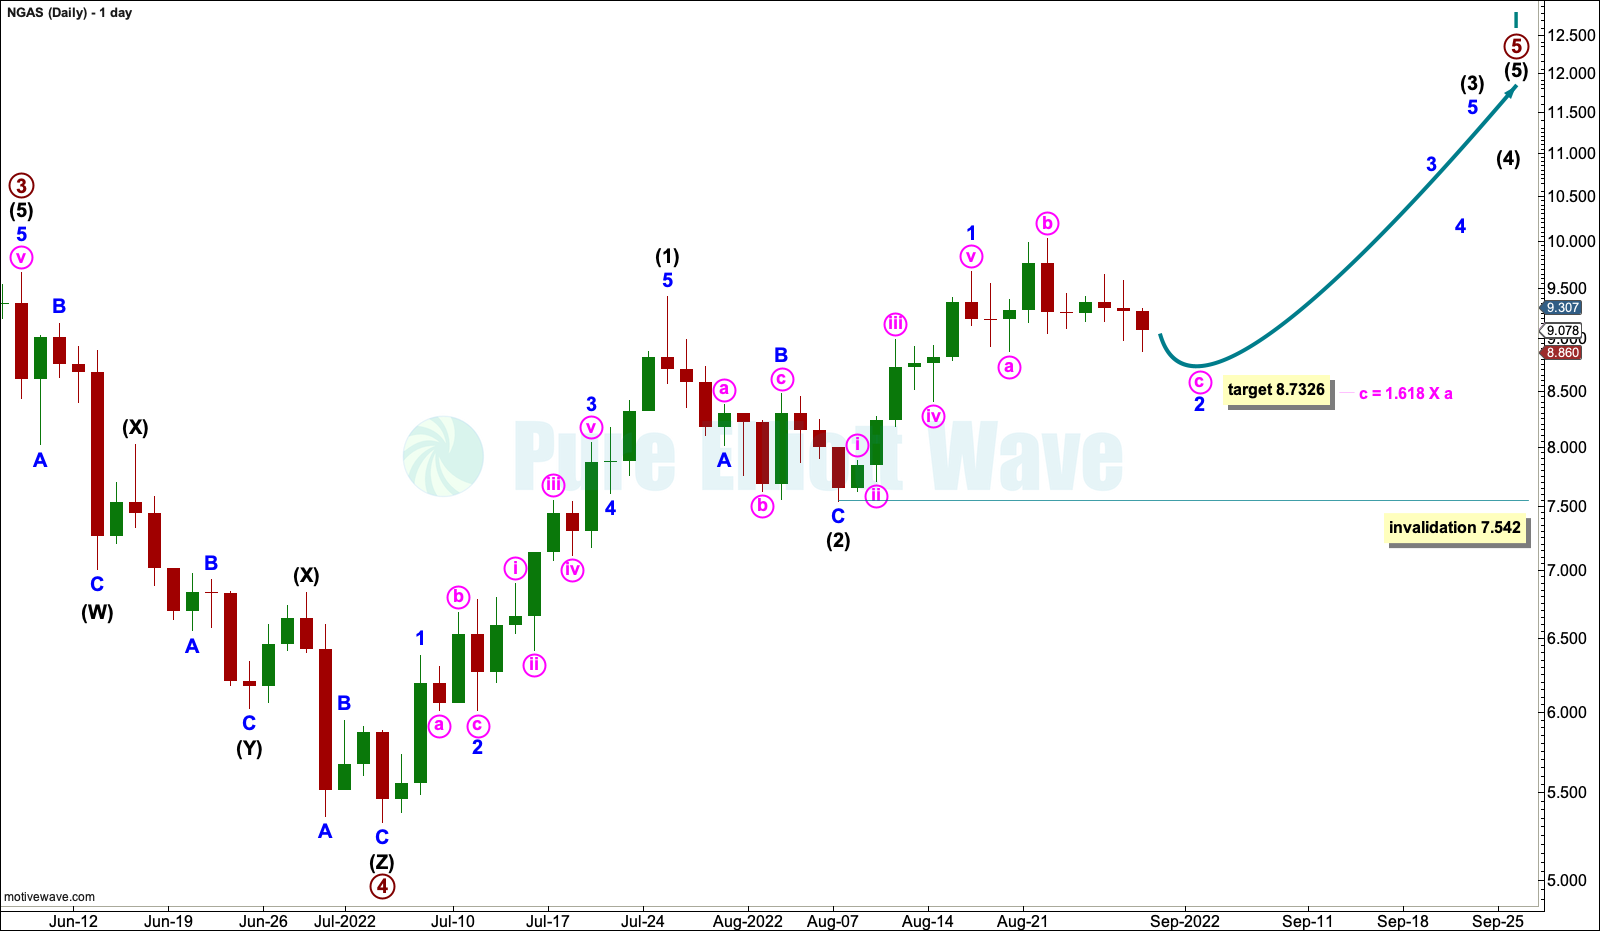
Within primary wave 5, intermediate waves (1) and (2) may be complete.
Within intermediate wave (3): Minor wave 1 may be complete and minor wave 2 may continue a little lower as an expanded flat. Within the expanded flat, minute wave c would reach 1.618 the length of minute wave a at 8.7236.
ALTERNATE ELLIOTT WAVE COUNT
WEEKLY
Click chart to enlarge.
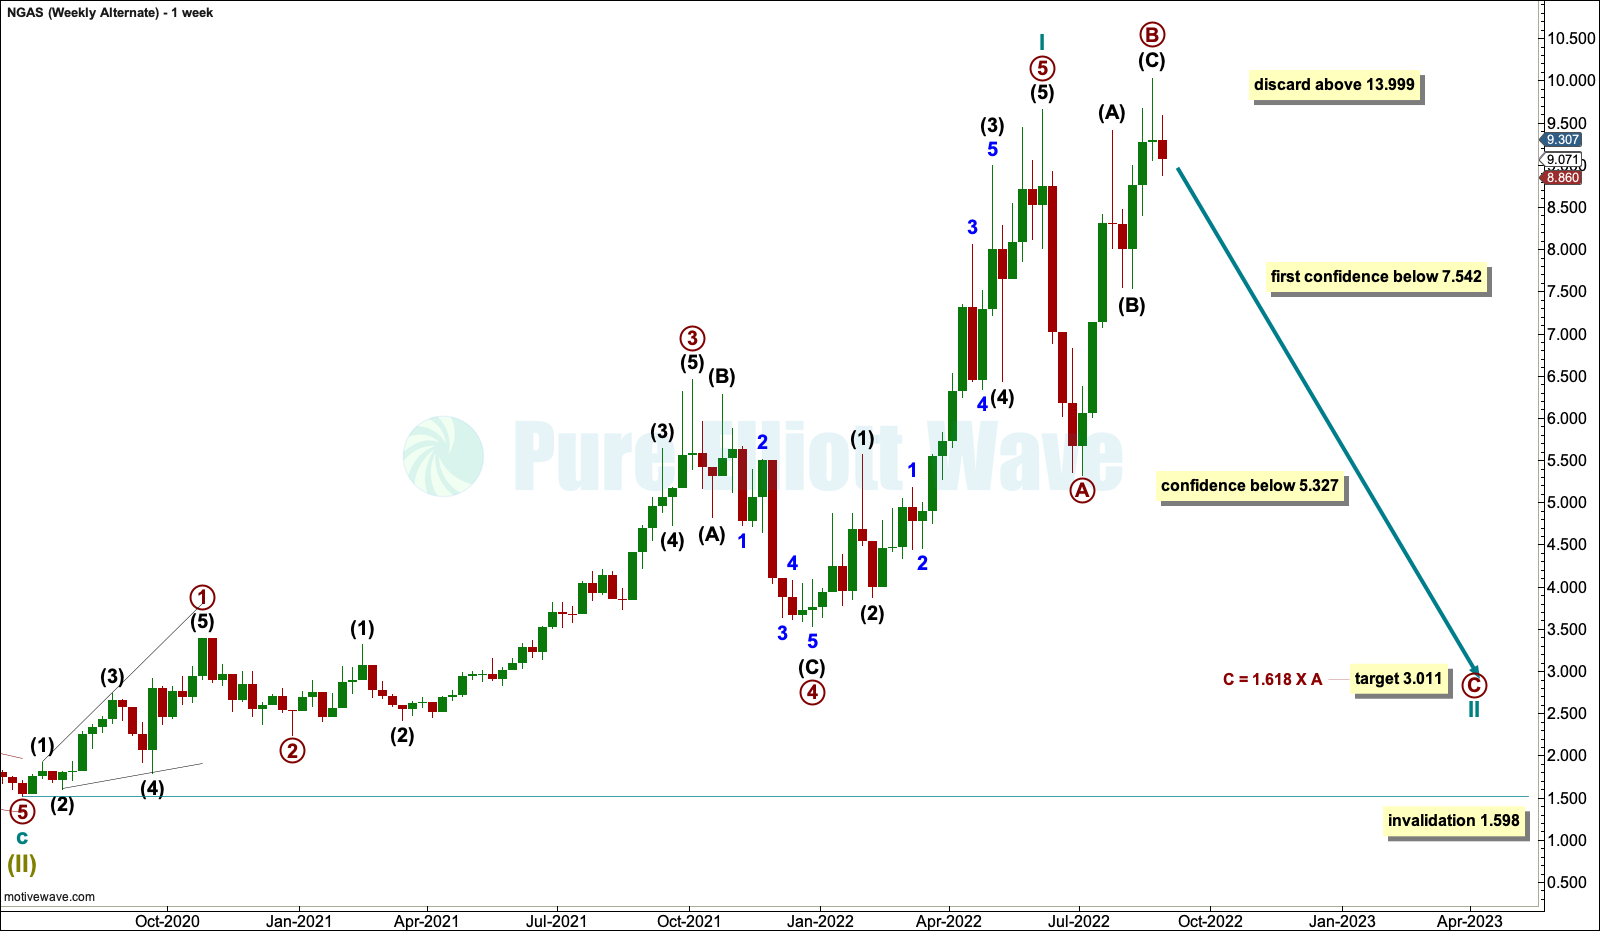
It is possible that cycle wave I is over and cycle wave II may be unfolding as an expanded flat. Cycle wave II may not move beyond the start of cycle wave I below 1.598.
Second wave corrections are normally deep.
DAILY
Click chart to enlarge.
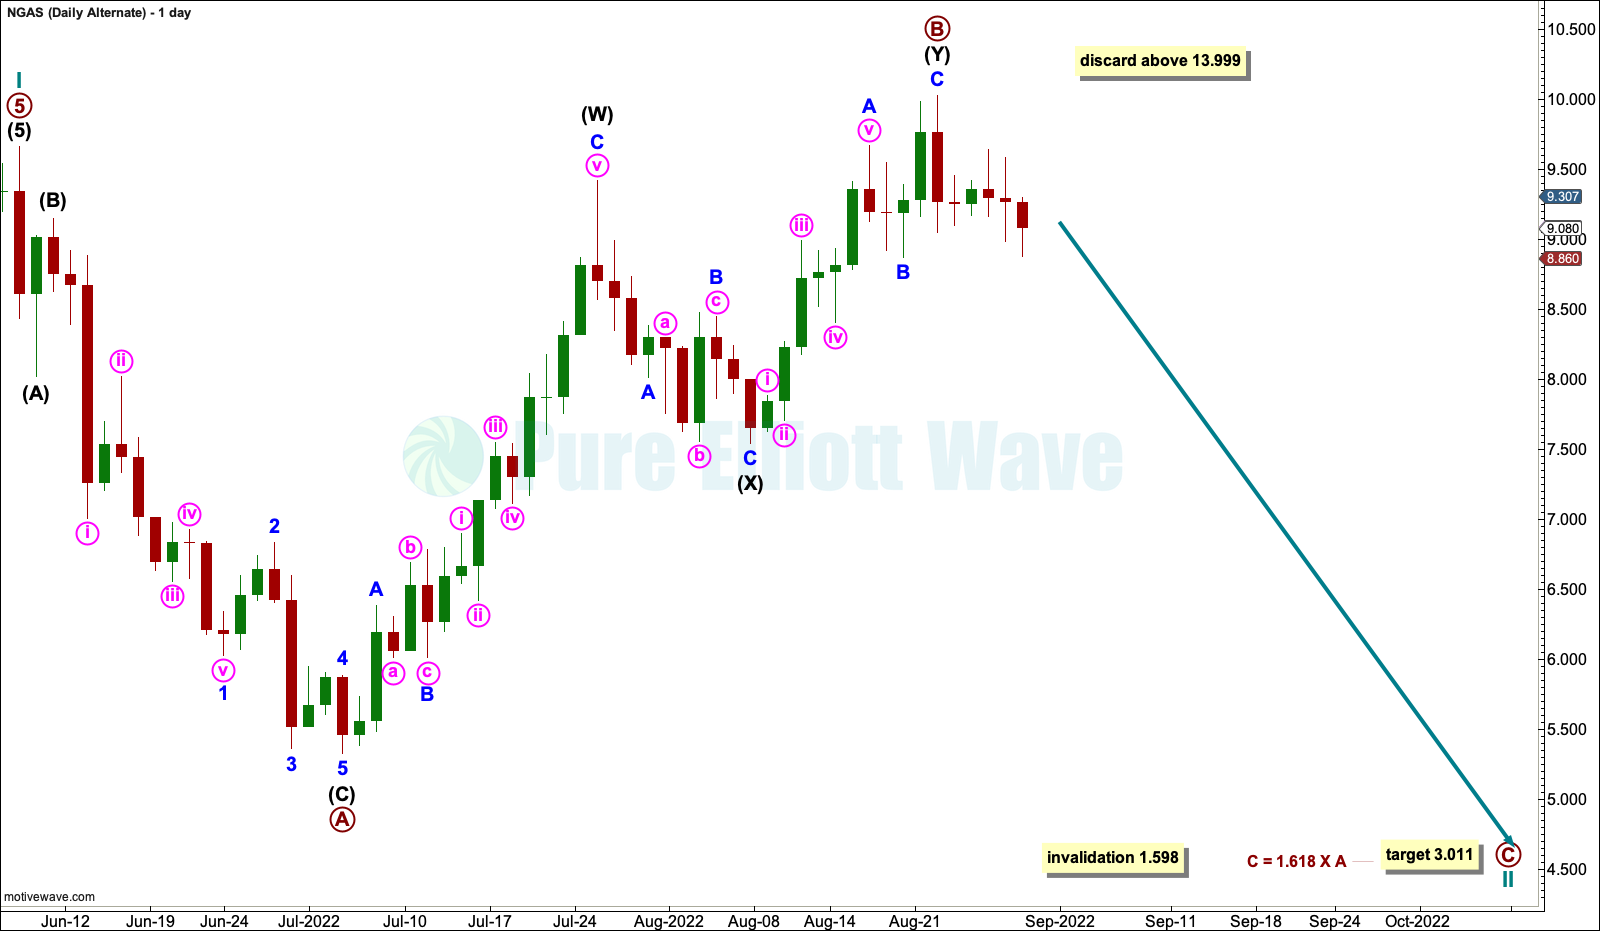
Within the expanded flat: Primary wave A may be a complete zigzag and primary wave B may also be complete as a double zigzag, but the second zigzag in the double may also move higher.
There is no rule in Elliott wave stating a maximum length for B waves within flats. There is a convention that states when wave B is twice the length of wave A the idea should be discarded based upon a very low probability. Primary wave B would reach twice the length of primary wave A at 13.999. Above this price point this wave count should be discarded.
At 3.011 primary wave C would reach 1.618 the length of primary wave A.
TECHNICAL ANALYSIS
WEEKLY
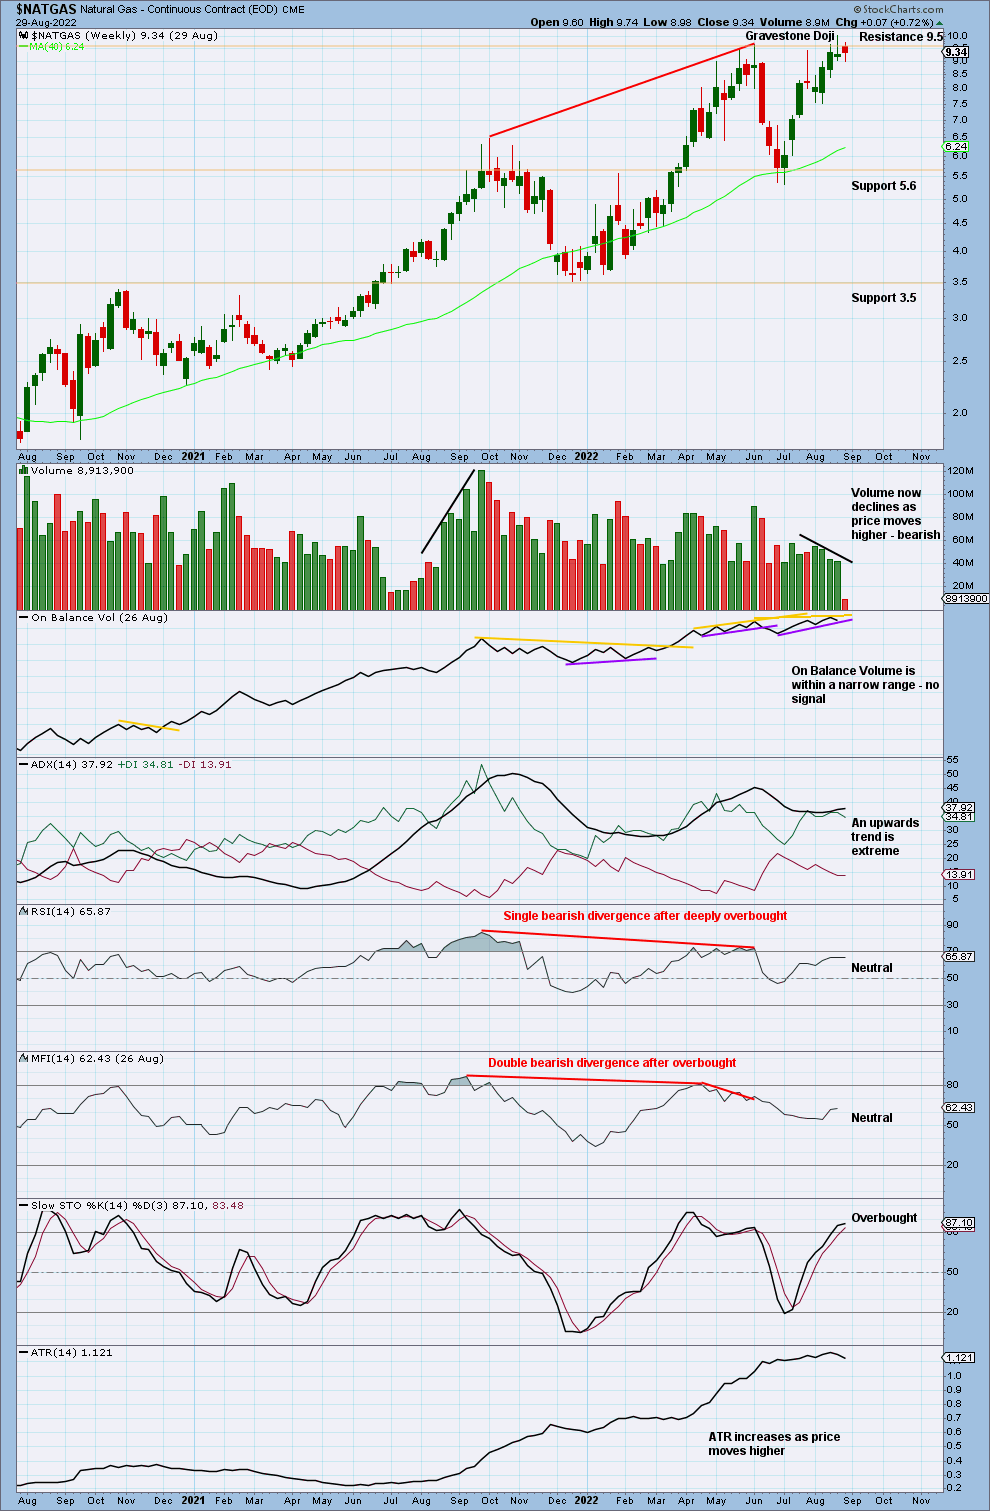
Click chart to enlarge.
At the last high is a Gravestone Doji, which is a bearish reversal pattern. This comes in the context of an extreme upwards trend after RSI and Money Flow Index both reached overbought and then exhibited bearish divergence. Given this context, this market is highly vulnerable to a trend change. This chart supports the alternate Elliott wave count.
DAILY
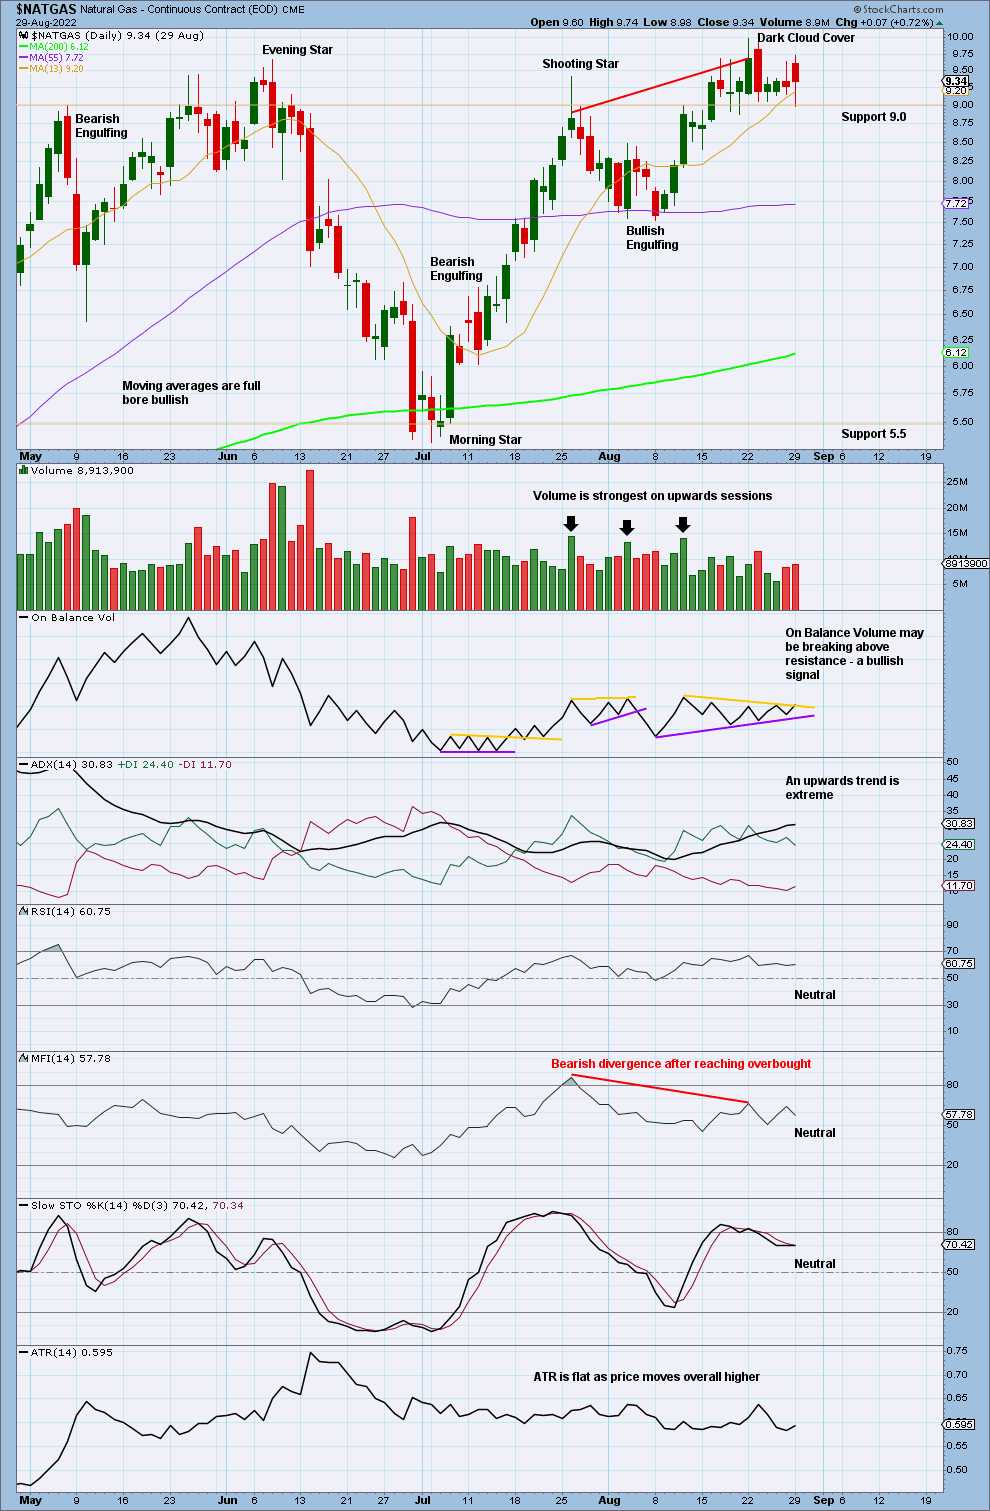
Click chart to enlarge.
The upwards trend is extreme at the daily chart level as well. There is a bearish reversal pattern in Dark Cloud Cover on the daily chart after Money Flow Index has reached overbought and exhibited bearish divergence. This chart offers some support to the alternate Elliott wave count.
Published @ 05:18 p.m. ET.
—
Careful risk management protects your investments.
Follow my two Golden Rules:
1. Invest only funds you can afford to lose.
2. Have an exit plan for both directions – where or when to take profit, and when to exit a losing investment.
 Save as PDF