August 10, 2022: XRP-USD Elliott Wave and Technical Analysis – Video and Charts
Summary: It is possible that XRP may have formed a sustainable low at 0.29058 on June 18, 2022. A new high above 0.61450 and a breach of the channel containing the bear market would add confidence in this view. A potential range for the next bull run may be from 30.09 to 158.49.
The data used for this analysis comes from Yahoo Finance XRP-USD.
All charts are on a semi-log scale.
MAIN ELLIOTT WAVE COUNT
MONTHLY
Click chart to enlarge.
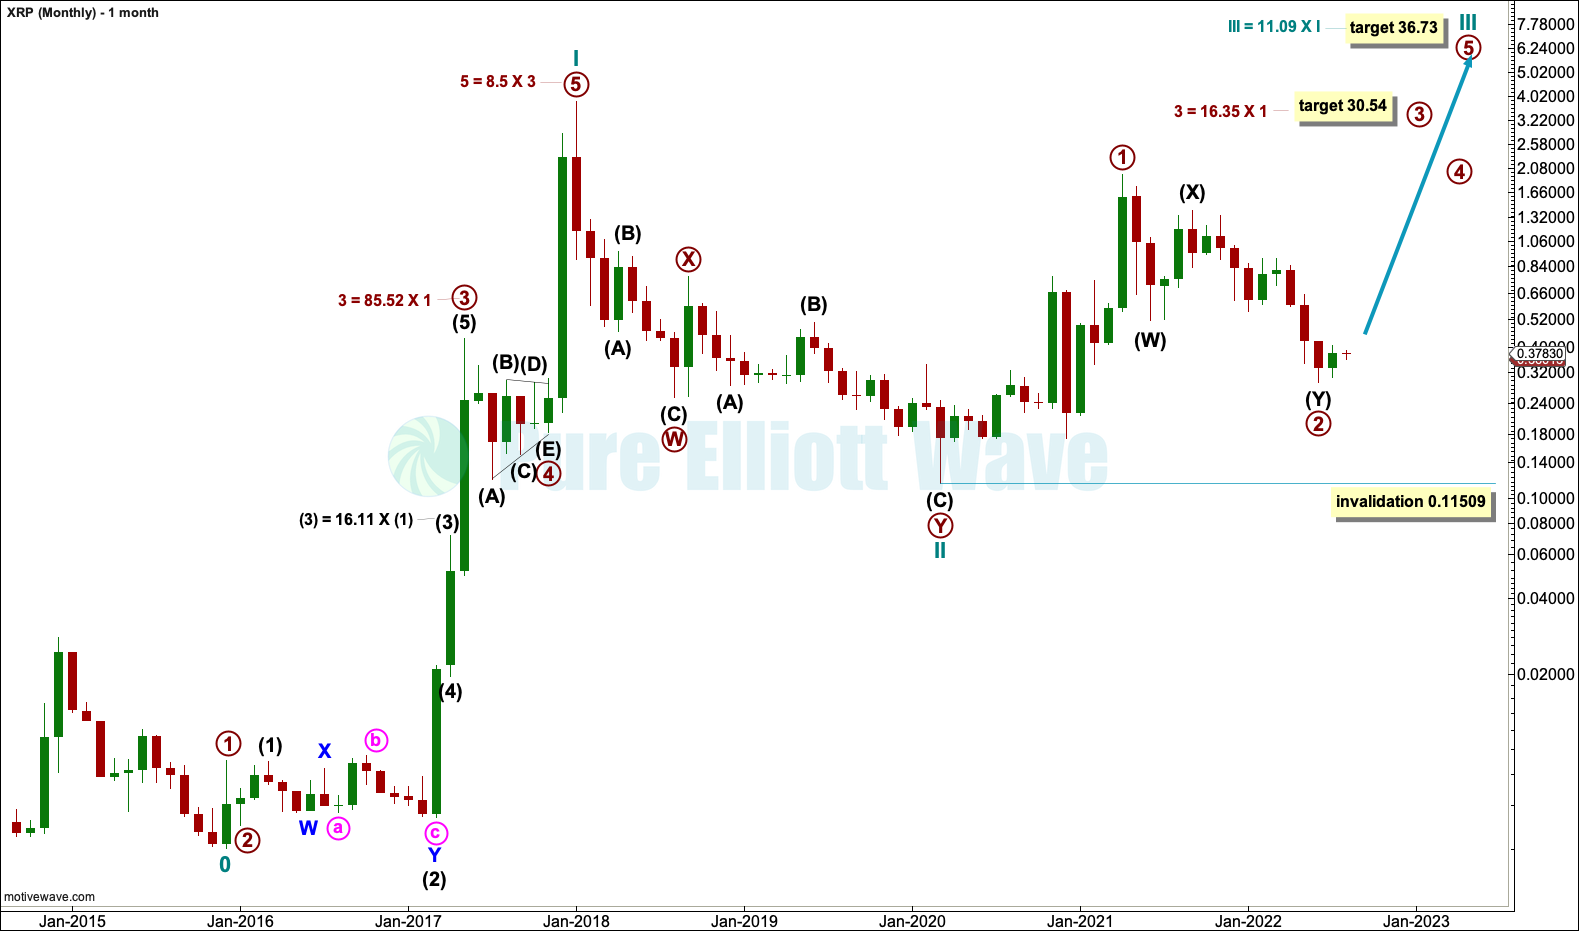
A five wave impulse can be seen from the low in December 2015 to the high in January 2018, labelled cycle wave I. Cycle wave I lasted just over 2 years.
Cycle wave I is followed by a deep 97% bear market, labelled cycle wave II. Cycle wave II lasted just over 2 years and subdivides as a double zigzag.
Cycle wave III may only subdivide as an impulse. Cycle wave III must move beyond the end of cycle wave I. So far within cycle wave III, primary waves 1 and 2 may be complete.
This Elliott wave count is very bullish. It expects that a third wave up at cycle and primary degree may be in their very early stages.
Targets are highly provisional. Note within cycle wave I that the third waves on this chart range from 16.11 to 85.52 times the length of their counterpart first waves. Given this past behaviour, a potential range for primary wave 3 could be from 30.09 to 158.49 and for cycle wave III from 61.94 to 328.33.
Targets are calculated using Fibonacci ratios. If these targets are wrong, then they may be too low.
WEEKLY
Click chart to enlarge.
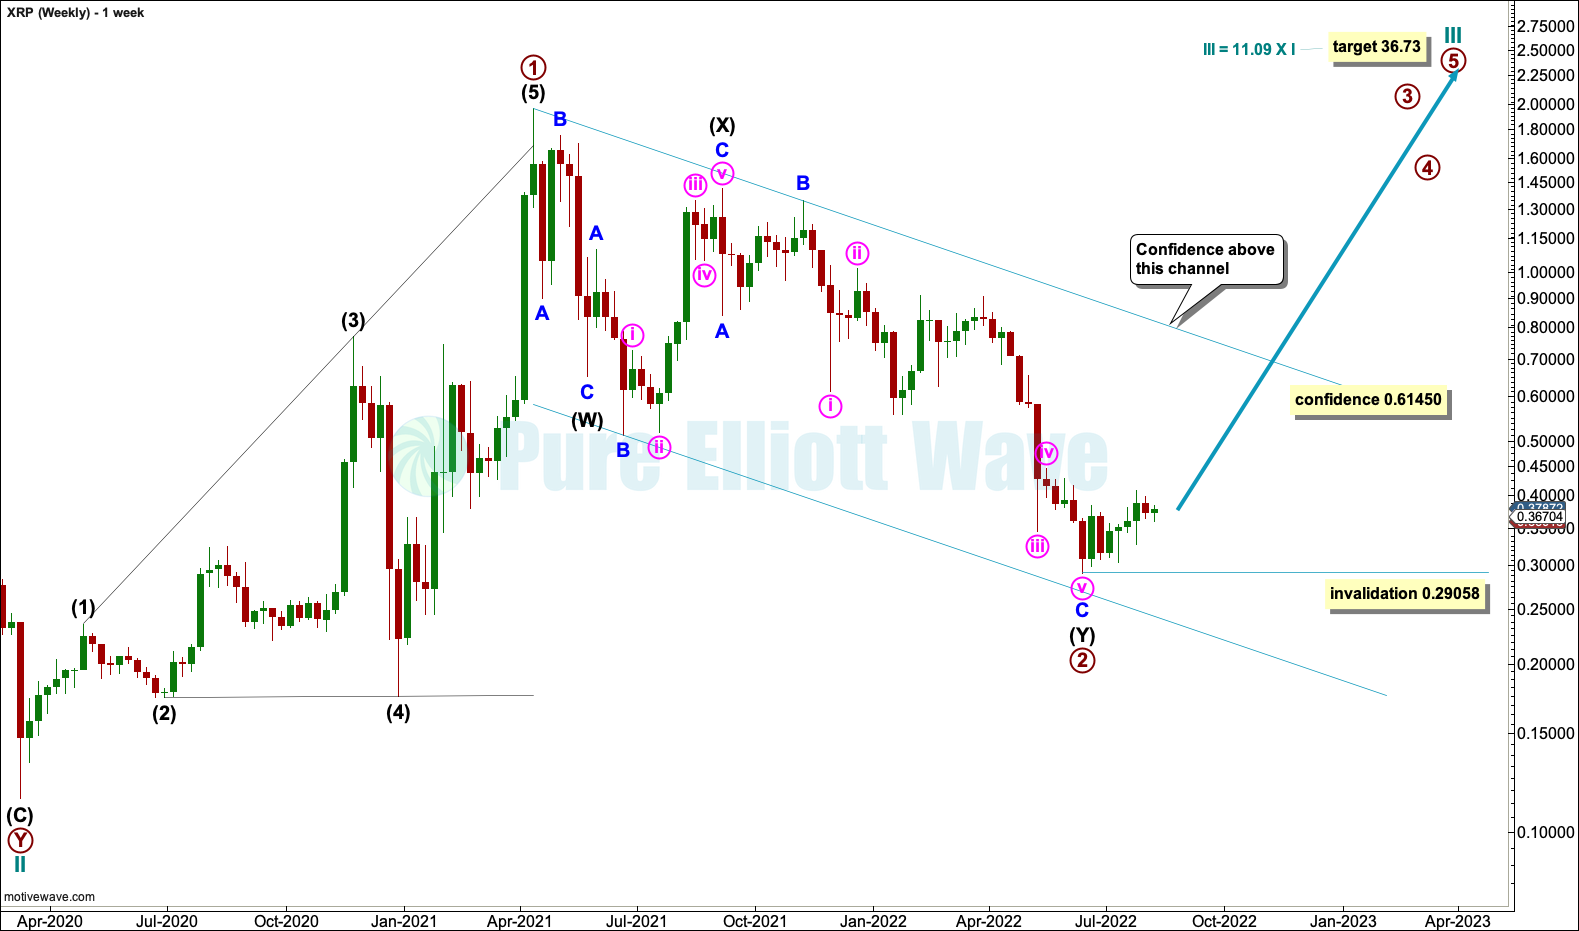
Primary wave 1 may have completed as a leading expanding diagonal.
Primary wave 2 may be complete as a double zigzag.
A new high above 0.61450 would invalidate the alternate weekly Elliott wave count below and add confidence to this main wave count.
Within primary wave 3, no second wave correction may move beyond its start below 0.29058.
A conservative channel is drawn about the bear market of primary wave 2 to contain all movement. A breach of this channel would add confidence to this wave count.
DAILY
Click chart to enlarge.
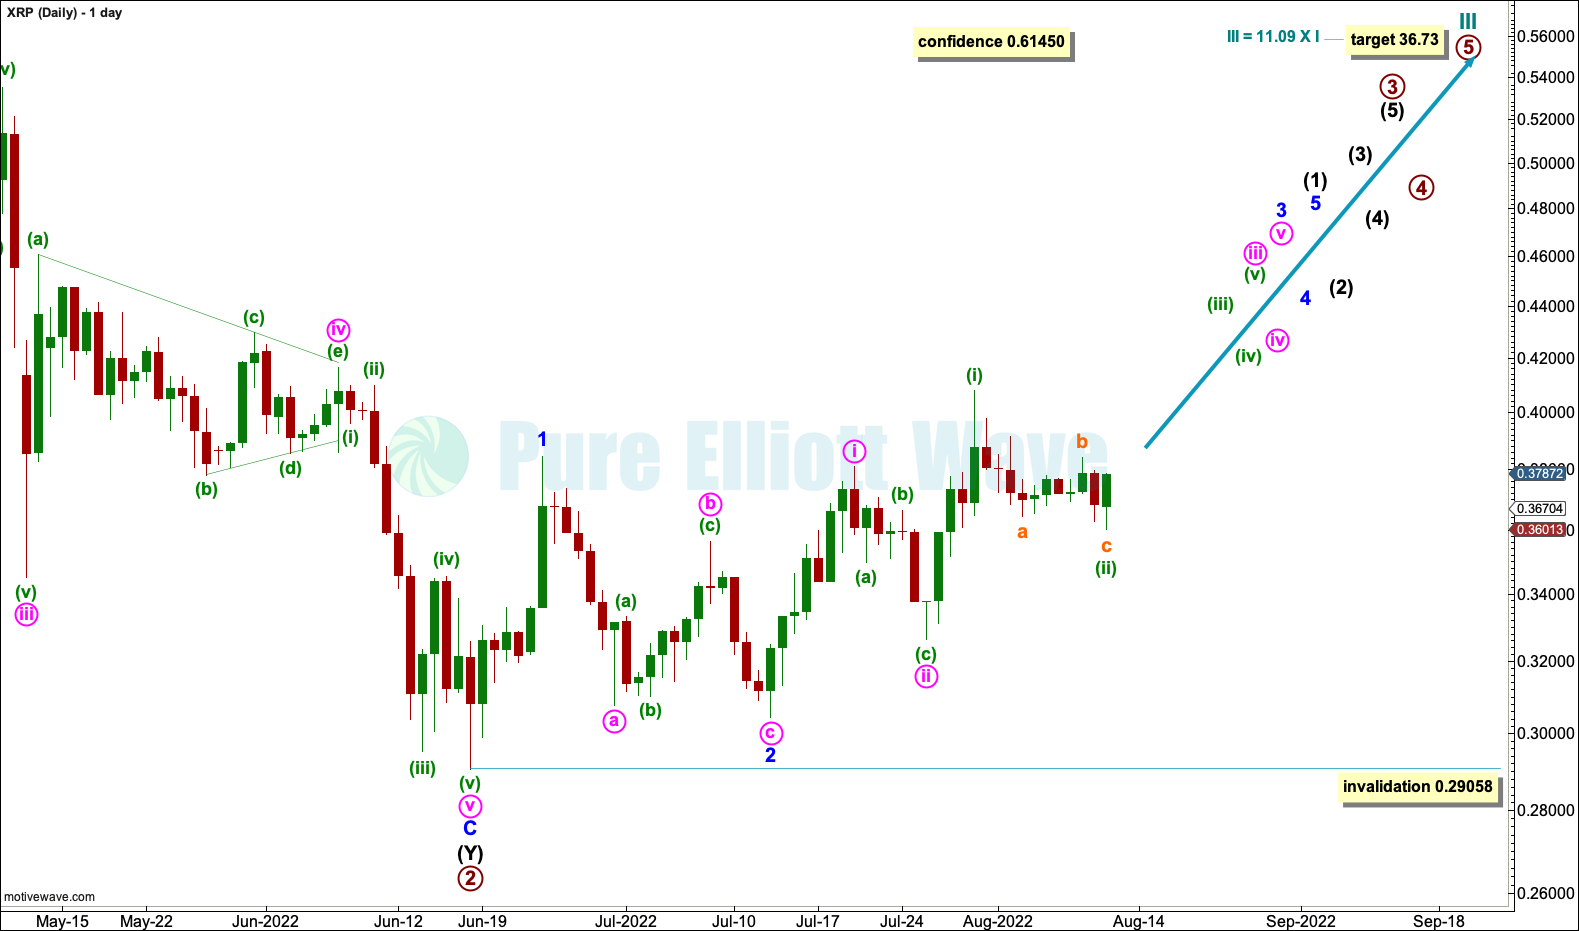
There may now be a series of three overlapping first and second waves to begin the next bull run: minor waves 1 and 2, minute waves i and ii, minuette waves (i) and (ii). This wave count expects an increase in upwards momentum and volume.
When intermediate wave (1) may be complete, then a multi-week pullback or consolidation for intermediate wave (2) may begin. Intermediate wave (2) would most likely be very deep, deeper than the 0.618 Fibonacci ratio of intermediate wave (1). Intermediate wave (2) may not move beyond the start of intermediate wave (1) below 0.29058.
WEEKLY ALTERNATE
Click chart to enlarge.
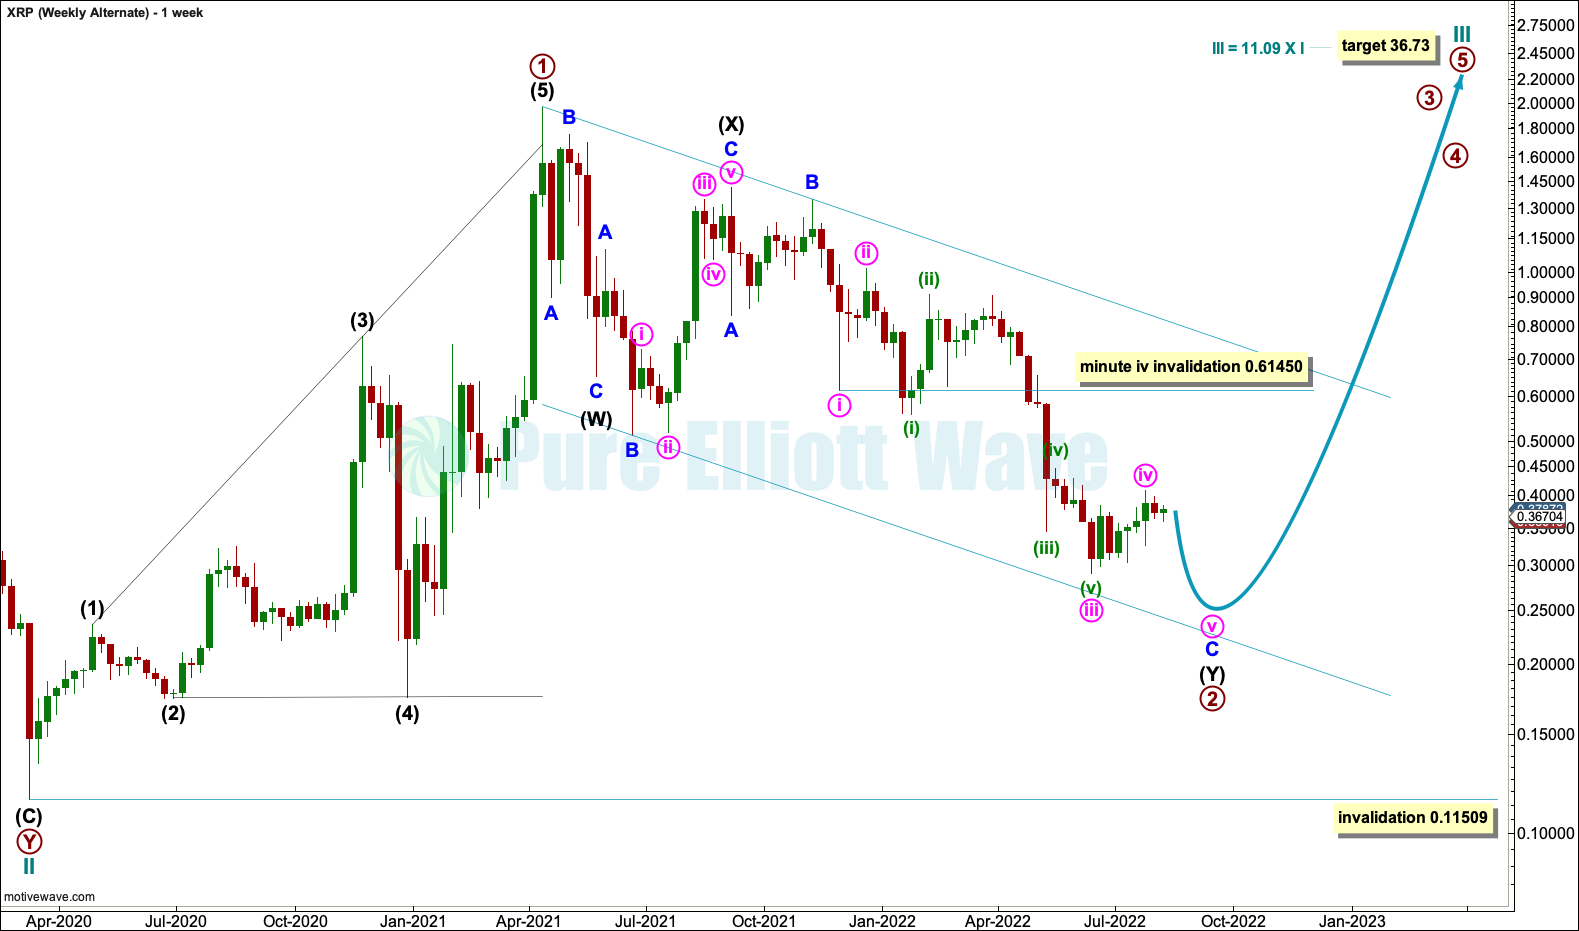
It is possible that a final fifth wave may be required to complete the bear market labelled primary wave 2.
Within the second zigzag of the double, labelled intermediate wave (Y): Minor waves A and B may be complete and minor wave C may be extending.
Within minor wave C, minute wave iv may not move into minute wave i price territory above 0.61450. Invalidation of this bearish wave count would add confidence to the main bullish wave count.
TECHNICAL ANALYSIS
WEEKLY
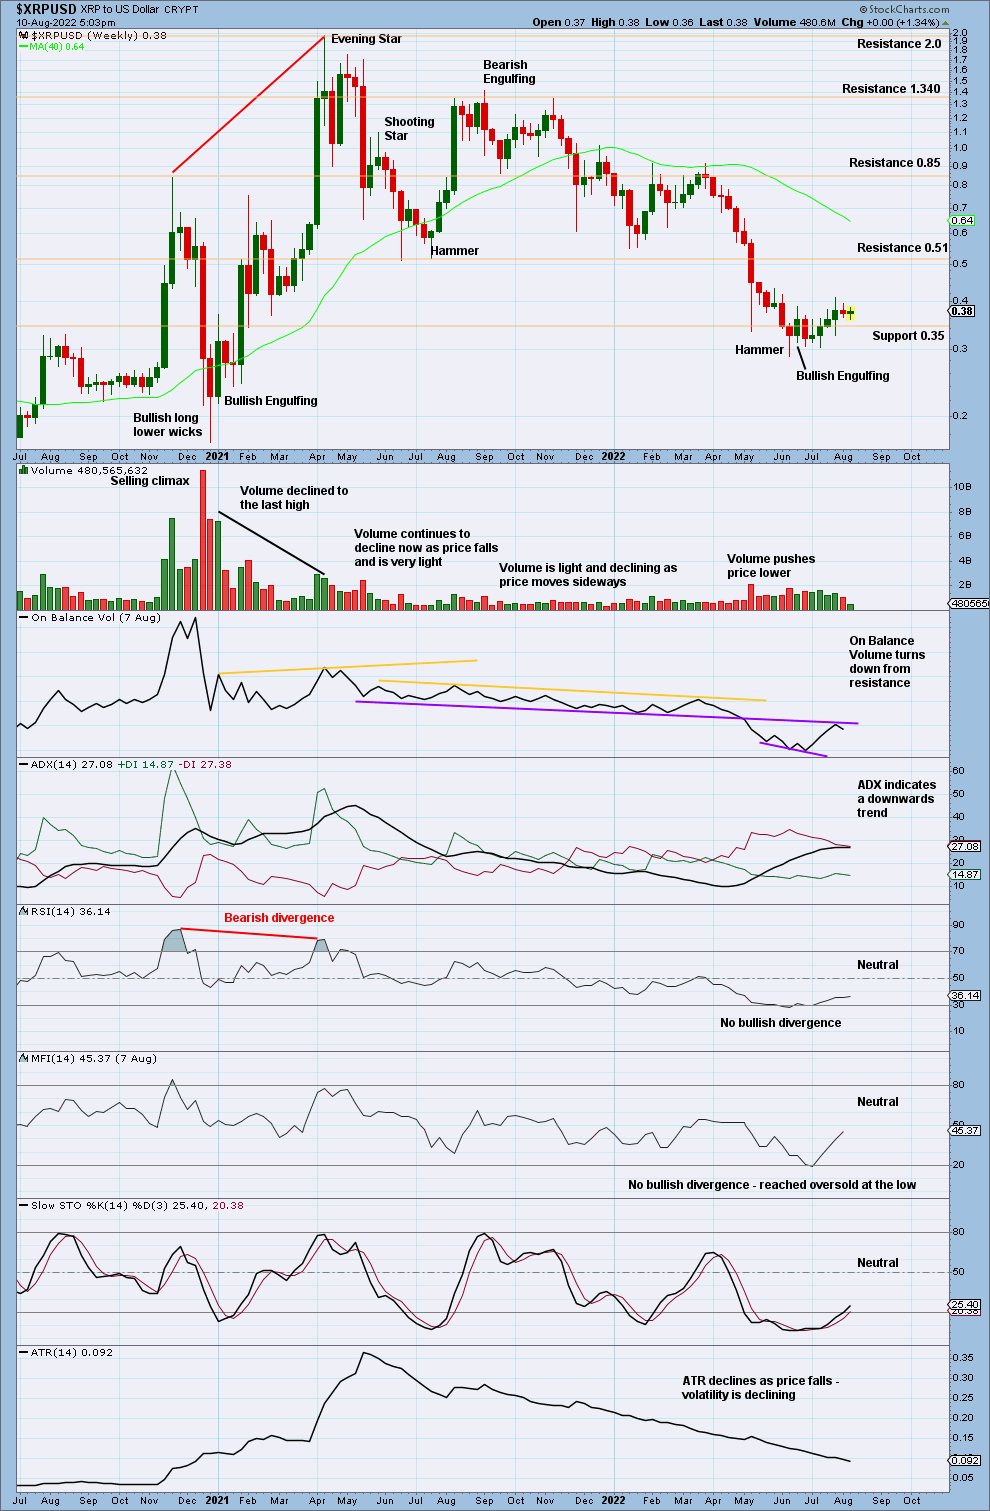
Click chart to enlarge.
There are two bullish candlestick patterns at the last low. This comes in the context of Money Flow Index and RSI reaching oversold at the weekly time frame, although neither exhibit bullish divergence. Overall, this is bullish. It is possible that a sustainable low may be in place.
DAILY
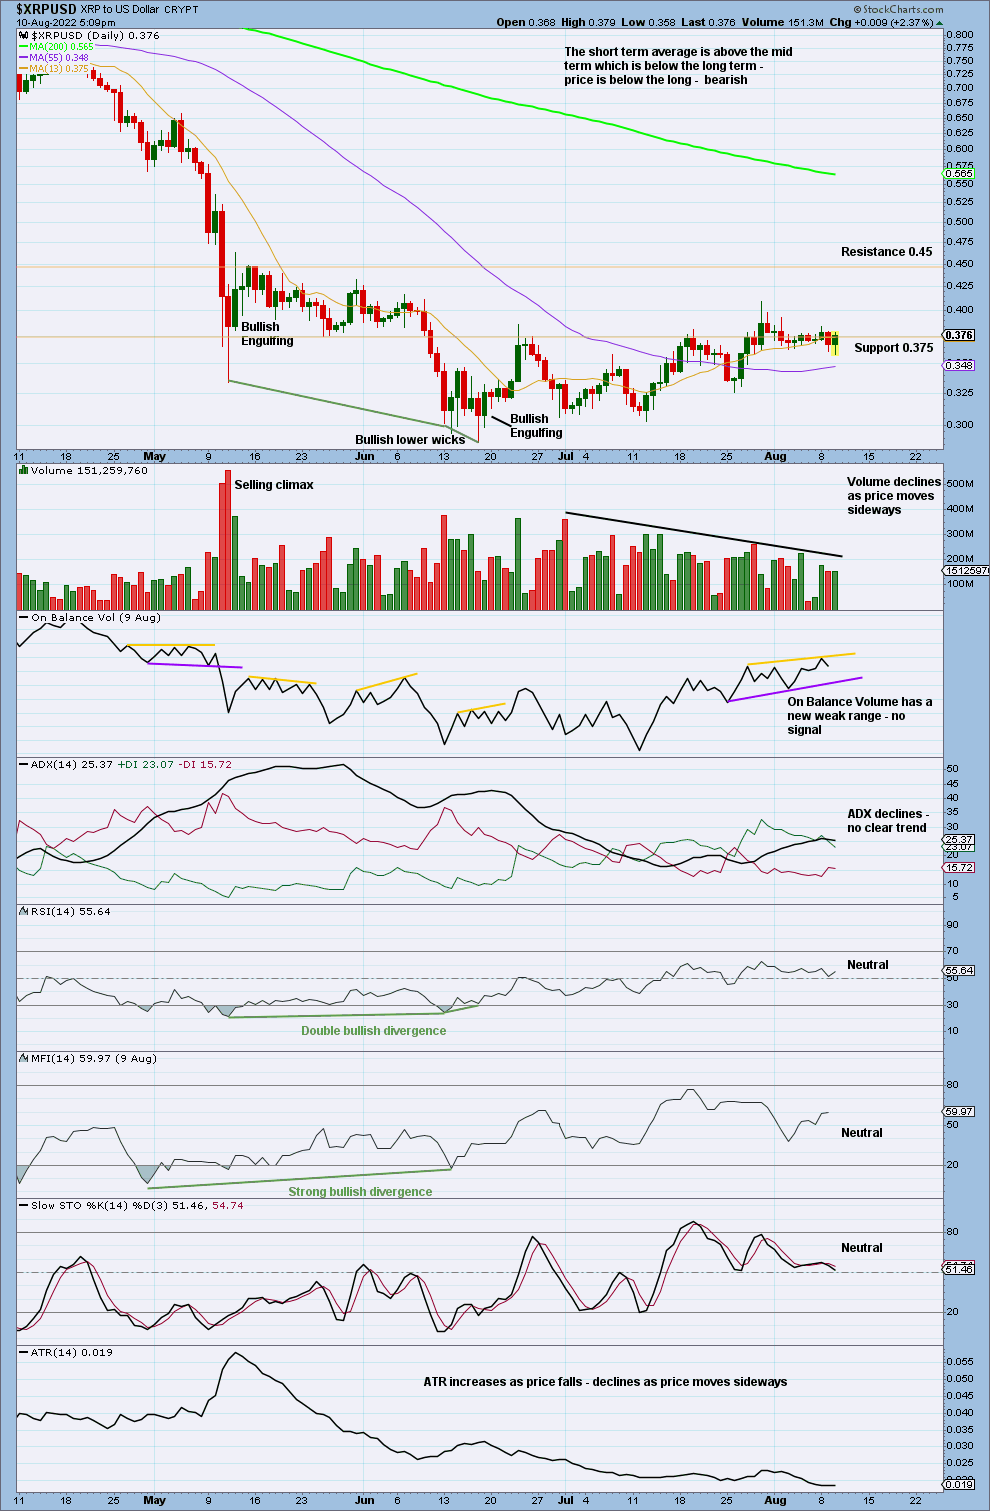
Click chart to enlarge.
At the daily chart level: The downwards trend reached very extreme, RSI and Money Flow Index exhibited bullish divergence, and there is a bullish candlestick pattern at the low. It is possible that this low may be sustainable.
Published @ 02:51 p.m. ET.
—
Careful risk management protects your investments.
Follow my two Golden Rules:
1. Invest only funds you can afford to lose.
2. Have an exit plan for both directions – where or when to take profit, and when to exit a losing investment.
—
New updates to this analysis are in bold.
–