October 31, 2022: BTCUSD Elliott Wave and Technical Analysis – Weekly – Video And Charts

Summary: A third wave at primary and cycle degree may be in its early stages. Minimum price expectation (not a target) may be about 392,275.
The low at 3,191.30 of December 15, 2018, is expected to be sustained.
The weekly Elliott wave main count expects overall years of upwards movement to complete a cycle degree third wave. Targets (from the monthly chart) for cycle wave III are highly provisional; they are subject to change as more structure is available to analyse. The targets in order from lowest to highest are: 223,535 (unlikely to be high enough), 775,540 and 936,671.
The data used for this analysis comes from Yahoo Finance BTC-USD.
All charts are on a semi-log scale.
For notes on identifying highs and lows for Bitcoin, see this article here.
For further notes and video on identifying lows for Bitcoin, see this video here.
Monthly charts were last updated here.
MAIN ELLIOTT WAVE COUNT
WEEKLY
Click chart to enlarge.
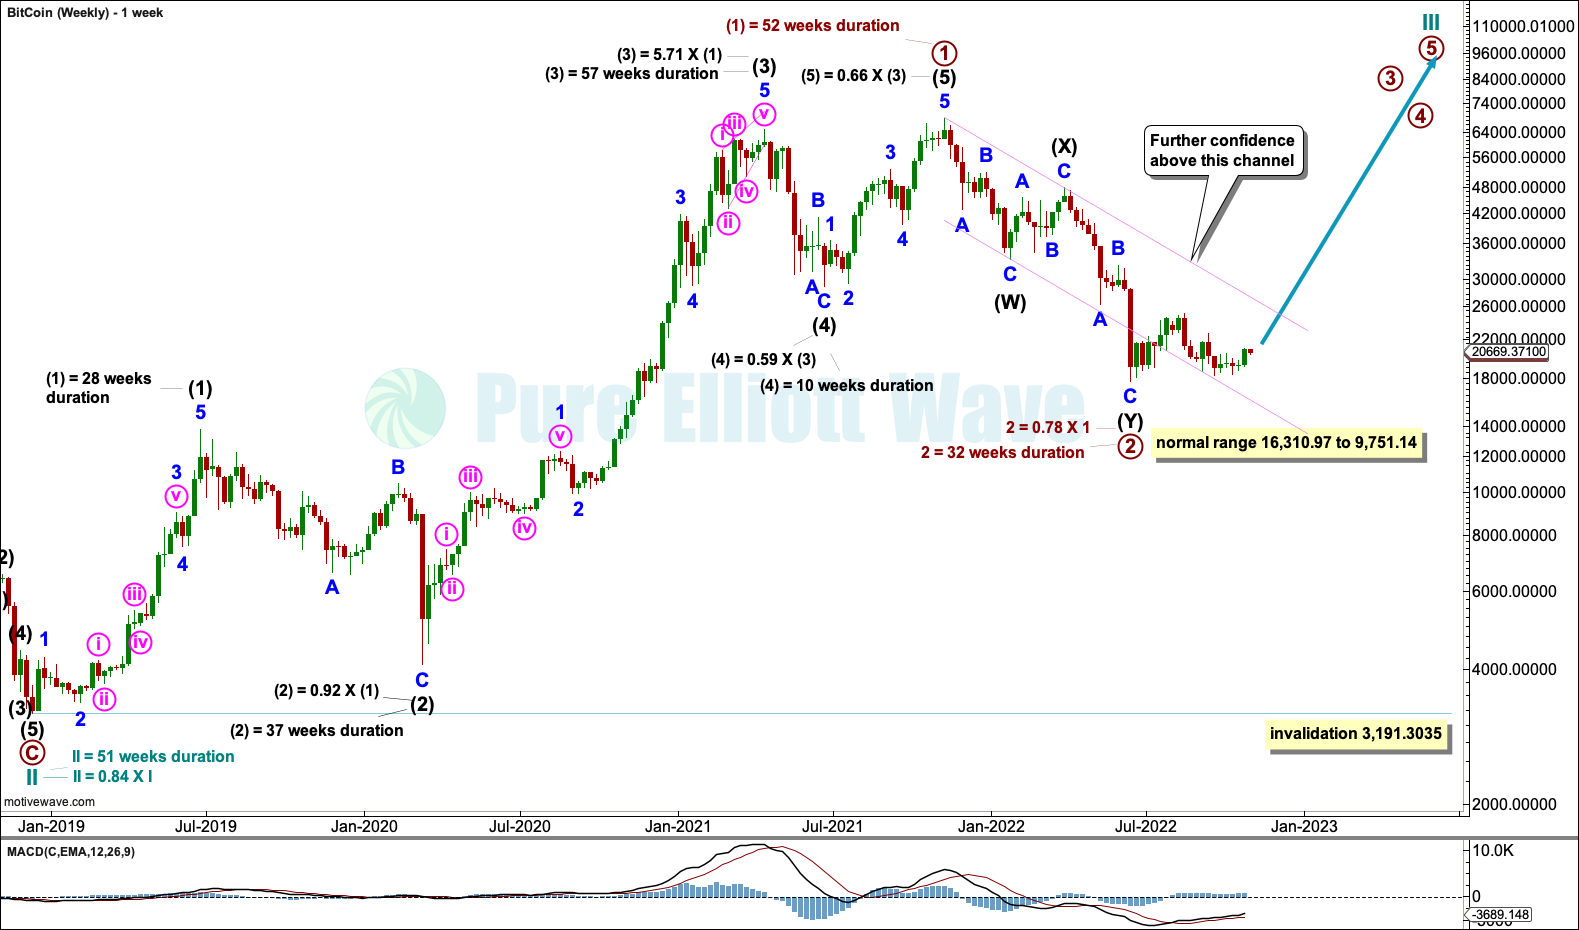
Primary wave 1 may be complete.
Intermediate wave (3) within primary wave 1 is just 5.71 times the length of intermediate wave (1). For most markets this would be considered very long, but the price history of Bitcoin illustrates that for this market it is remarkably short. Intermediate wave (5) is shorter than intermediate wave (3), the first time Bitcoin has exhibited a short fifth wave within a bullish impulse (at a larger degree).
There is alternation in depth but not structure between intermediate waves (2) and (4). Intermediate wave (2) is a deep single zigzag with an extended minor wave A. Intermediate wave (4) is a shallow single zigzag with an extended minor wave A. The proportion between intermediate waves (2) and (4) is acceptable; they both show clearly on higher time frames.
It is possible that primary wave 2 could be over at the last low. However, Bitcoin’s lows are very hard to identify, so an alternate is considered that allows for primary wave 2 to continue lower.
Primary wave 2 may not move beyond the start of primary wave 1 below 3,191.3035.
The channel in pink may be used for final confidence that a sustainable low is in place when the channel is breached by upwards movement. The lower edge of the channel continues to provide support. If this channel is breached by upwards movement in coming weeks, then the alternate wave count would be invalidated and the invalidation point may be moved up to the low of primary wave 2 at 17,708.623.
DAILY – MAIN
Click chart to enlarge.
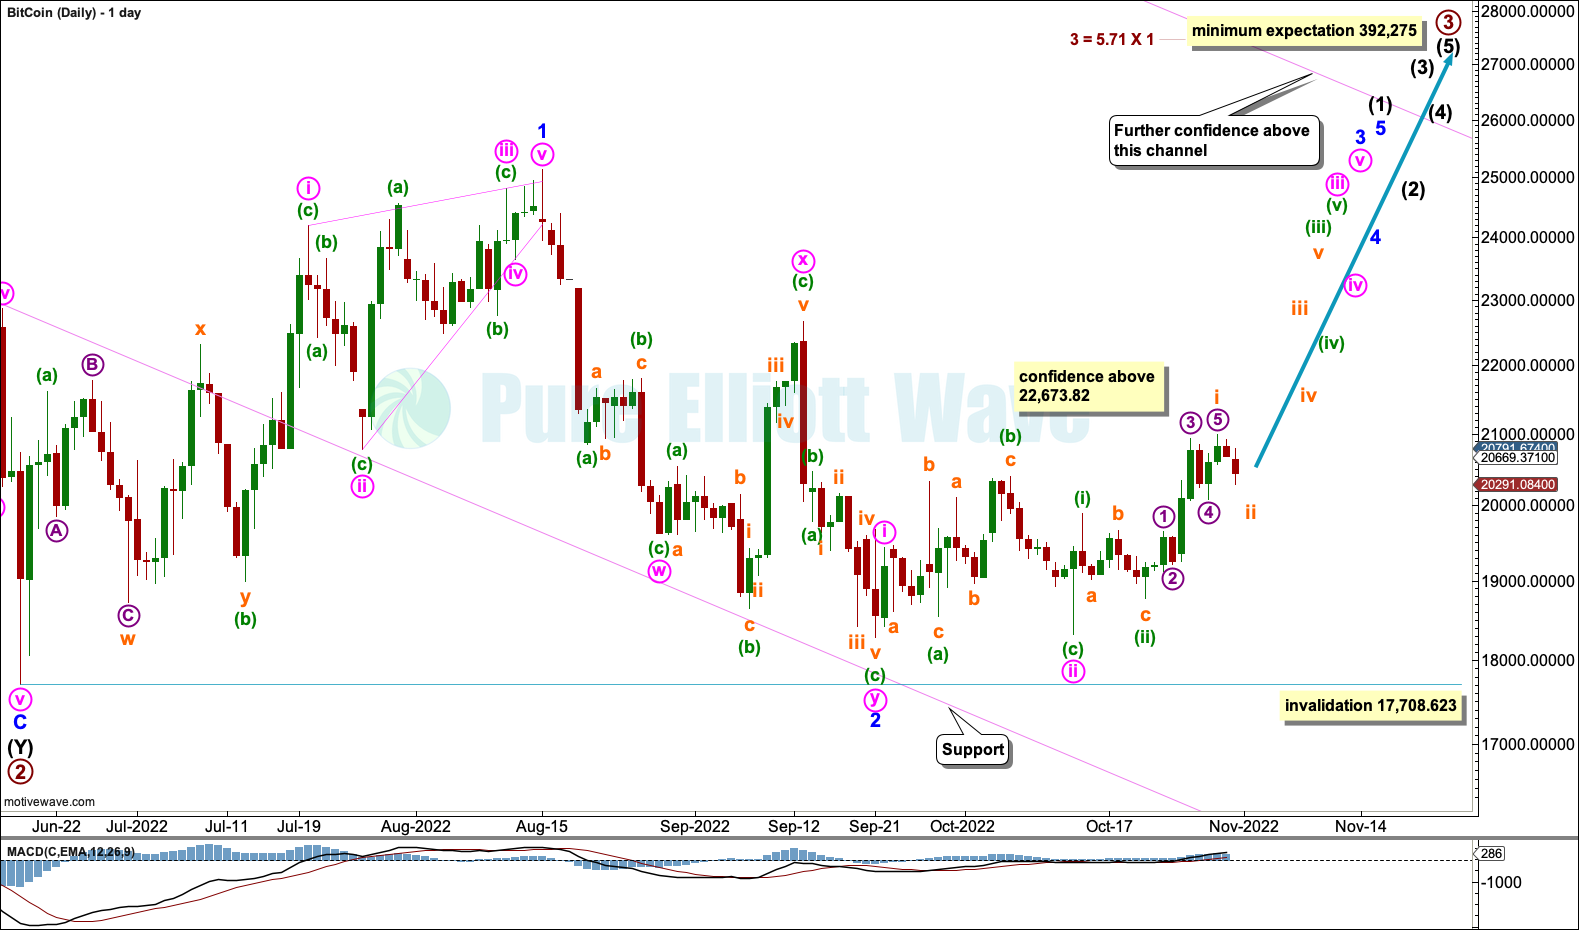
The wider pink channel is copied over from the weekly chart. The lower edge of this channel has provided resistance and now support as price moves slowly higher.
Within primary wave 3, intermediate wave (1) may be incomplete.
Within intermediate wave (1): Minor wave 1 may be a complete leading contracting diagonal, minor wave 2 may be a complete double zigzag (a very deep 0.92 of minor wave 1; second wave corrections following leading diagonals in first wave positions are commonly very deep), and minor wave 3 may now have begun with three first and second waves at minute, minuette and now subminuette degree.
Intermediate wave (2) may be expected to be very deep, about 0.7 to 0.9 the depth of intermediate wave (1), when it arrives. Intermediate wave (2) may not move beyond the start of intermediate wave (1) below 17,708.623.
The minimum expectation for primary wave 3 is based upon the prior shortest third wave in the price history of Bitcoin for third waves at intermediate degree or higher. The shortest prior third wave was intermediate wave (3) within primary wave 1 within cycle wave 3 at 5.71 times the length of intermediate wave (1). Bitcoin’s larger degree third waves range from 5.71 to 50.12 times the prior first wave. If primary wave 3 were to reach 50.12 times the length of primary wave 1, it would end at 3,306,587.53.
Primary wave 3 may only subdivide as an impulse. Intermediate wave (1) within the impulse may be in its very early stages.
The invalidation point for a bearish alternate wave count below is now at 25,135.59. A new high, by any amount at any time frame above this point, would add confidence to this bullish main wave count.
DAILY – ALTERNATE
Click chart to enlarge.
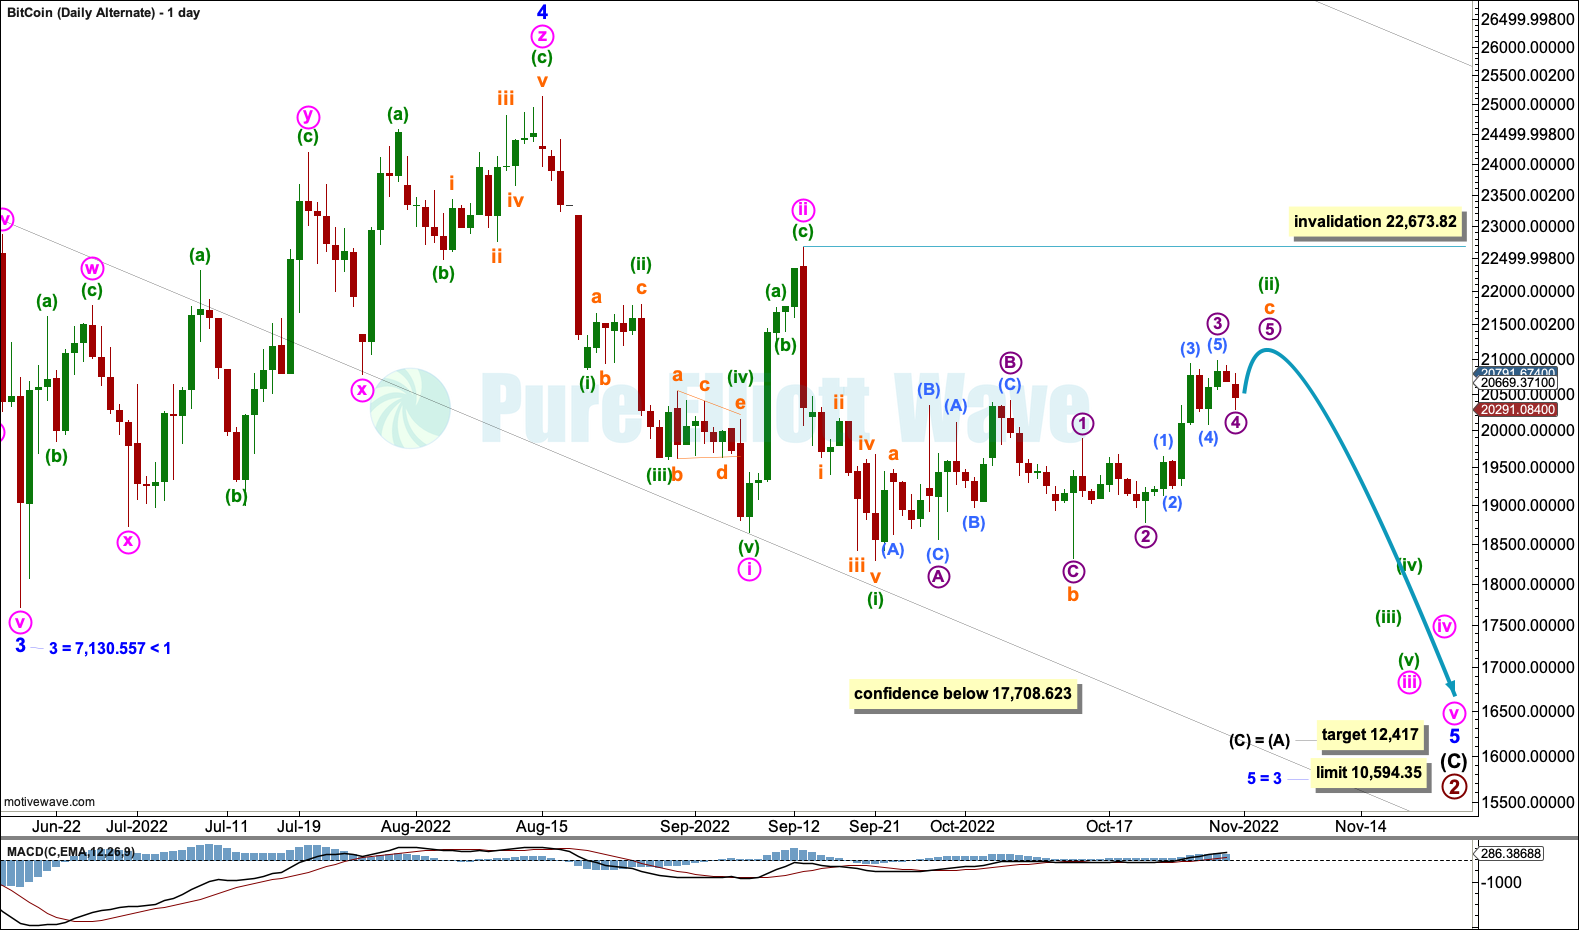
It is possible that primary wave 2 may be unfolding as a single zigzag that may be incomplete.
Within a single zigzag, for primary wave 2: Intermediate waves (A) and (B) may be complete and intermediate wave (C) may be incomplete.
Within intermediate wave (C): Minor waves 1 through to 3 may be complete and minor wave 4 may now be complete as a triple zigzag. Minor wave 4 has lasted 58 sessions. Minor wave 2 lasted 19 sessions. It is not common for fourth waves to be longer lasting than their counterpart second waves, so the probability of this wave count is reduced even further.
Minute waves i and ii within minor wave 5 may be complete.
Within minute wave iii: Minuette wave (i) may be complete and minuette wave (ii) may be nearly complete.
Minuette wave (ii) may not move beyond the start of minuette wave (i) above 22,673.82.
Primary wave 2 may not move beyond the start of primary wave 1 below 3,191.3035.
ALTERNATE ELLIOTT WAVE COUNT
WEEKLY
Click chart to enlarge.
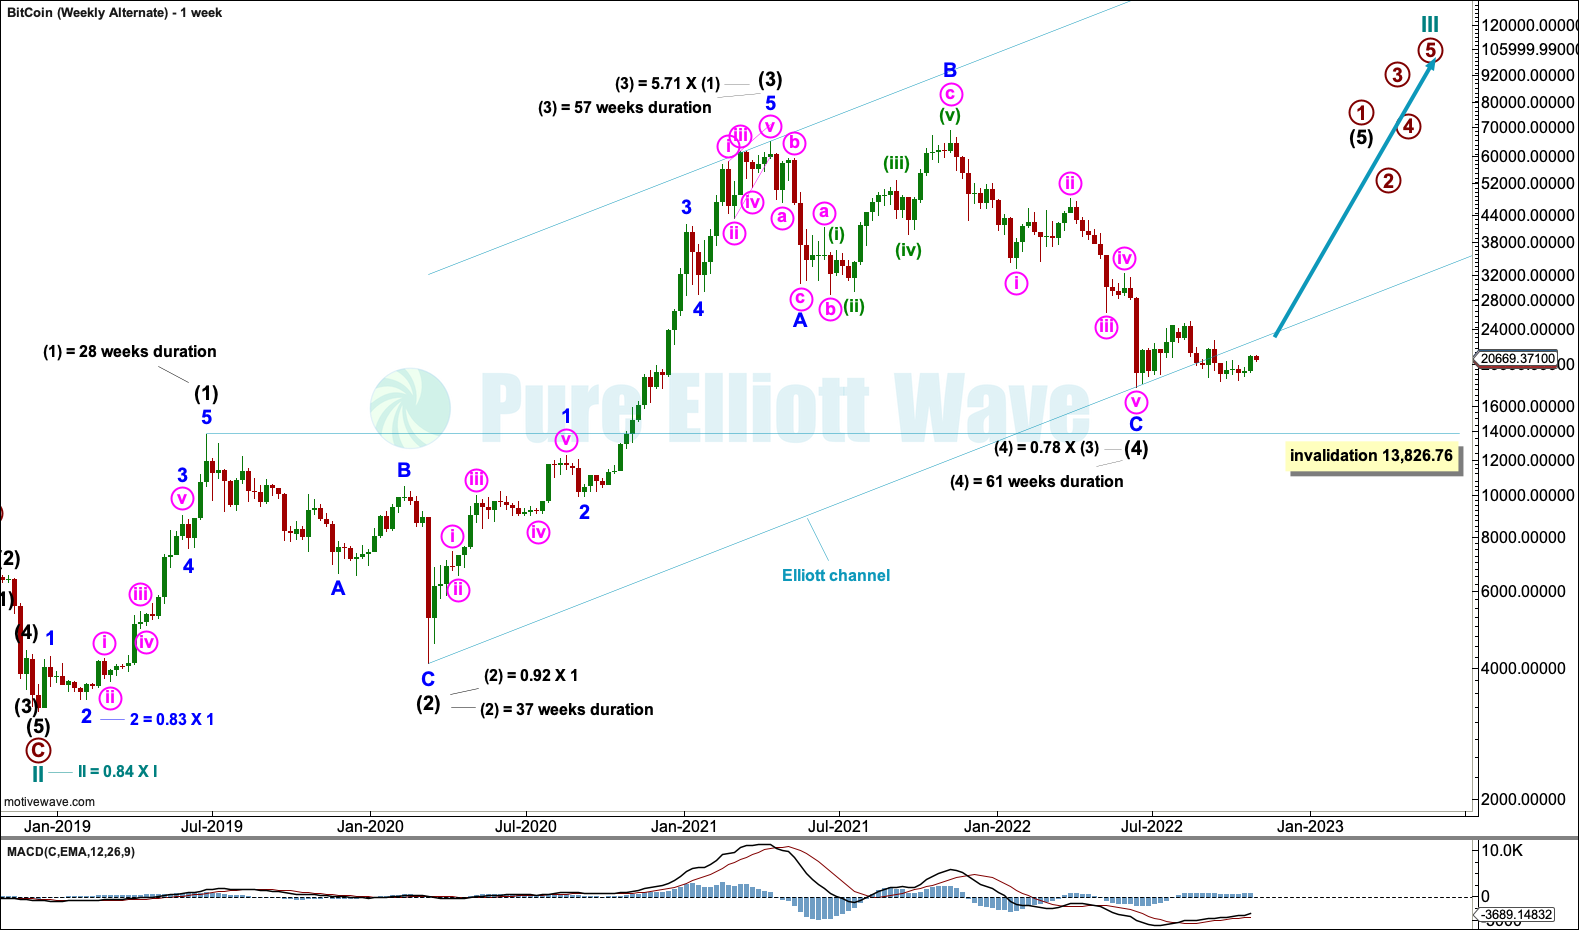
It is possible that primary wave 1 may be incomplete and that intermediate wave (4) may be a complete expanded flat.
This wave count is judged to have a lower probability than the main wave count because intermediate wave (4) is longer lasting than intermediate wave (2). It is uncommon for Bitcoin to exhibit fourth waves that last longer than their counterpart second waves by a reasonable degree.
Within the expanded flat, minor wave B is a 1.11 length of minor wave A, fitting within the common range of B waves within flats from 1 to 1.38. Minor wave C is 4,225 short of 1.618 the length of minor wave A. This difference is less than 10% the length of minor wave C, so the variation is judged to be small enough to say minor waves A and C exhibit a Fibonacci ratio.
If it continues any lower, then intermediate wave (4) may not move into intermediate wave (1) price territory below 13,826.76.
TECHNICAL ANALYSIS
WEEKLY
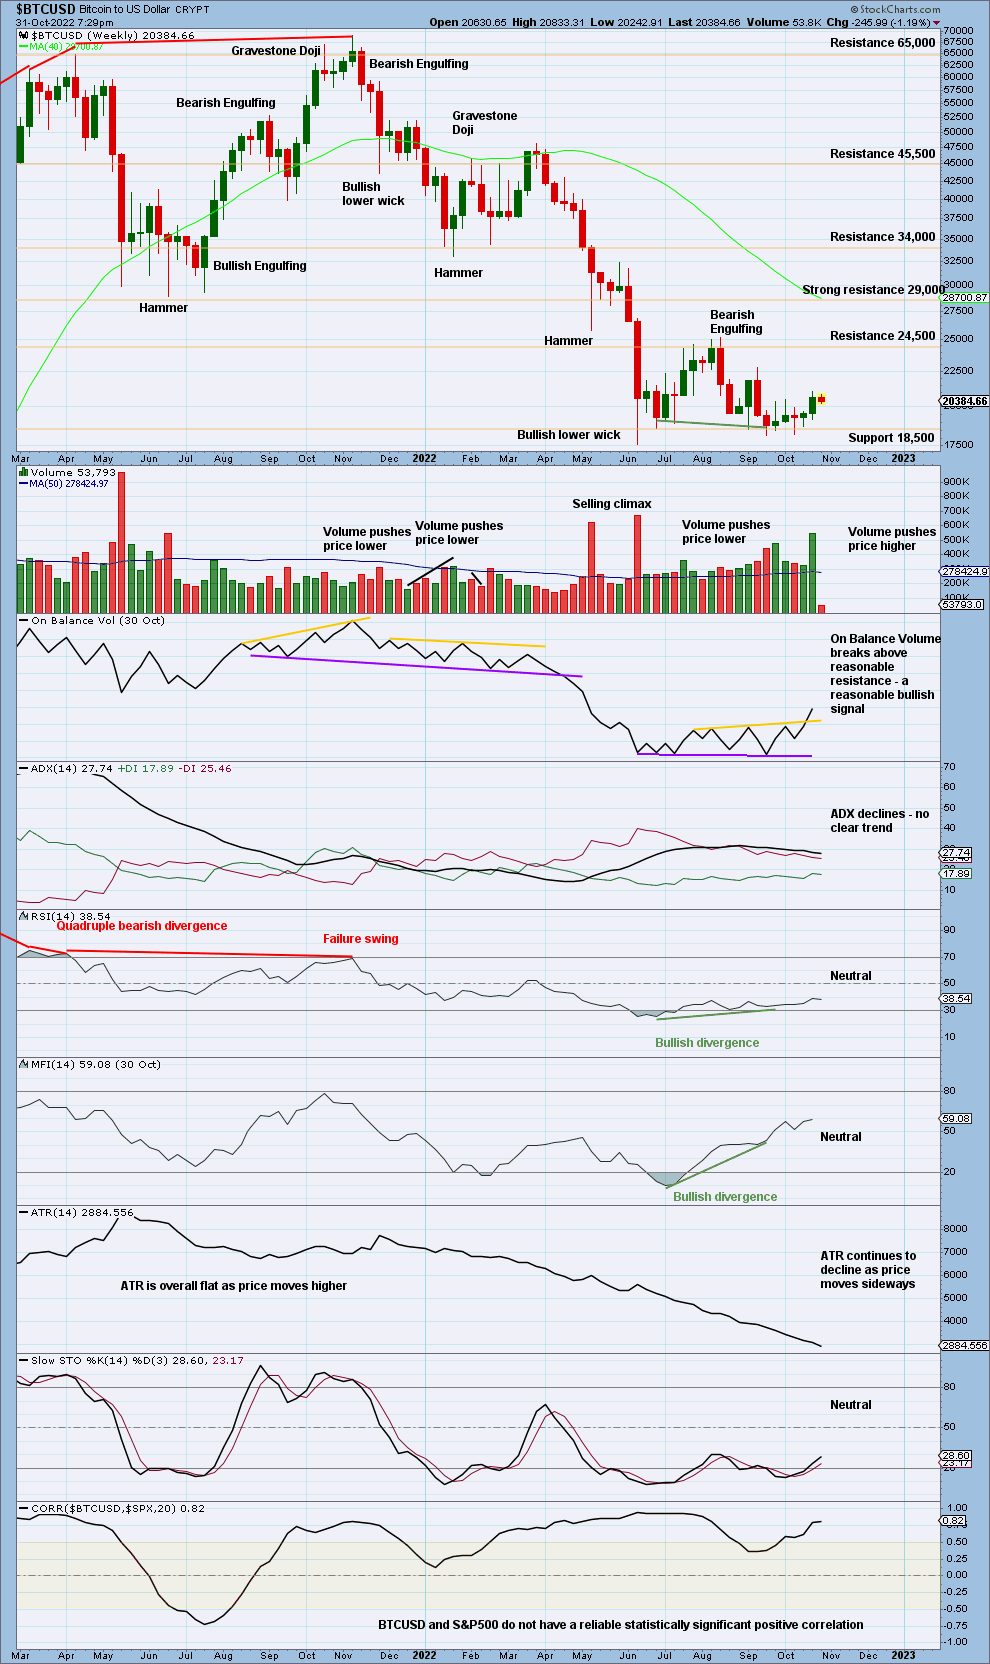
Click chart to enlarge.
RSI reached oversold at the low. This has happened only once before on the weekly chart in Bitcoin’s price history, in January 2015. That formed with a sustained low.
There is again bullish divergence between price on a closing basis and both of RSI and Money Flow Index.
Price is consolidating with resistance about 24,500 and support about 18,500.
Within this larger consolidation, volume this week has strongly increased to push price higher and On Balance Volume gives a reasonable bullish signal. An upwards breakout above 24,500 looks highly likely. On Balance Volume also exhibits short-term bullish divergence.
DAILY
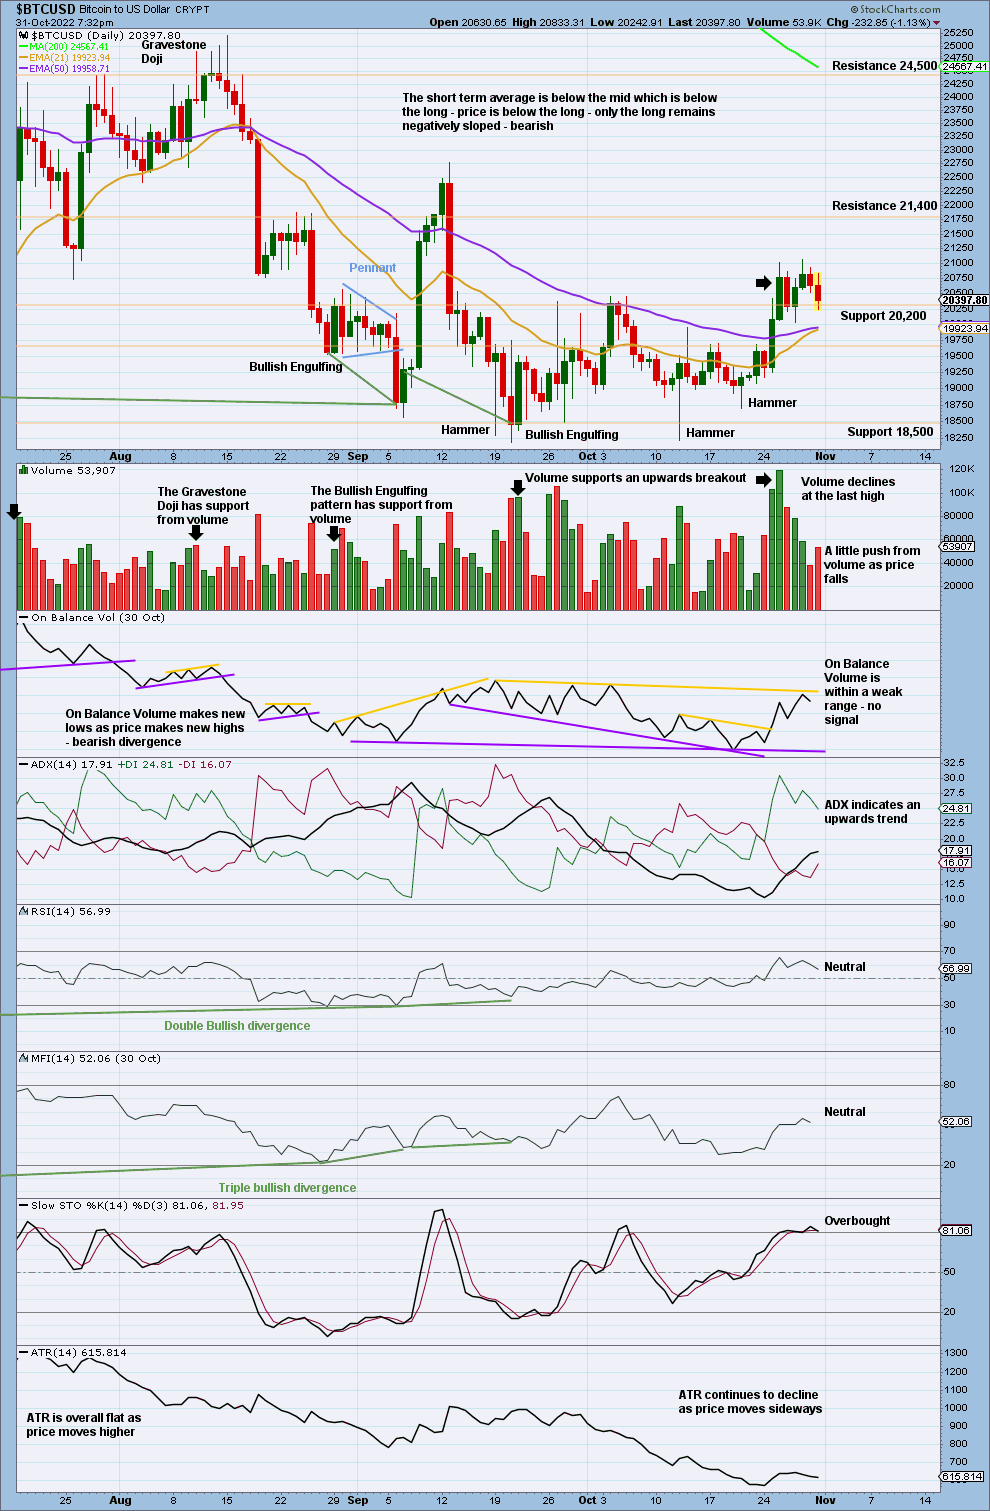
Click chart to enlarge.
Bitcoin’s lows are much harder to identify than its highs.
On October 25, 2022, price broke above resistance about 20,200 with support from volume. Thereafter, price is now testing support in this area (this is normal behaviour). If support holds here, then it would be normal for price to now move high to next resistance about 21,400.
Published @ 05:37 p.m. ET.
—
Careful risk management protects your investments.
Follow my two Golden Rules:
1. Invest only funds you can afford to lose.
2. Have an exit plan for both directions – where or when to take profit, and when to exit a losing investment.
—
New updates to this analysis are in bold.
—
 Save as PDF