October 5, 2022: NASDAQ Elliott Wave and Technical Analysis – Video and Charts
Downwards movement remains above the invalidation point of that last analysis but now suggests the bear market is not over, so a new target is calculated.
Note that the S&P500 and NASDAQ do not always find highs and lows together. The last all-time high for the S&P500 was on January 4, 2022, whereas the last all-time high for NASDAQ was November 22, 2021.
MAIN ELLIOTT WAVE COUNT
QUARTERLY CHART
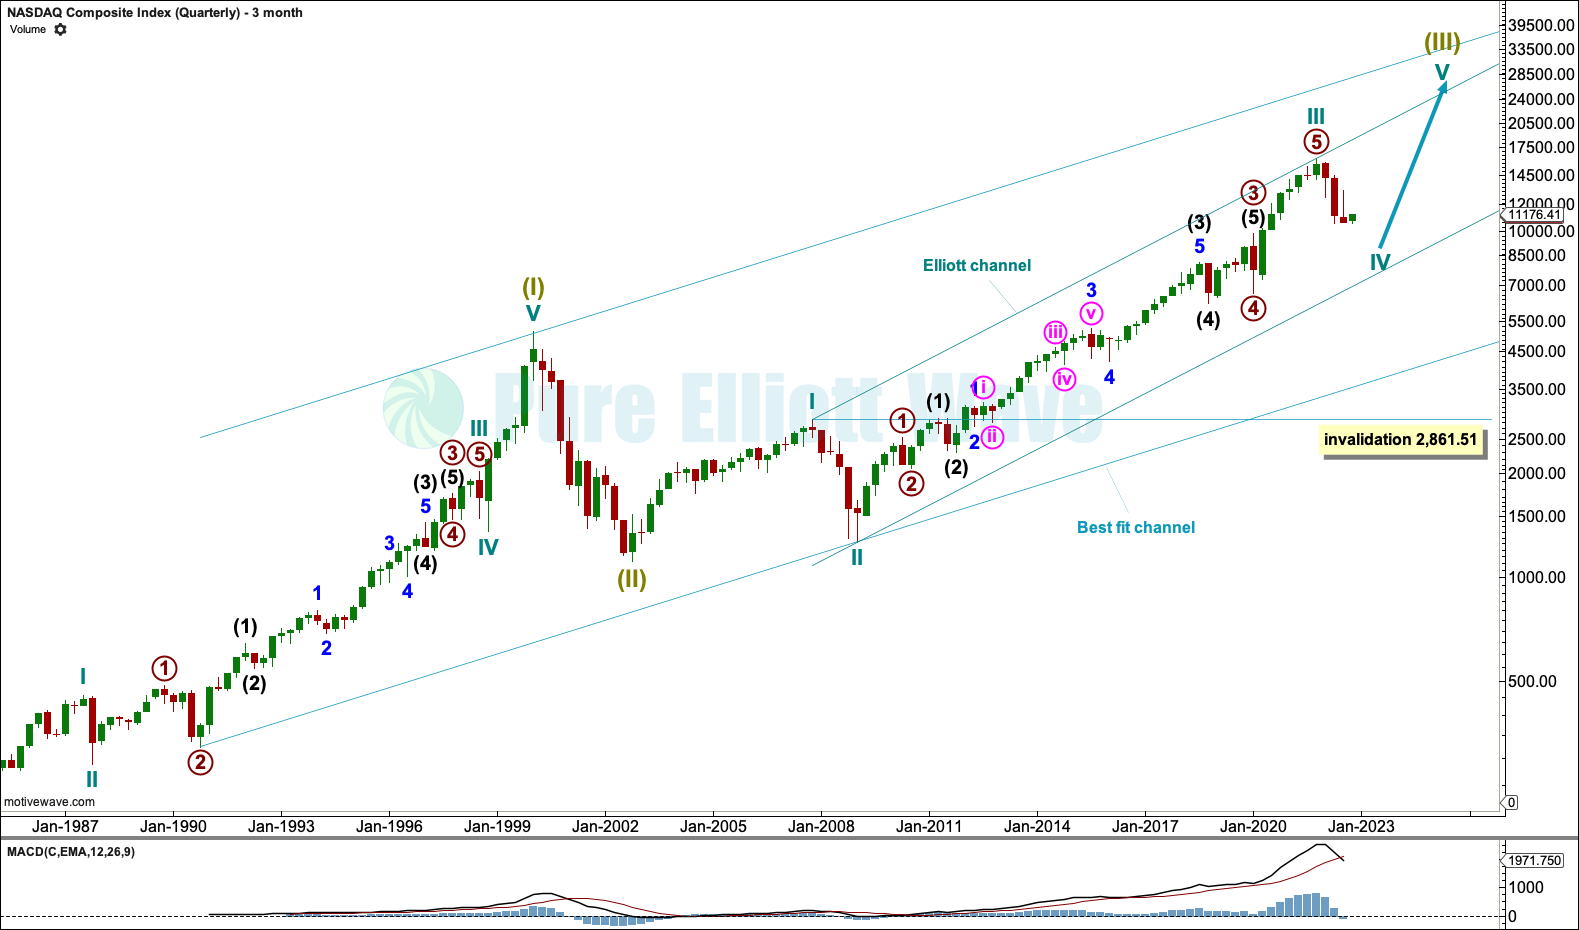
Click chart to enlarge.
MONTHLY CHART
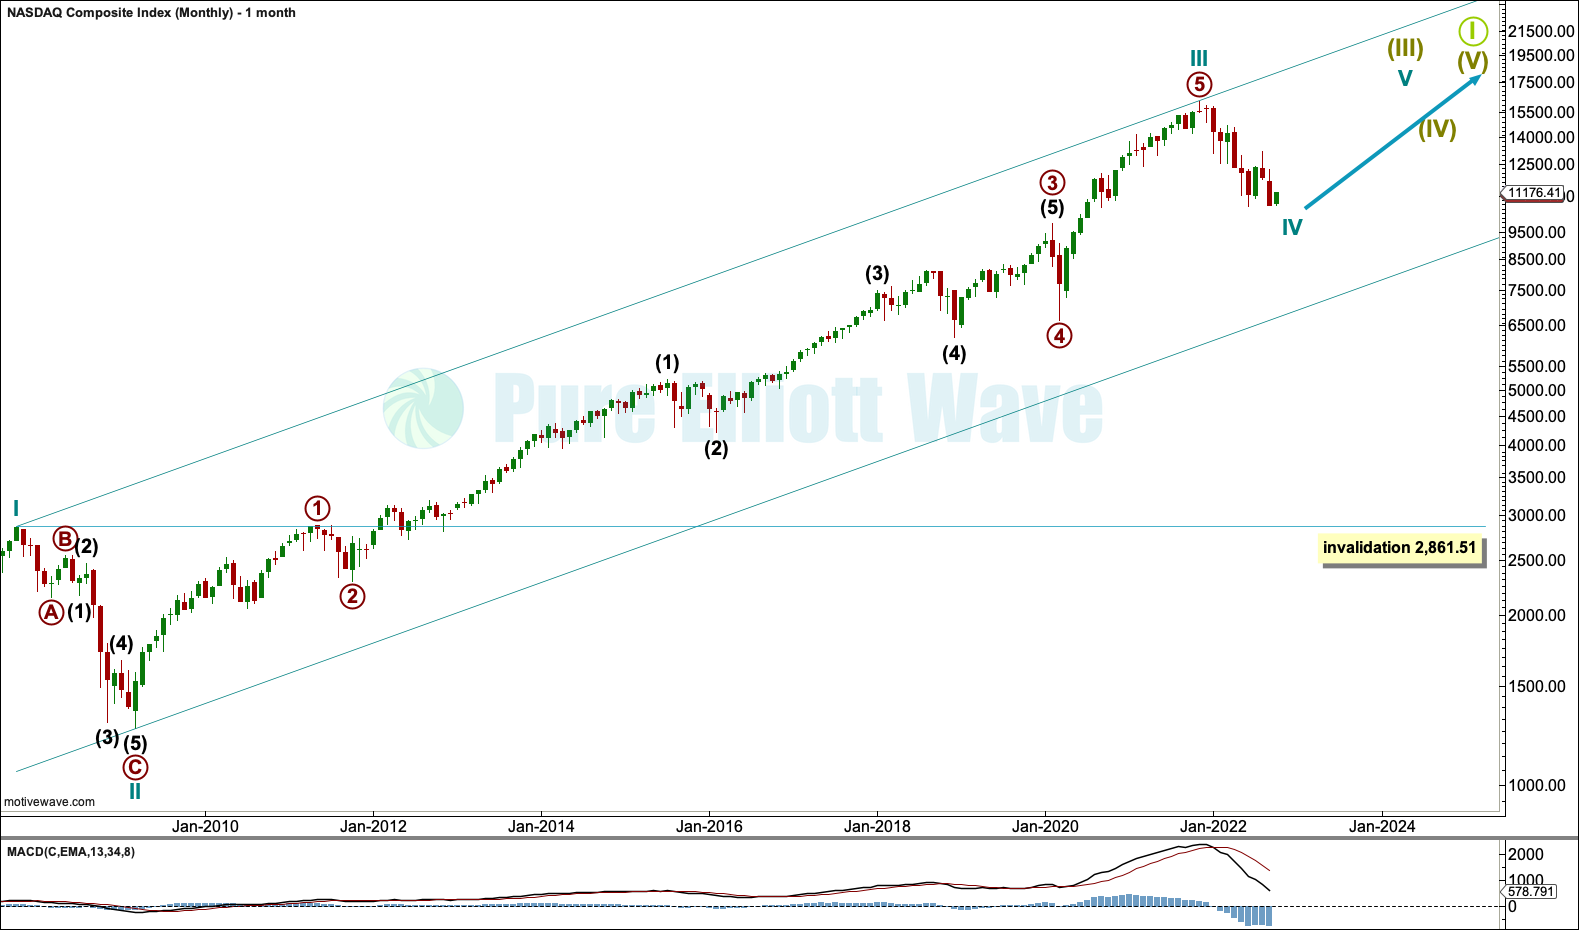
Click chart to enlarge.
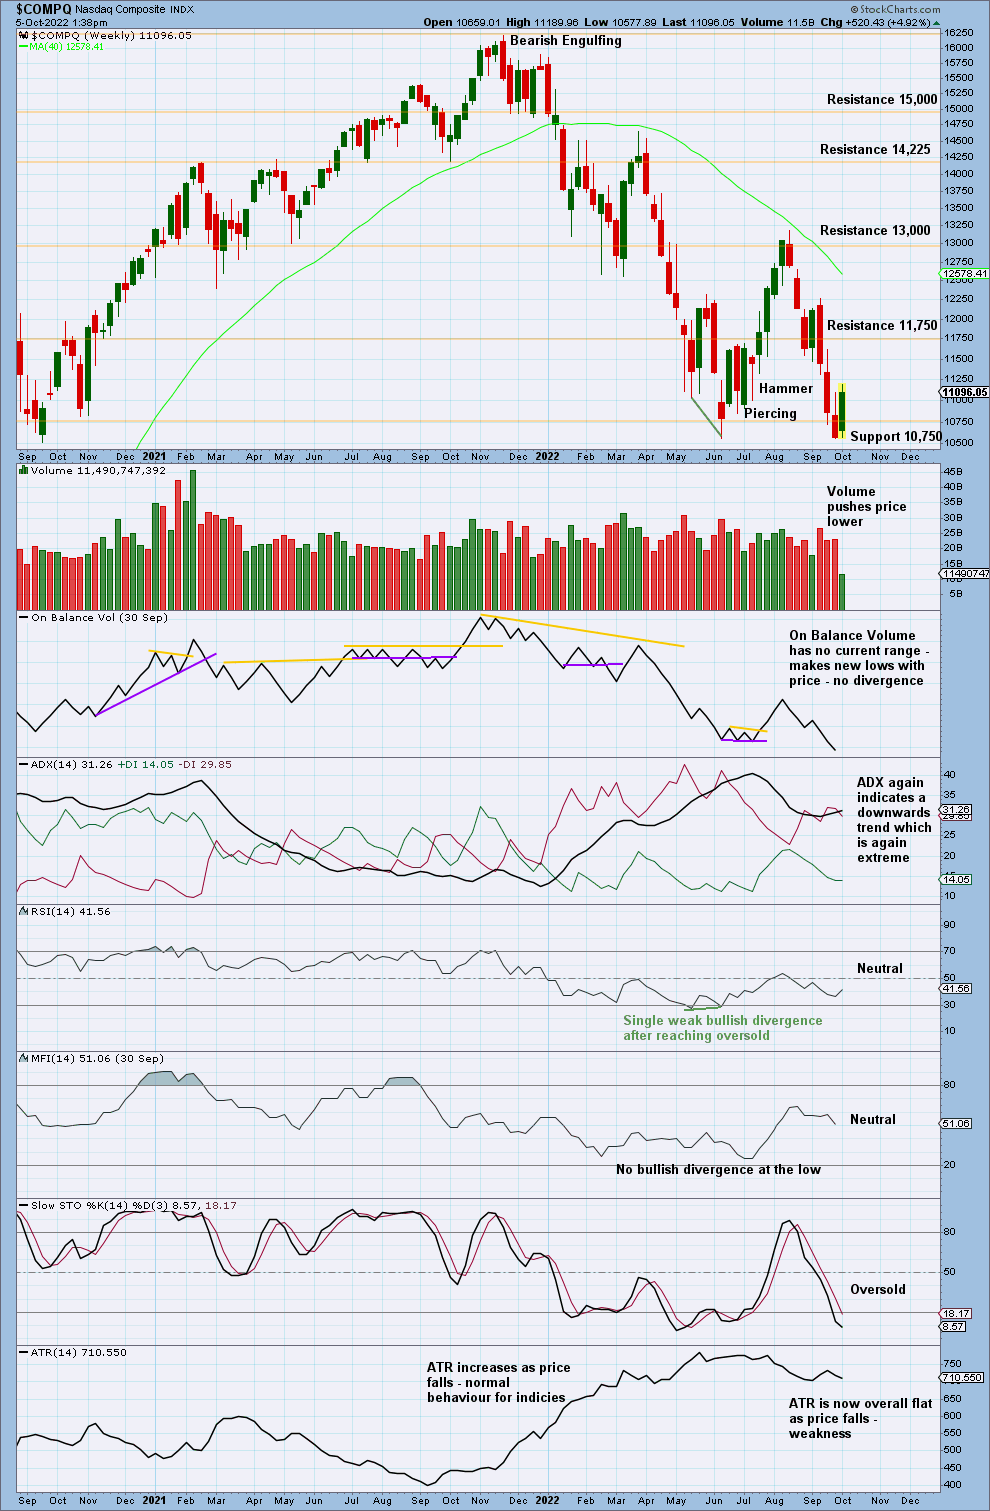
WEEKLY CHART
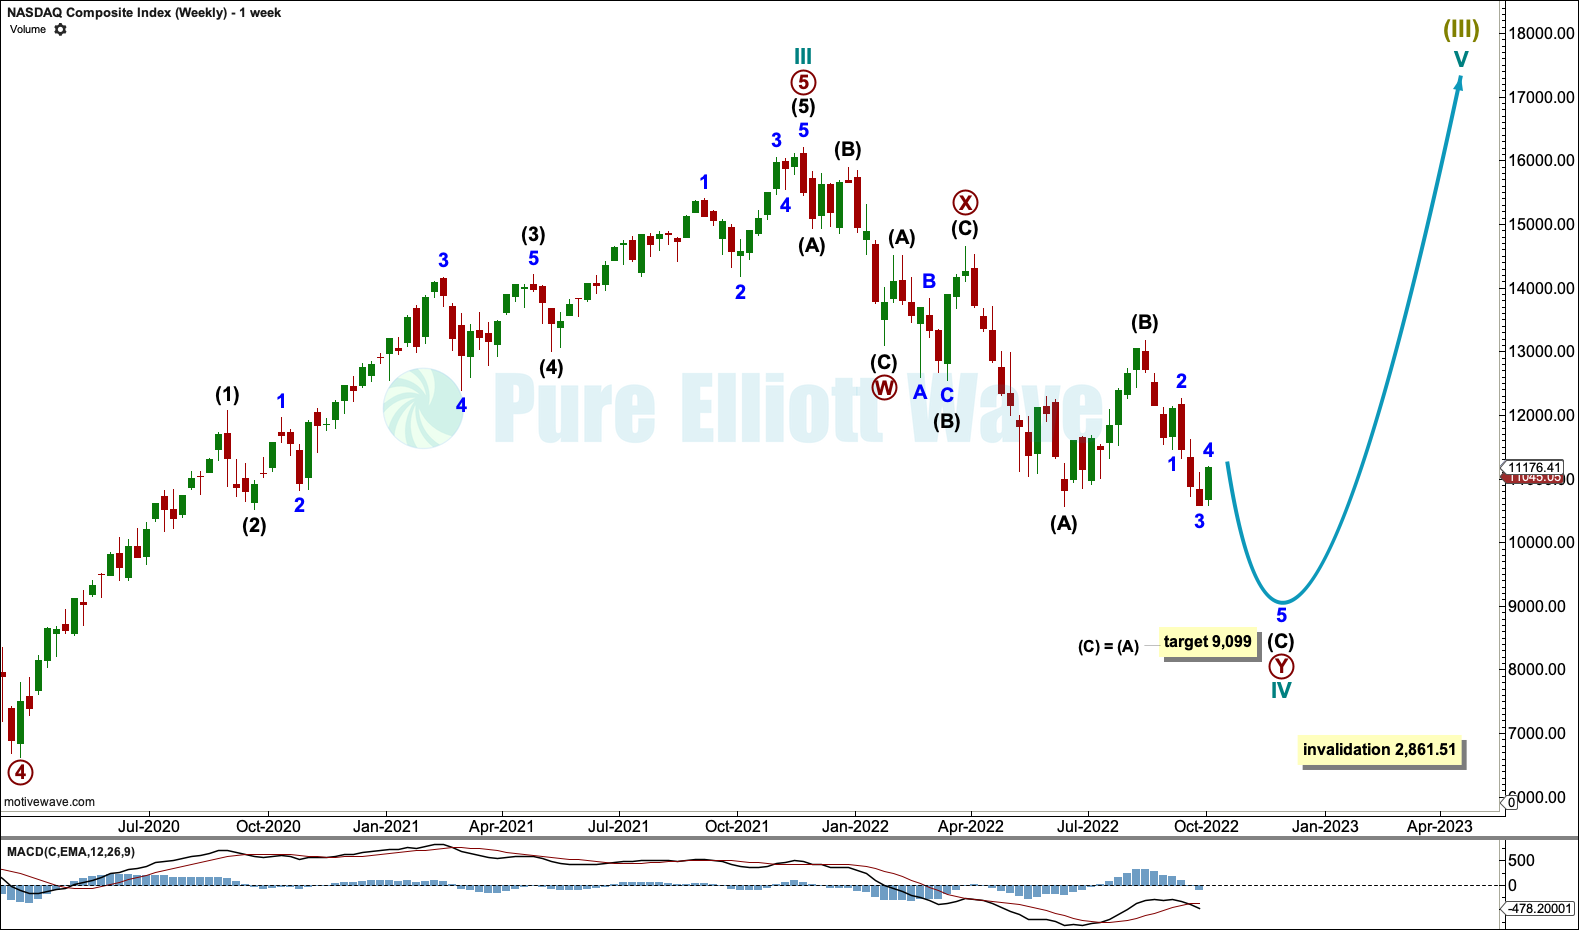
Click chart to enlarge.
DAILY CHART
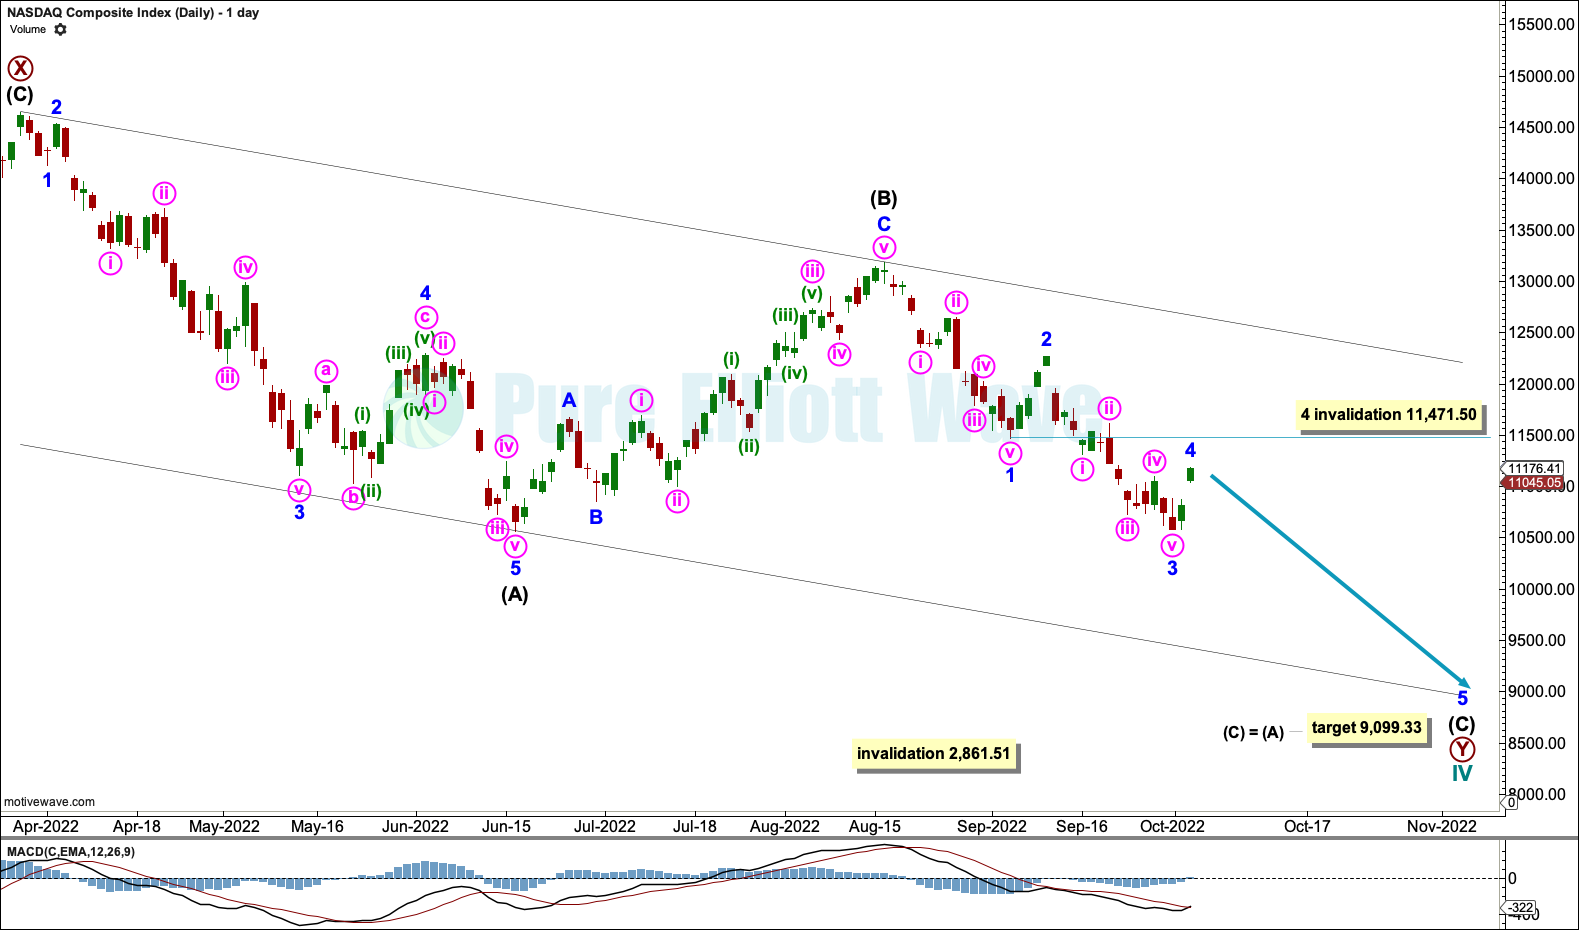
Click chart to enlarge.
If this wave count is invalidated in the short term with a new high above 11,471.50 by any amount at any time frame, then it would be possible that the bear market may be over.
Minor wave 4 may not move into minor wave 1 price territory above 11,471.50. A new high above 11,471.50 may not be minor wave 4, so at that stage minor waves 4 and 5 may be over.
TECHNICAL ANALYSIS
WEEKLY CHART
Click chart to enlarge.
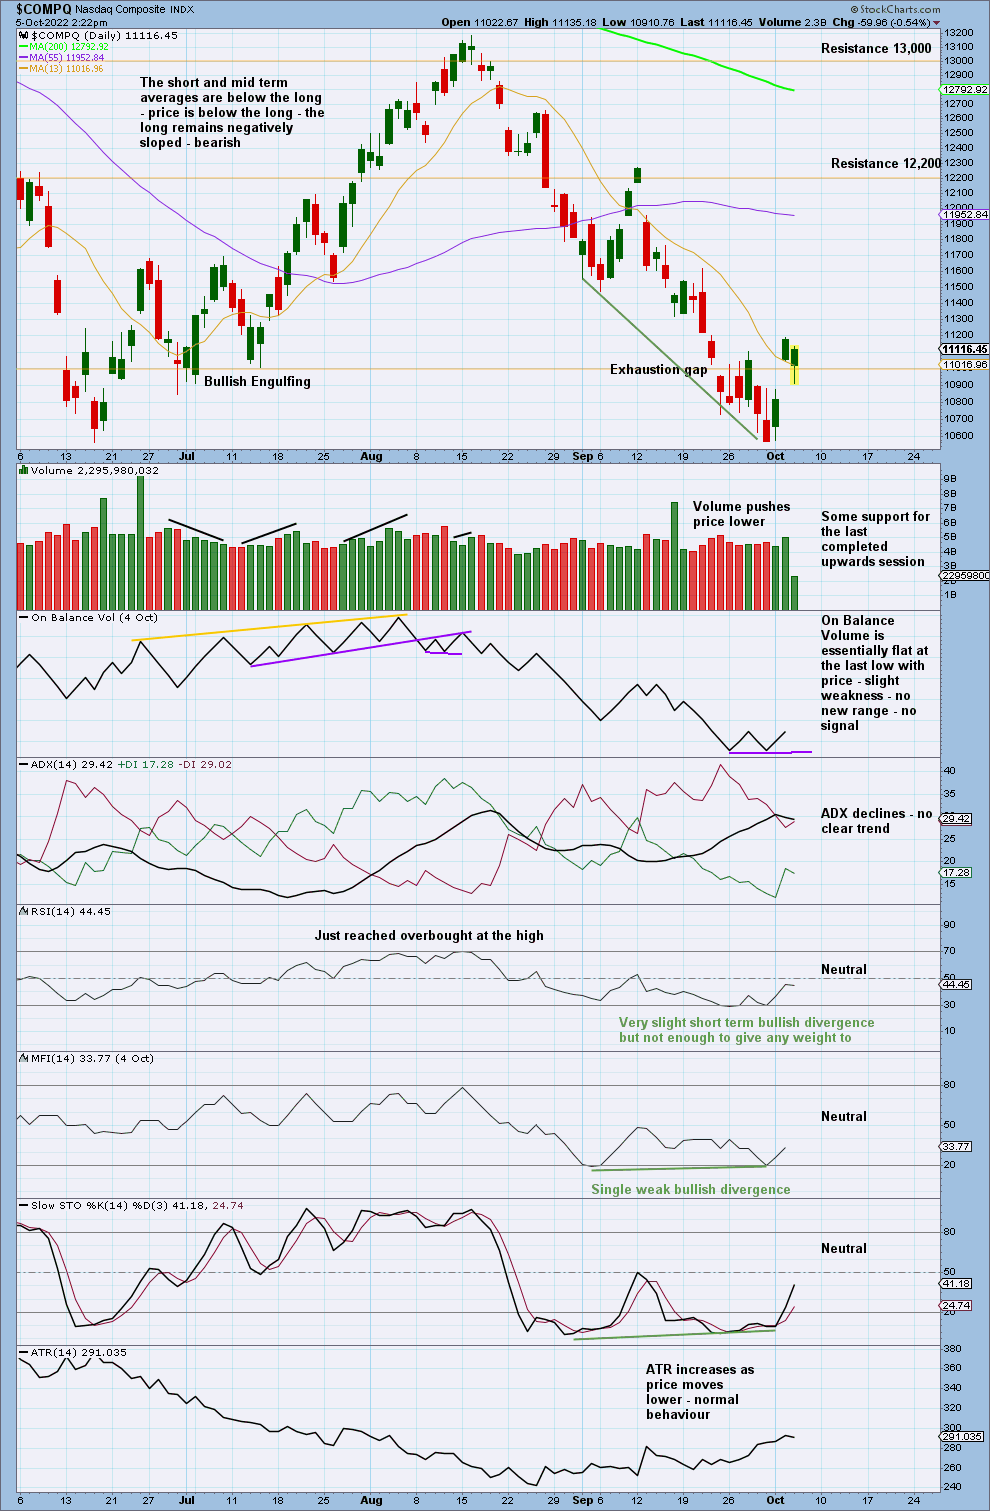
DAILY CHART
Click chart to enlarge.
Published @ 08:54 p.m. ET.
—
Careful risk management protects your trading account(s).
Follow my two Golden Rules:
1. Always trade with stops.
2. Risk only 1-5% of equity on any one trade.
—
New updates to this analysis are in bold.
—
 Save as PDF