November 3, 2022: TSLA Technical Analysis – Video and Charts
Summary: Currently, Tesla may move lower to support about 180.
A breakout above 400 would be very bullish for the long term.
TECHNICAL ANALYSIS
MONTHLY
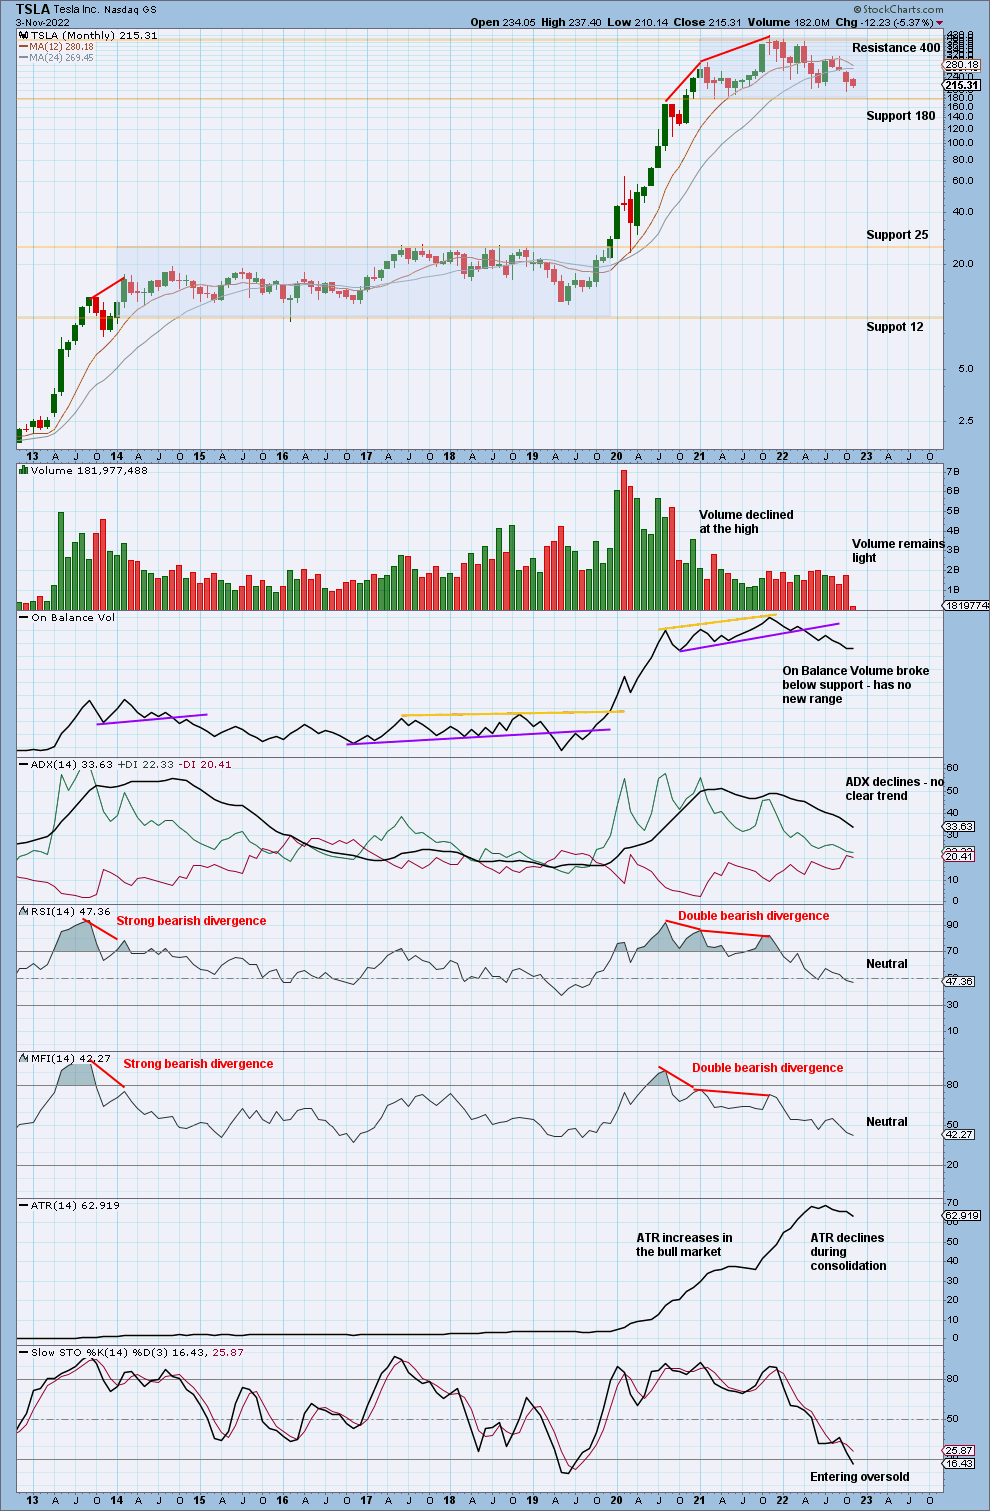
Click chart to enlarge.
Tesla is currently within a large consolidation with resistance about 400 and support about 180. The longer-term trend is up, so an upwards breakout is expected as most likely. The longer the consolidation lasts, the longer and stronger the resulting breakout may be.
The last consolidation lasted from 2013 to 2019. The resulting breakout moved from resistance at 25 to create new resistance about 400.
WEEKLY
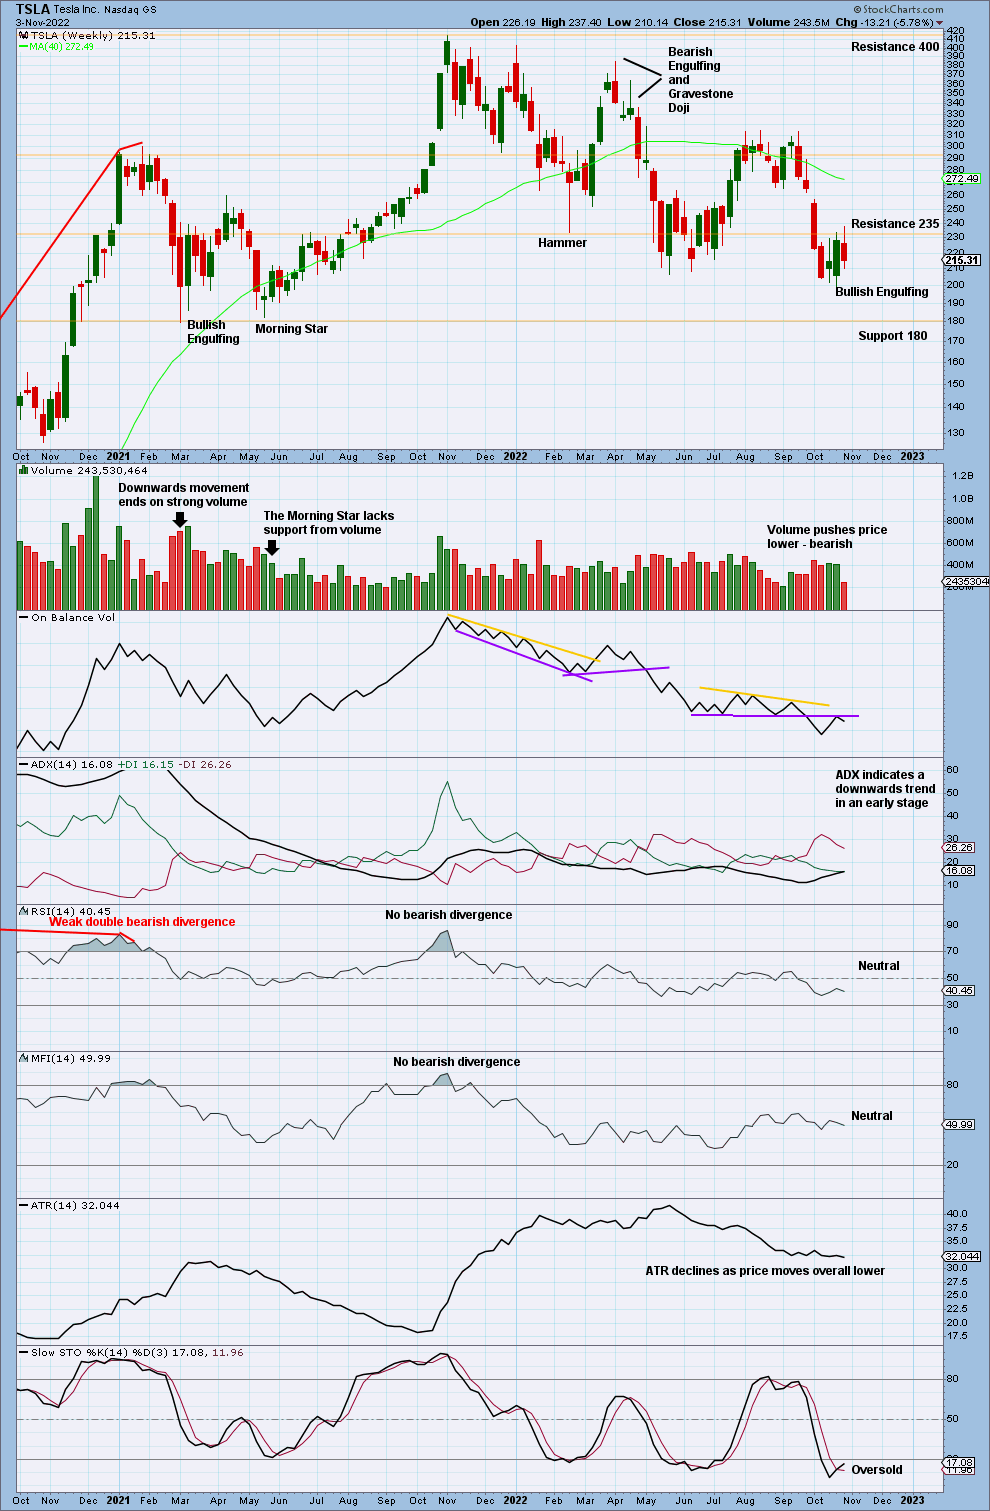
Click chart to enlarge.
For the mid term, a choppy downwards swing within the larger consolidation may be expected to overall continue to support about 180. At the weekly time frame, there is a downwards trend in an early stage and RSI is not extreme. There is room below for price to continue lower.
The Bullish Engulfing pattern has no follow through; it may not indicate a sustained low.
DAILY
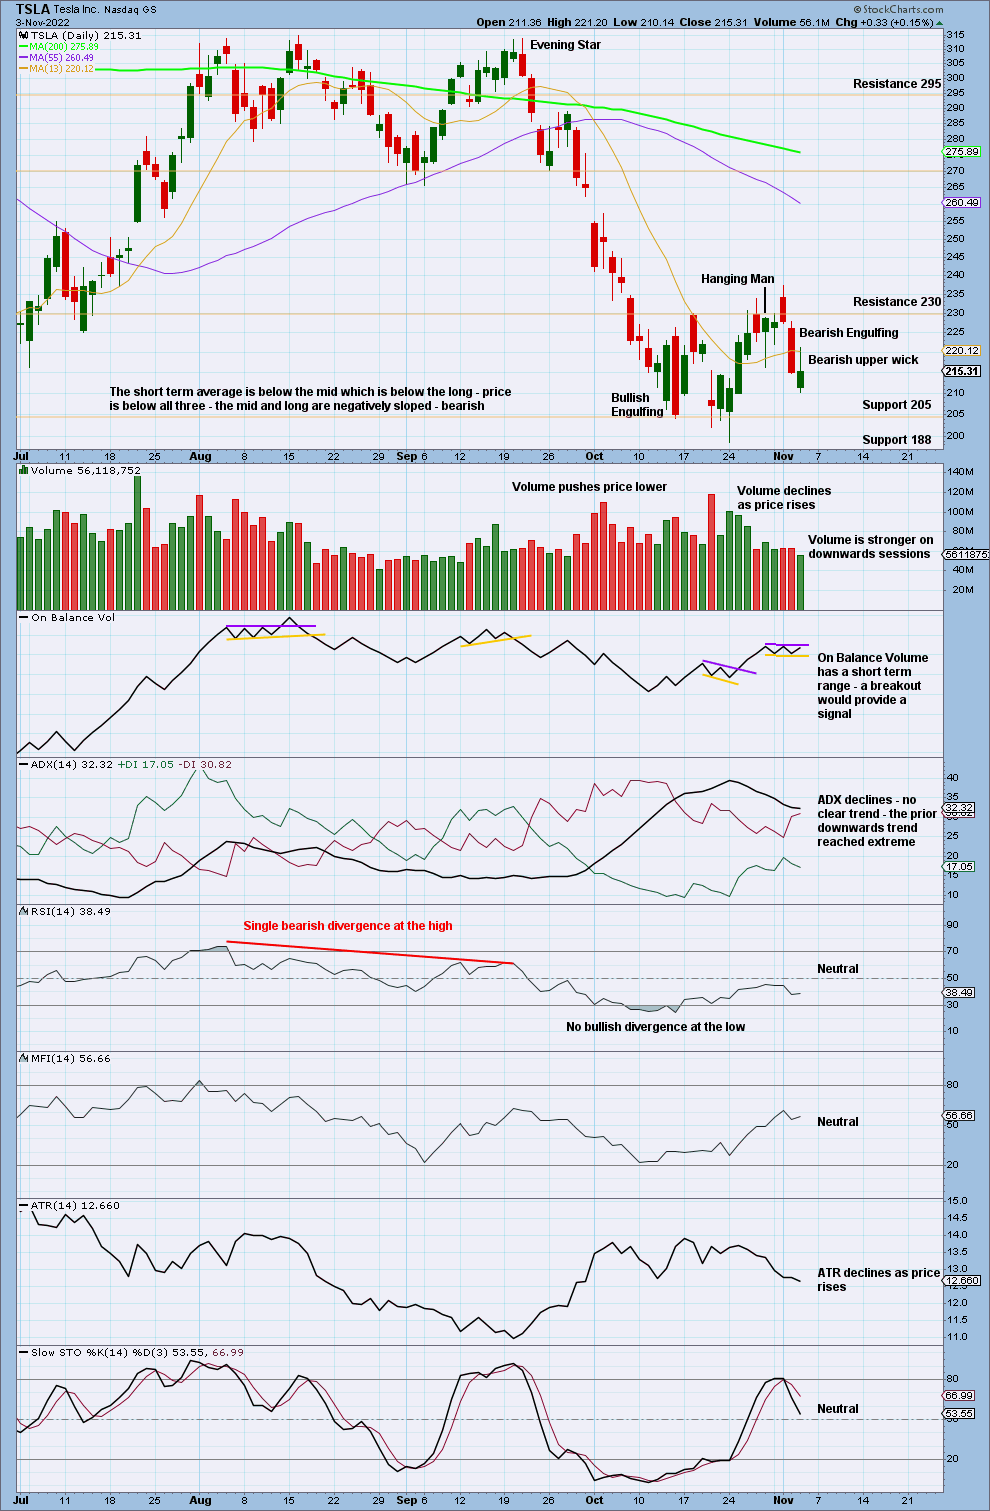
Click chart to enlarge.
For the short term, the volume profile is bearish. Price recently has found resistance about 230. Expect a downwards swing to continue to support about 205 and then to 188 and below that about 180.
ADX reached extreme and RSI reached oversold for the last downwards movement. The next downwards swing at the daily time frame may be the last in a larger trend at the weekly time frame, within the larger consolidation at the monthly time frame.
Published @ 06:16 p.m. ET.
—
Careful risk management protects your investments.
Follow my two Golden Rules:
1. Invest only funds you can afford to lose.
2. Have an exit plan for both directions – where or when to take profit, and when to exit a losing investment.
—
New updates to this analysis are in bold.
–