January 3, 2023: FTSE Elliott Wave and Technical Analysis – Video and Charts
Summary: Upwards movement may continue towards a target at 8,385. If price makes a new low below 6,516, then a deeper multi-week bearish movement may continue that would not be expected to move below 4,837.
ELLIOTT WAVE COUNT
QUARTERLY CHART
Click chart to enlarge.
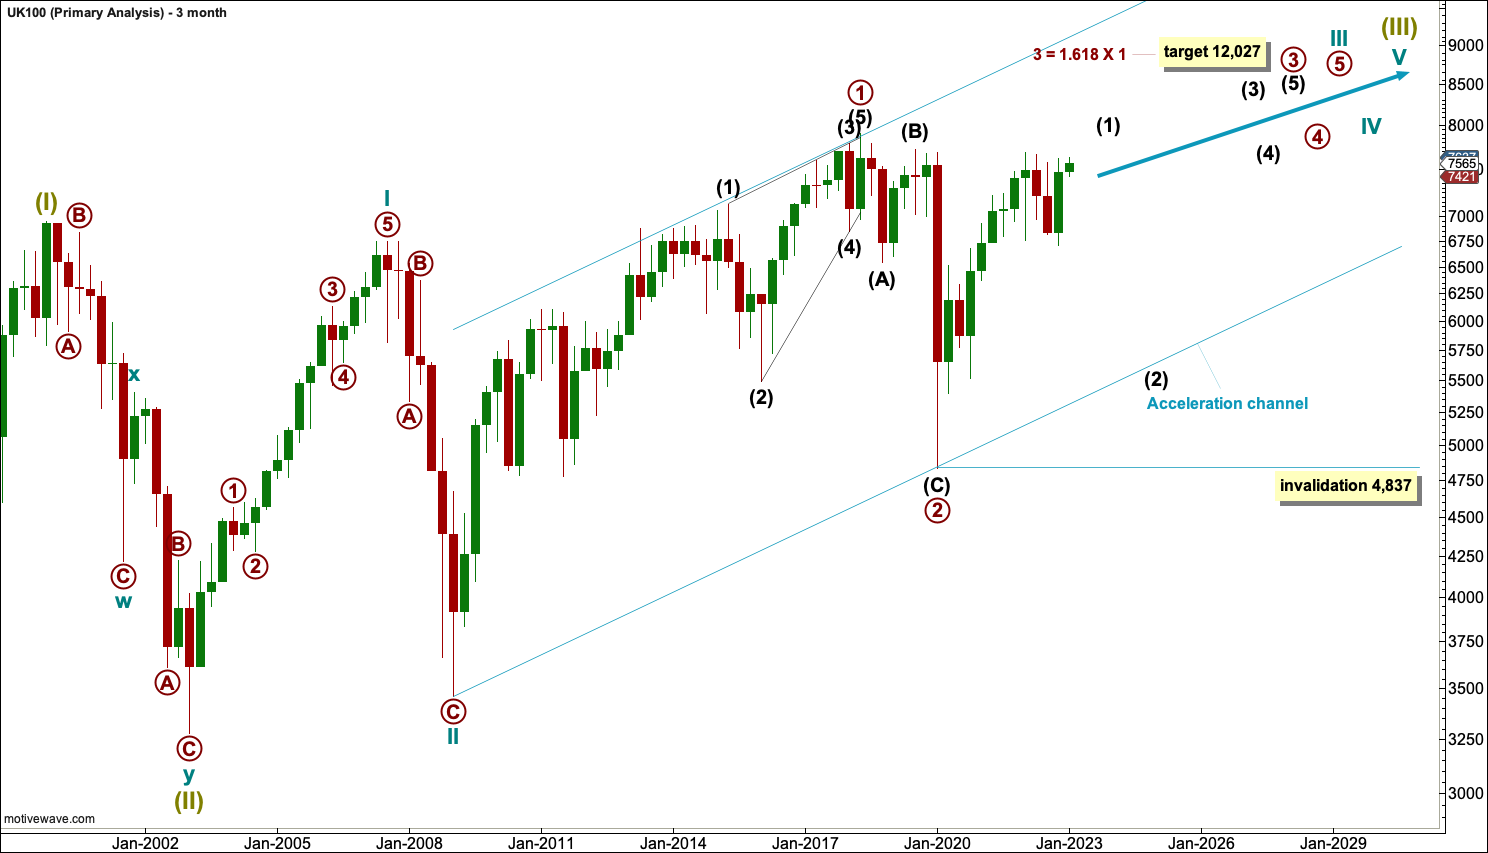
This analysis sees Super Cycle wave (II) over in January 2003 at the end of the Dotcom Crash, There, a Super Cycle wave (III) begins.
Super Cycle wave (III) is likely to extend. Within Super Cycle wave (III), cycle waves I and II may be complete. Cycle wave II is seen as over in January 2009, at the end of the Global Financial Crisis.
Within cycle wave III, primary waves 1 and 2 look likely to be complete. Primary wave 2 may have completed at the end of the Covid crash in January 2020.
This wave count now sees primary wave 3, within cycle wave III within Super Cycle wave (III), in its early stages. This is a very bullish wave count.
Within primary wave 3: Intermediate wave (1) may not be complete and intermediate wave (2) (when it arrives) may not move beyond the start of intermediate wave (1) below 4,837.
The target is calculated using a common Fibonacci ratio for third waves. Primary wave 3 would reach 1.618 the length of primary wave 1 at 12,027.
Draw an acceleration channel about primary waves 1 and 2. Draw the first trend line from the start of primary wave 1 to the end of primary wave 2, then place a parallel copy on the end of primary wave 1. The lower edge of this channel may show where intermediate wave (2) may find support if it is deep enough. The upper edge may provide resistance until the power of intermediate wave (3) breaks through.
MONTHLY CHART
Click chart to enlarge.
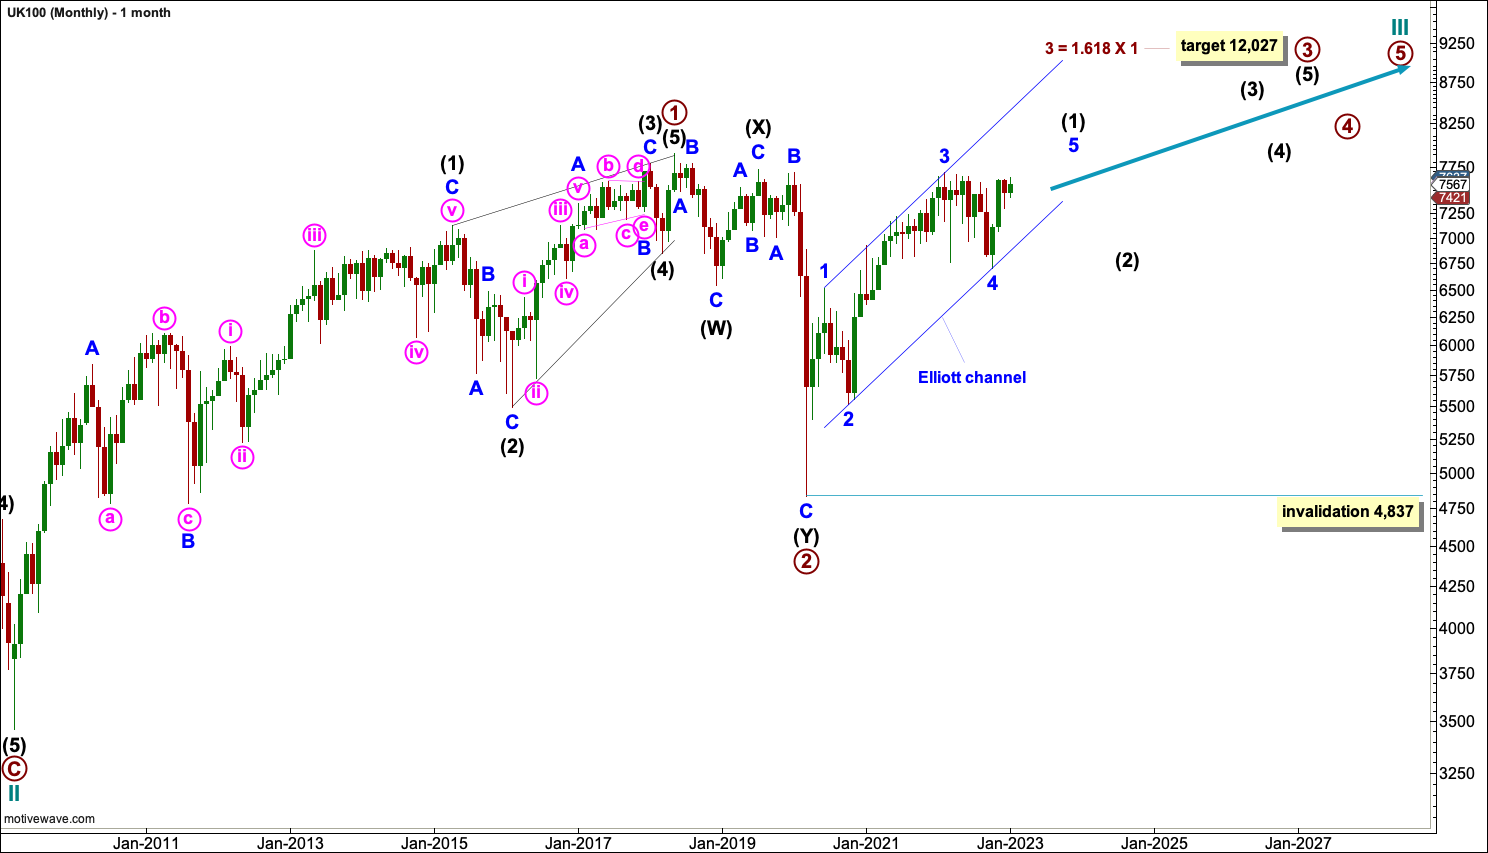
Primary wave 1 fits as a leading contracting diagonal. Within leading diagonals, sub-waves 2 and 4 must subdivide as zigzags and sub-waves 1, 3 and 5 are most commonly zigzags but may also appear to be impulses. In this example all sub-waves subdivide as zigzags. These rules are as written in the classic “Elliott Wave Principle” by Frost and Prechter and in my own book “Pure Elliott Wave“.
Primary wave 2 fits as a completed double zigzag that was a 0.69 depth of primary wave 1. Second wave corrections following leading diagonals in first wave positions are commonly deep; this part of the wave count fits common behaviour.
Primary wave 3 may have begun. Primary wave 3 must subdivide as an impulse. Within primary wave 3, intermediate wave (1) may be incomplete. When it arrives, intermediate wave (2) may not move beyond the start of intermediate wave (1) below 4,837.
WEEKLY CHART
Click chart to enlarge.
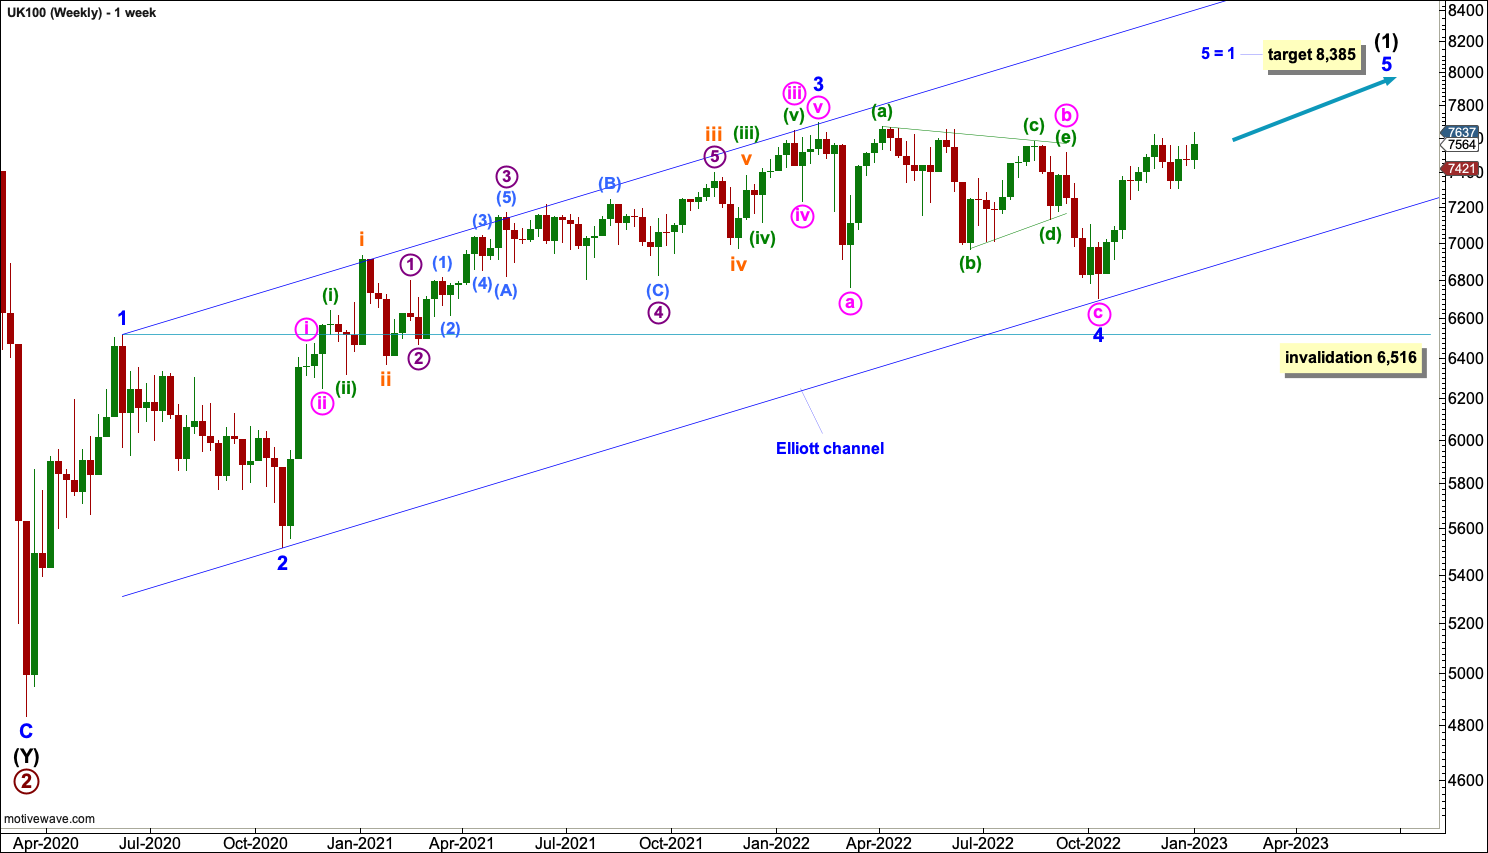
Intermediate wave (1) may be an incomplete impulse. Within the impulse, there is no Fibonacci ratio between minor waves 3 and 1. Minor wave 3 is extended, whereas minor wave 1 is not. This allows for minor wave 5 to also extend and meet Elliott wave rules, although the most common relationship for a fifth wave is for it to meet equality in length with the first wave. Minor wave 5 would reach equality in length with minor wave 1 at 8,385.
A channel is drawn about intermediate wave (1) using Elliott’s first technique. The first trend line is drawn from the ends of minor waves 1 to 3, then a parallel copy is placed on the end of minor wave 2. The lower edge perfectly shows where minor wave 4 found support. Minor wave 5 may end either mid way within the channel, or it may find resistance about the upper edge if it gets that high. When the channel is breached by downwards movement, that may be taken as an indication that intermediate wave (1) may be over and intermediate wave (2) may have begun.
TECHNICAL ANALYSIS
MONTHLY CHART
Click chart to enlarge.
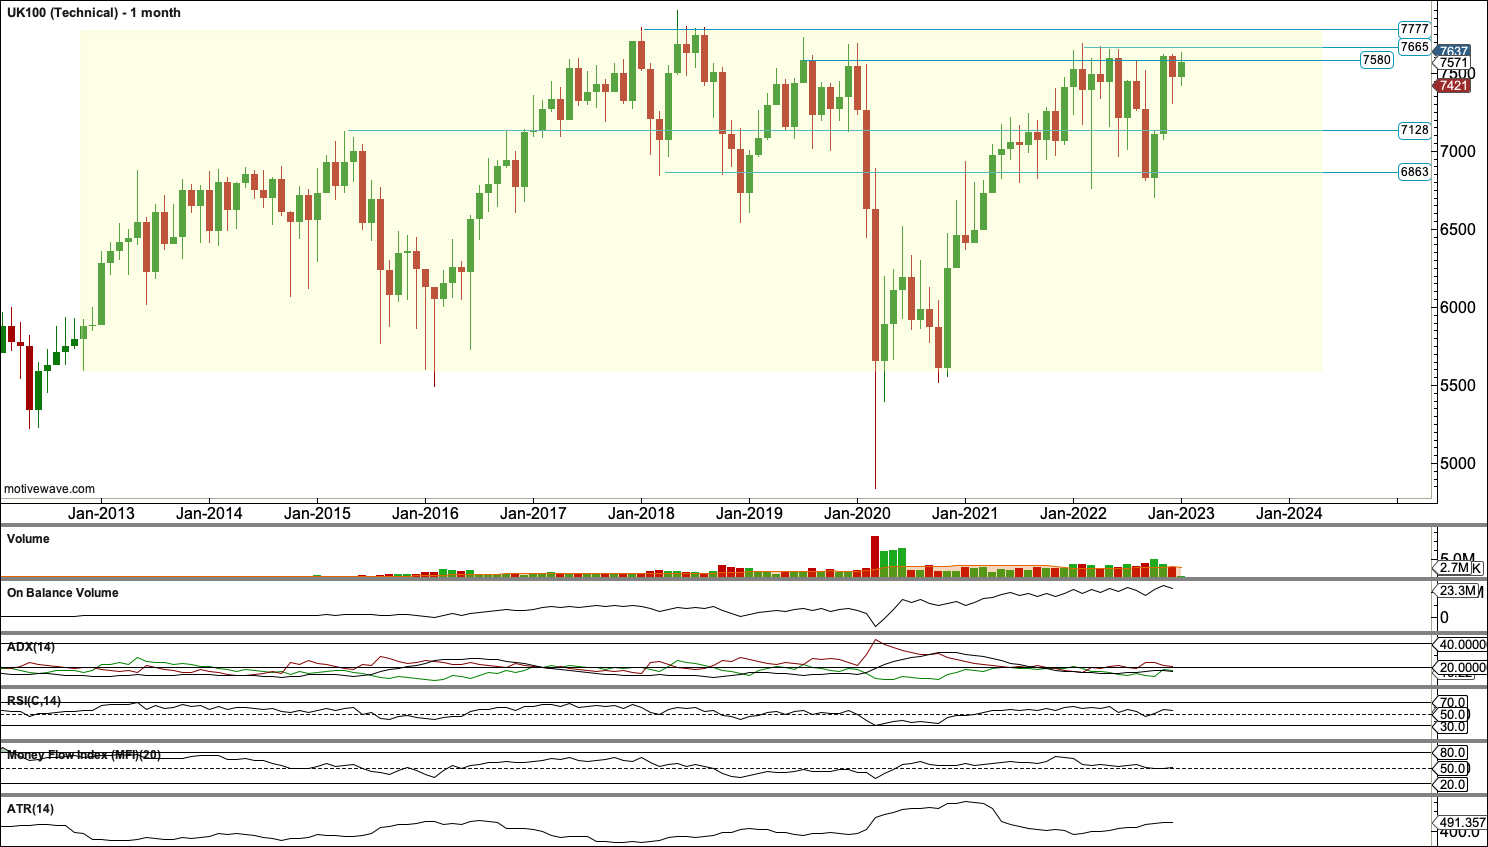
Price is within a large consolidation beginning about January 2013 with resistance about 7,777 to 7,665 and support about 5,597. Within this zone, there is a smaller consolidation with resistance about 7,580 and support about 6,863.
There is no bullish candlestick reversal pattern at the low of March 2020, and the first candlestick off the low for April 2020 did not exhibit an increase in volume.
There was some increase in volume for May and June 2020. October 2022 also exhibits an increase in volume for an upwards month, but November did not follow through and saw a decline in volume. Overall, volume has been increasing up from the low in March 2020, so the volume profile is bullish.
On Balance Volume is making highs prior to price. This is bullish.
ADX is currently declining, indicating no clear trend. The -DX line is above the +DX line, so no potential trend change has yet been indicated. The prior downwards trend to March 2020 did reach extreme.
RSI is currently neutral. It did not reach oversold in March 2020 and did not exhibit bullish divergence.
MFI is also neutral and did not reach oversold in March 2020 and did not exhibit bullish divergence.
ATR is showing an increase as price rises. This is bullish.
Overall, there is some support for the Elliott wave analysis from this chart.
WEEKLY CHART
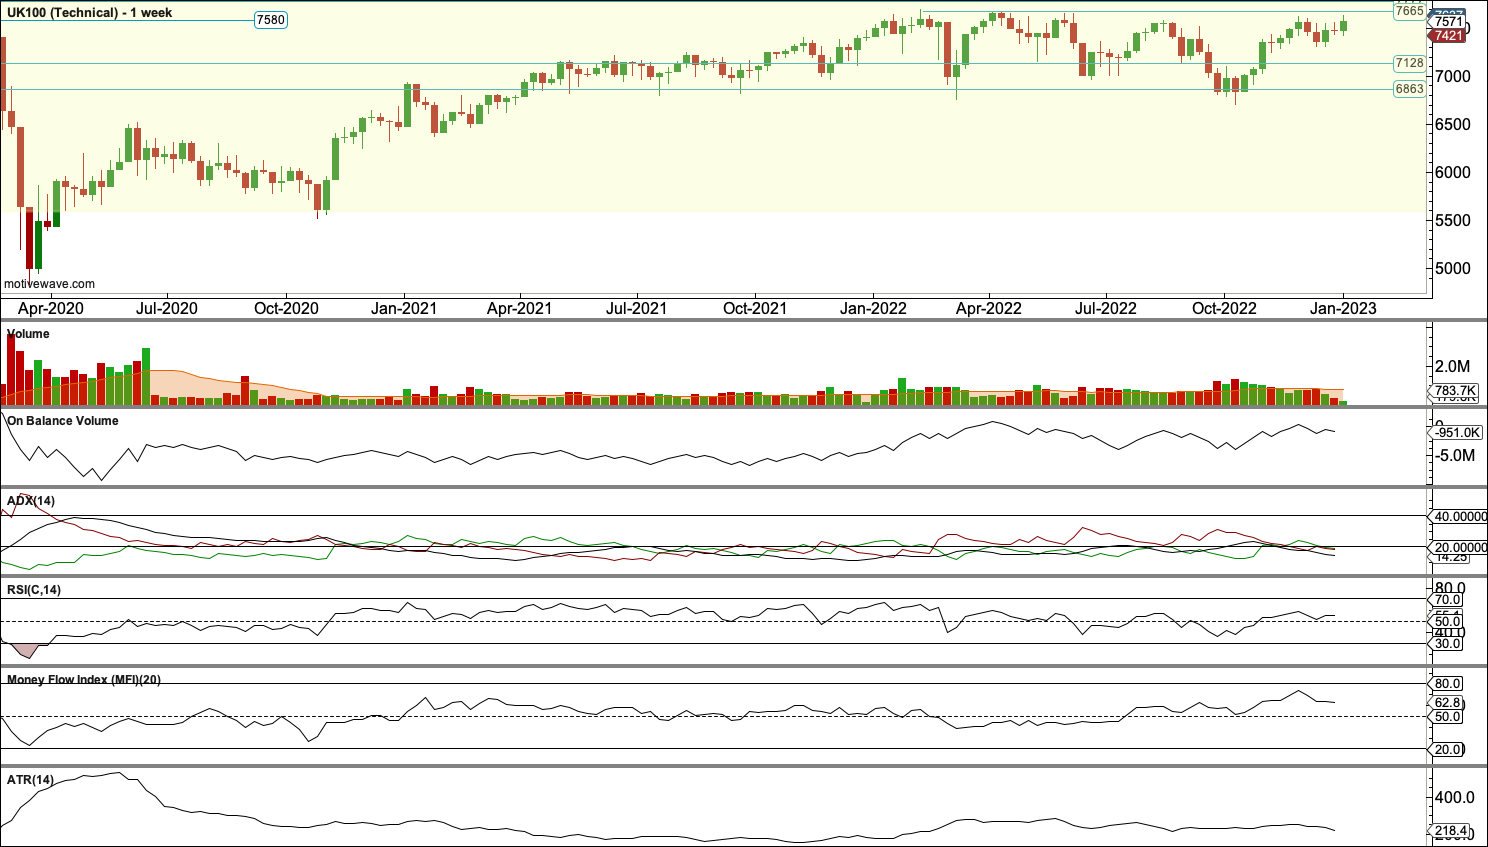
Click chart to enlarge.
Off the low in March 2020 there is a bullish Piercing pattern that has support from volume. This suggests this may be a sustainable low for the long term and supports the Elliott wave count.
The last rise from the low in October 2022 now exhibits declining volume. This also supports the Elliott wave count, a fifth wave may be expected to exhibit weakness.
On Balance Volume gives no recent signal.
ADX is declining and no clear trend is indicated.
RSI reached deeply oversold at the March 2020 low but did not indicate any bullish divergence. It is currently neutral.
MFI exhibited weak bullish divergence in March 2020 and is currently neutral.
ATR is currently flat as price rises. There is weakness in upwards movement.
Overall, this chart supports the Elliott wave count.
Published @ 08:28 p.m. ET.
—
Careful risk management protects your trading account(s).
Follow my two Golden Rules:
1. Always trade with stops.
2. Risk only 1-5% of equity on any one trade.
—
New updates to this analysis are in bold.
—
 Save as PDF