February 3, 2023: XRP-USD Elliott Wave and Technical Analysis – Video and Charts
Summary: XRP may have found a sustainable low in November 2022. A third wave at primary and cycle degree may have begun. A possible target is calculated at 19.49.
The data used for this analysis comes from CryptoCompare.
Last full written analysis of XRP was on November 20, 2022.
All charts are on a semi-log scale.
MAIN ELLIOTT WAVE COUNT
WEEKLY
Click chart to enlarge.
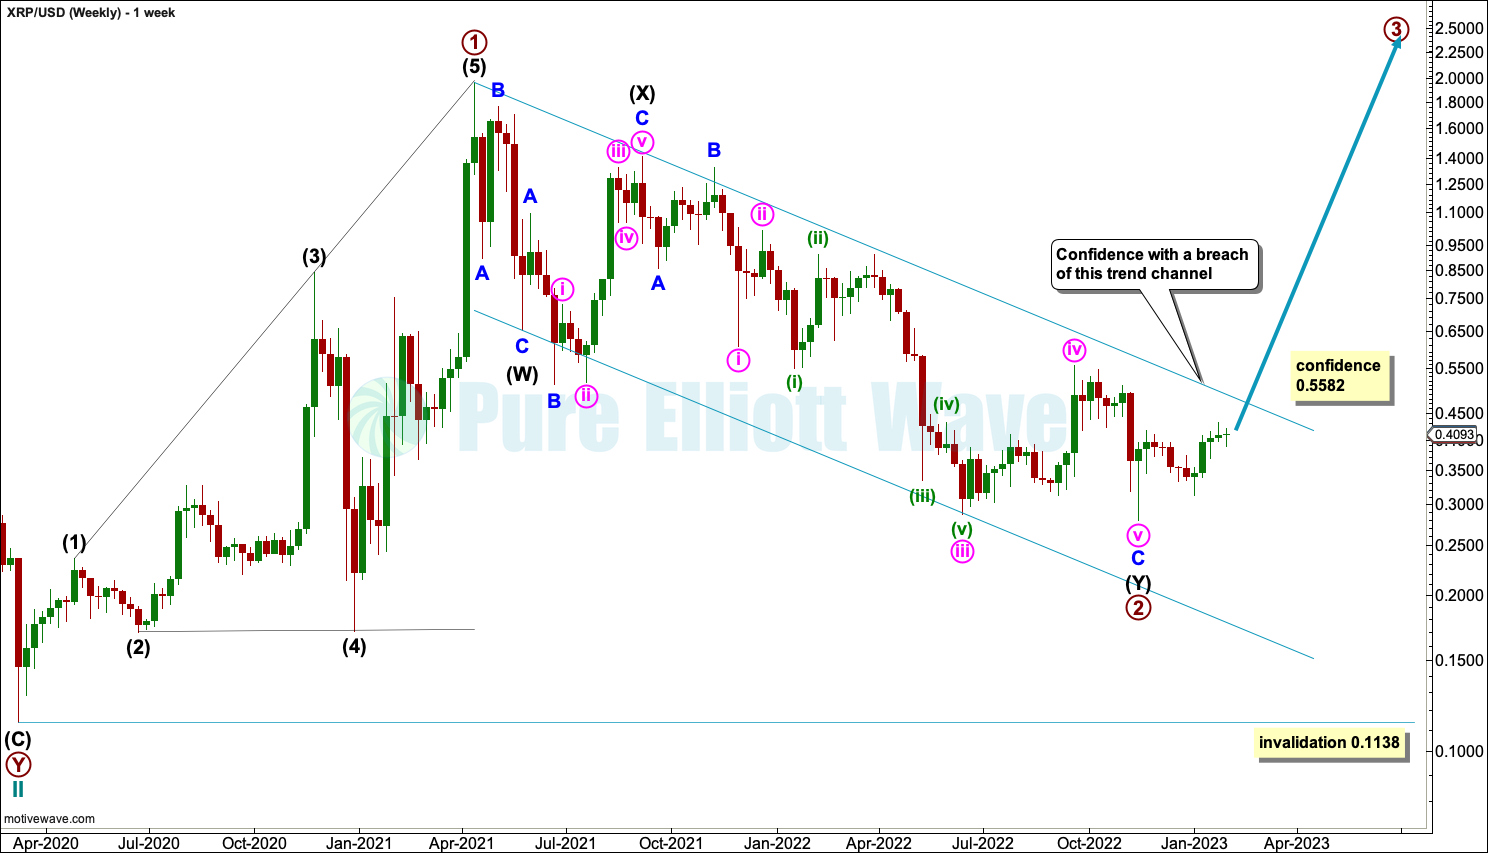
Primary wave 1 may have completed as a leading expanding diagonal.
Primary wave 2 may be complete as a double zigzag.
A conservative channel is drawn about the bear market of primary wave 2 to contain all movement. A breach of this channel would add confidence to this wave count.
If primary wave 2 continues lower as a triple zigzag, then it may not move beyond the start of primary wave 1 below 0.1138.
DAILY
Click chart to enlarge.
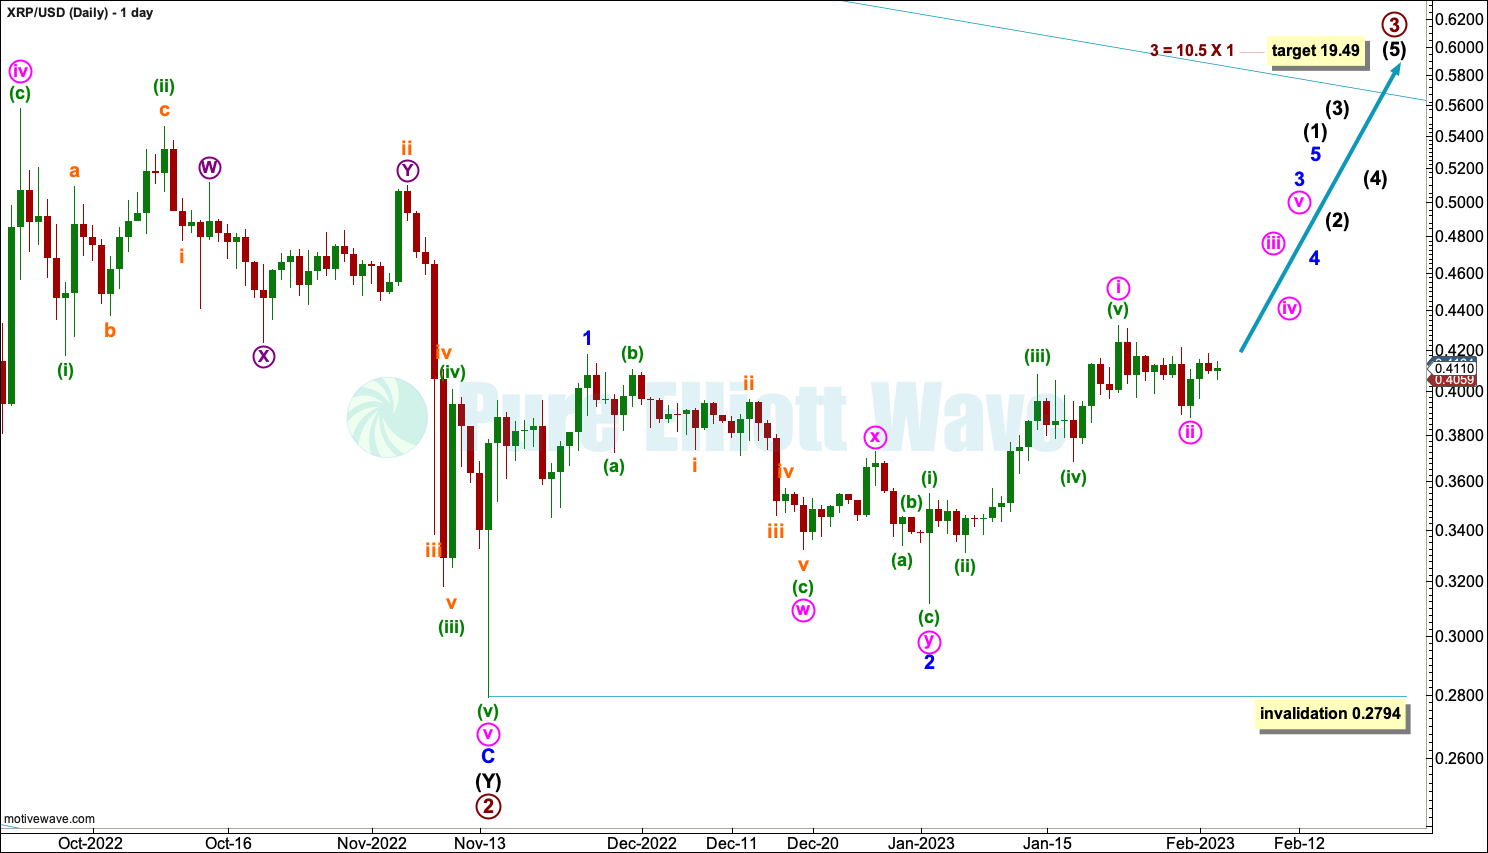
Primary wave 2 may be complete.
Primary wave 3 upwards may have begun. At 19.49 primary wave 3 would reach 10.5 times the length of primary wave 1. This is the relationship between primary waves 3 and 1 within cycle wave 1 (not a Fibonacci ratio).
Within the new trend, intermediate wave (1) may be incomplete.
Within intermediate wave (1), minor waves 1 and 2 may be complete, and within minor wave 3, minute waves i and ii may be complete.
When intermediate wave (1) may be complete, then intermediate wave (2) should unfold over several weeks and may not move beyond the start of intermediate wave (1) below 0.2794.
TECHNICAL ANALYSIS
WEEKLY
Click chart to enlarge.
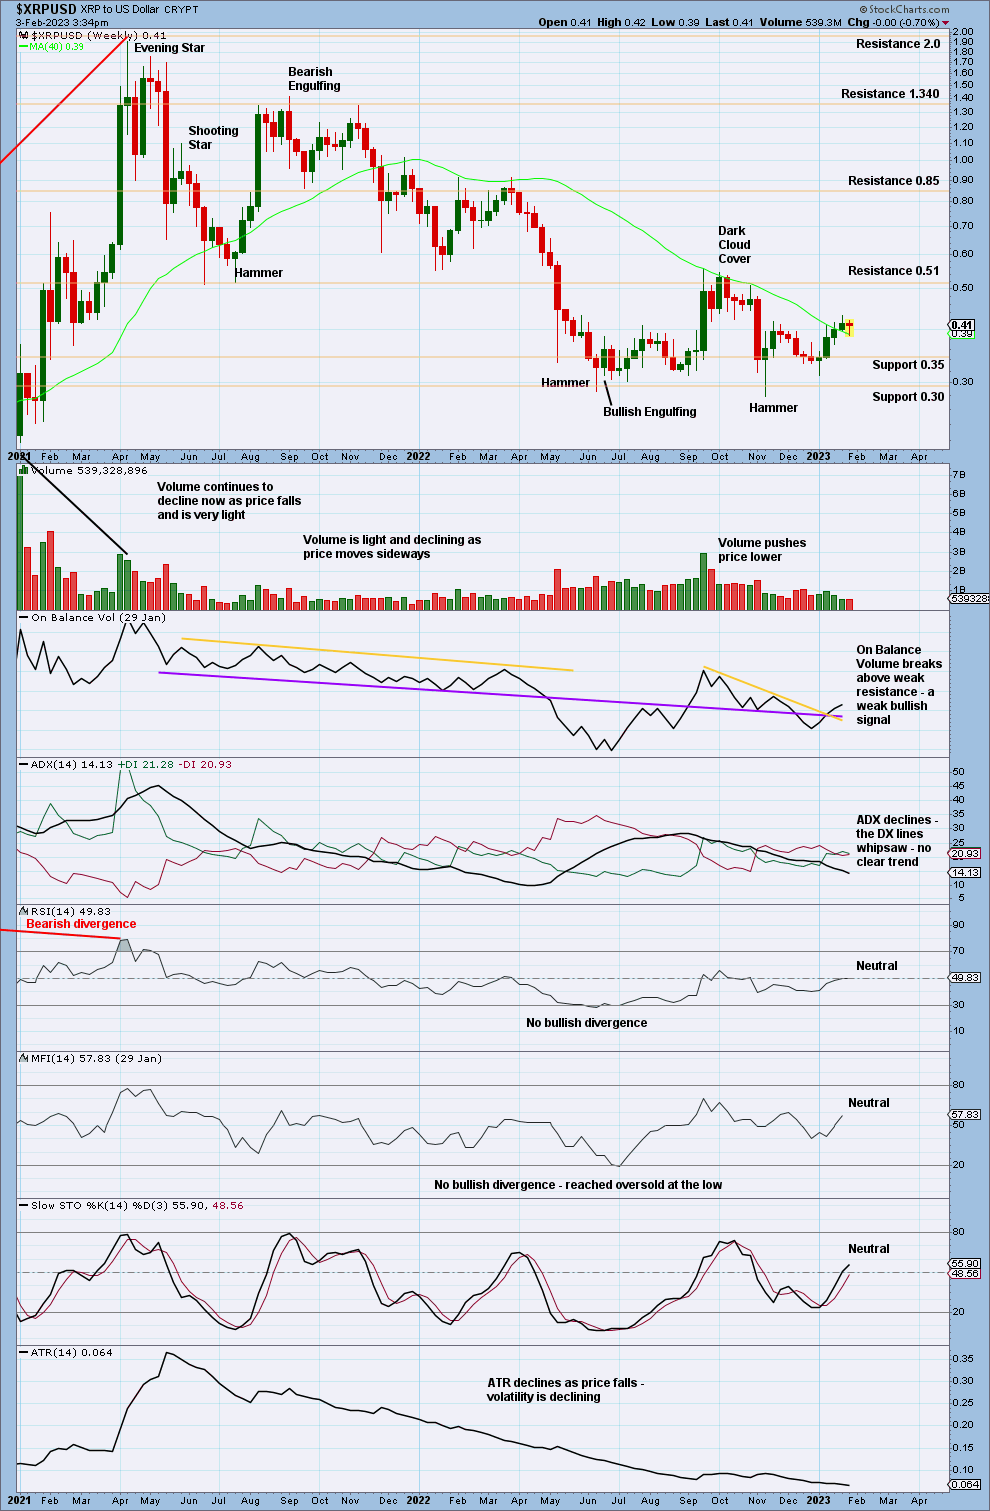
There is reasonable support about 0.30.
There is no clear trend. Price is moving up off support and Stochastics is moving higher from almost oversold. Expect an upwards swing to continue until price reaches resistance, which may be about 0.51, and Stochastics reaches overbought.
DAILY
Click chart to enlarge.
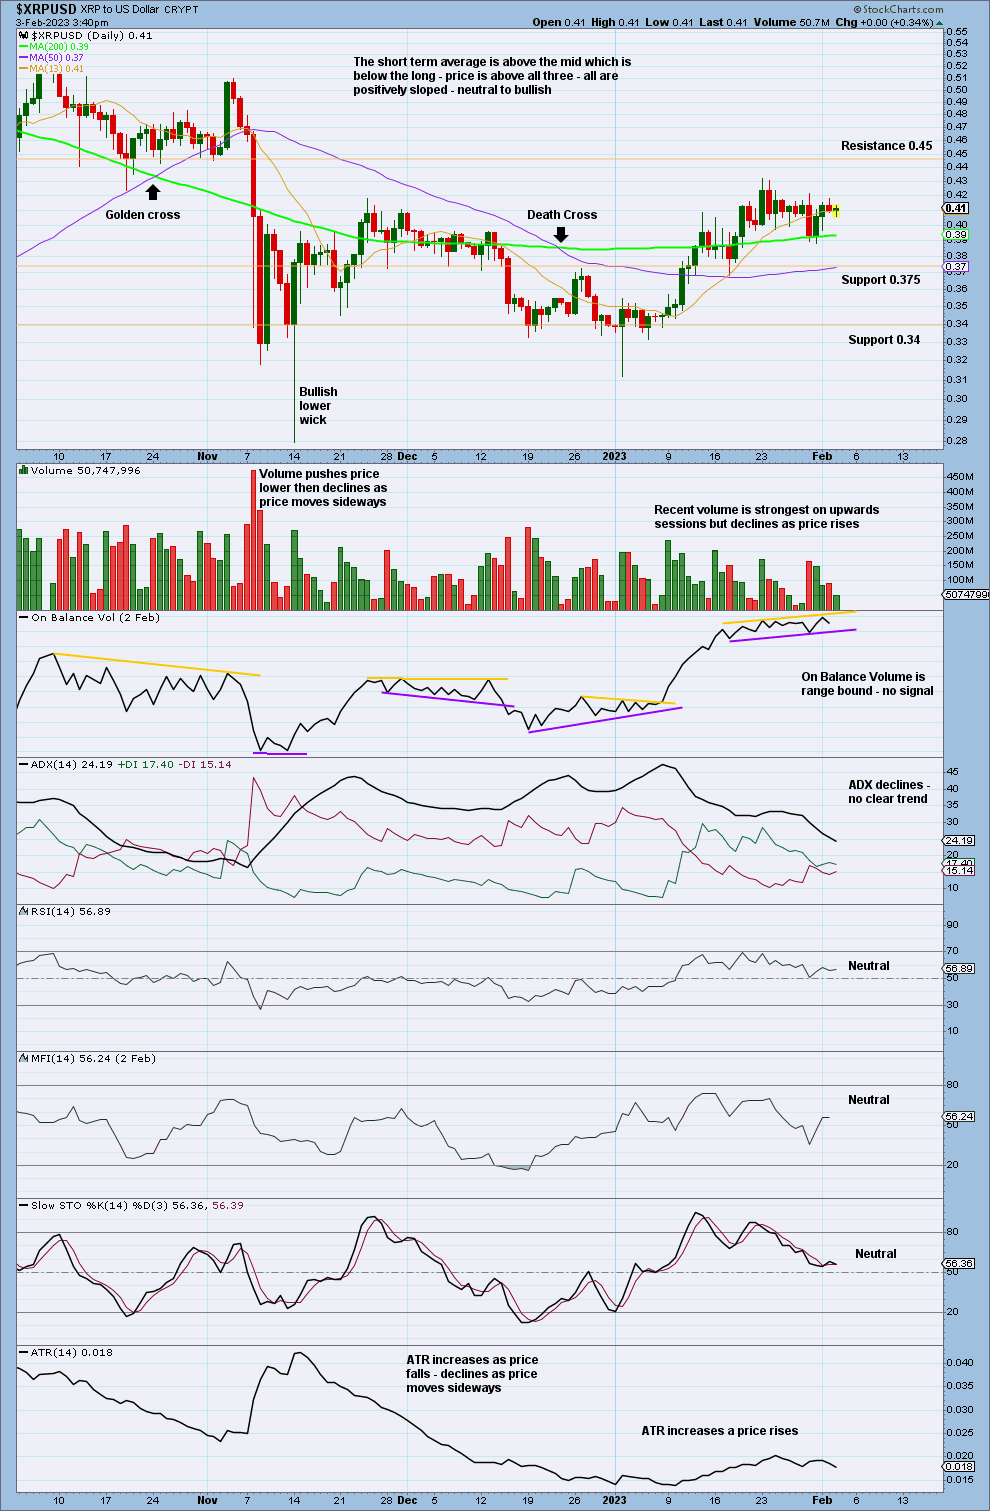
The previous downwards trend reached very extreme levels. Currently, there is no clear trend in either the daily or weekly time frames.
Stochastics is returning from overbought. For the short term, a downwards swing may continue until Stochastics reaches oversold and price reaches support, which may be about 0.375 or 0.34.
Published @ 12:59 p.m. ET.
—
Careful risk management protects your investments.
Follow my two Golden Rules:
1. Invest only funds you can afford to lose.
2. Have an exit plan for both directions – where or when to take profit, and when to exit a losing investment.
—
New updates to this analysis are in bold.
–