March 30, 2023: EURUSD Elliott Wave and Technical Analysis – Video and Charts
Over the last week EURUSD has moved higher as the Elliott wave count expected for the short term.
Summary: The bigger picture for Euro expects overall upwards movement for the long term, most likely to not make a new high above 1.60380.
For the short term, a pullback may continue lower to a target zone from 1.01211 – 1.01079. Thereafter, a strong third wave up may begin.
Quarterly and monthly charts were last updated here.
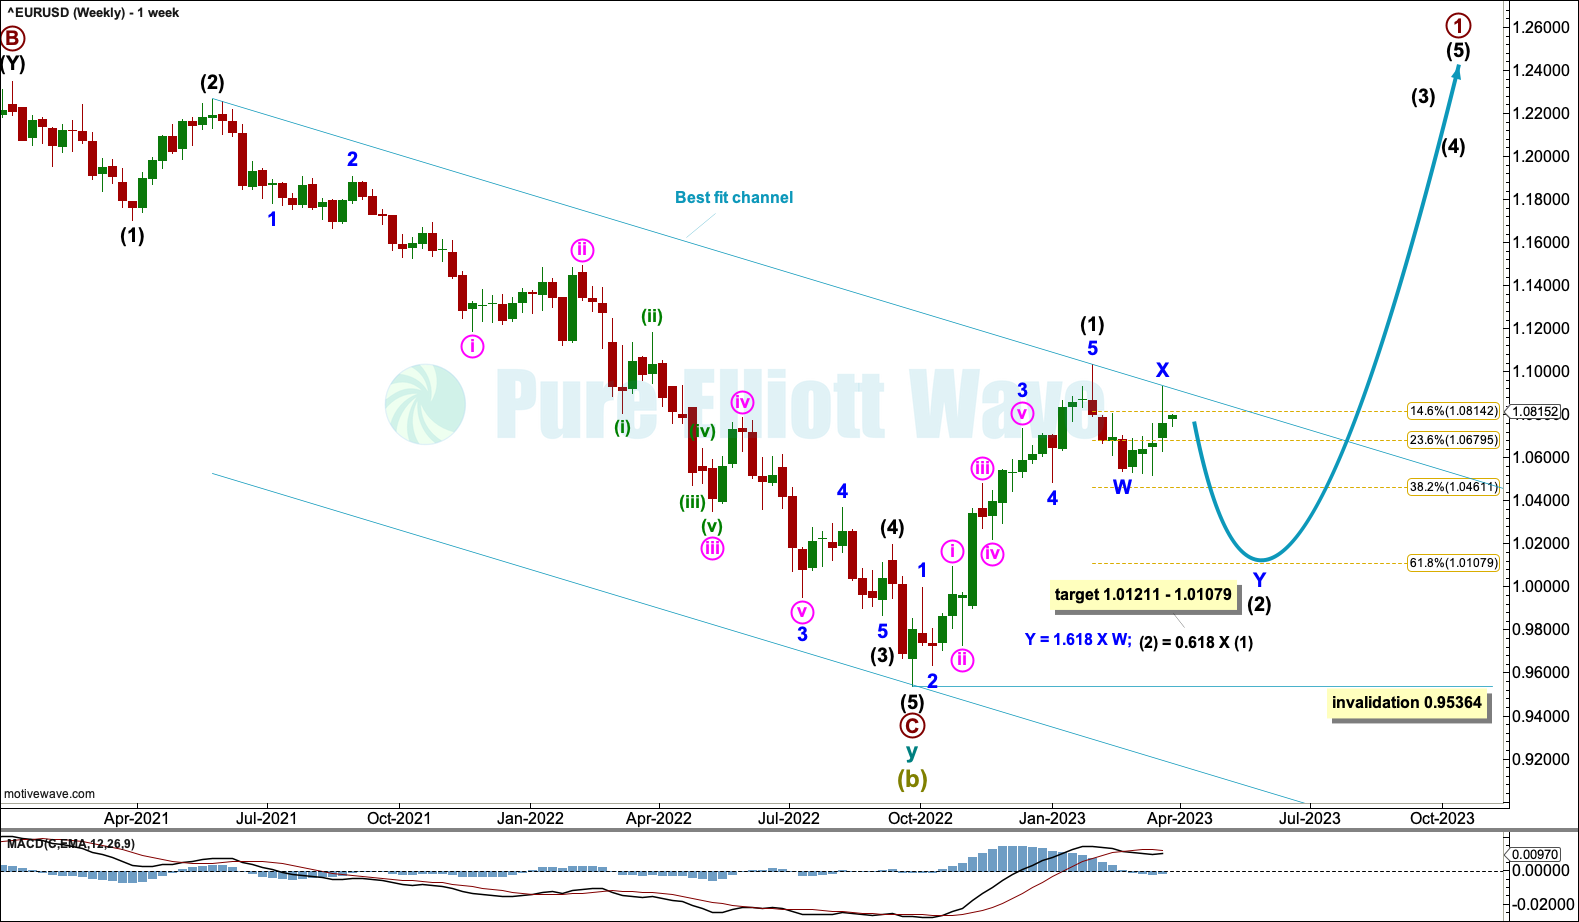
WEEKLY CHART
Click chart to enlarge.
The weekly chart focusses on the end of Super Cycle wave (b) and the start of Super Cycle wave (c).
Within Super Cycle wave (c), cycle wave a must subdivide as a five wave motive structure. Primary wave 1 within cycle wave a would be most likely incomplete.
Within primary wave 1: Intermediate wave (1) may be over at the last high and now intermediate wave (2) may continue lower to find support about the 0.618 Fibonacci ratio of intermediate wave (1) at 1.01079.
Intermediate wave (1) lasted 18 weeks, 3 weeks short of a Fibonacci 21. Intermediate wave (2) may be expected to last about a Fibonacci 13 or 21 weeks in total, give or take about 2 either side of these numbers. So far it is in its 8th week.
Intermediate wave (2) may be subdividing as a double zigzag. This is a common structure within a second wave position.
A best fit channel has been drawn to encompass all of the previous bear market and recent peak. Price last week found resistance at the upper edge of this channel. This supports minor wave X being complete.
Intermediate wave (2) may not move beyond the start of intermediate wave (1) below 0.95364.
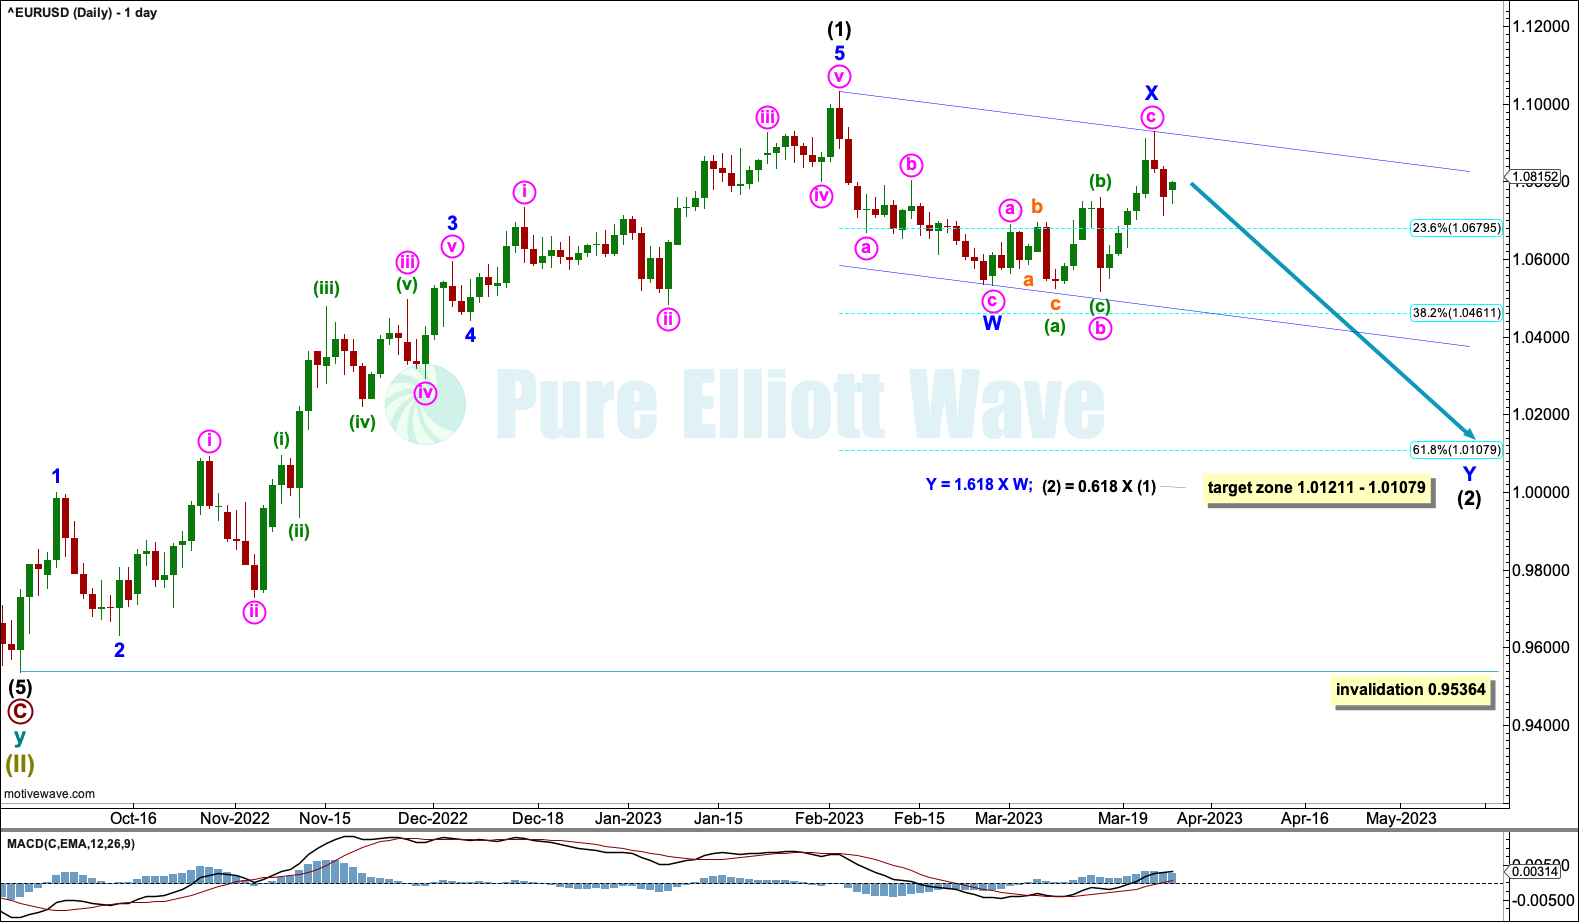
DAILY CHART
Click chart to enlarge.
The daily chart focusses on intermediate waves (1) and (2).
Intermediate wave (2) may be unfolding as a double zigzag. Within the double, the first zigzag may be complete and is labelled minor wave W. The double is joined by a corrective structure in the opposite direction, an expanding flat labelled minor wave X, which may also be complete. The second zigzag in the double is labelled minor wave Y has just begun. The purpose of a second zigzag in a double is to deepen the correction when the first zigzag does not move price deep enough. If minor wave Y ends at the target zone, then this purpose would be achieved.
No bullish invalidation is given. There is no Elliott wave rule which states a minimum nor maximum length for X waves. Therefore, minor wave X does not have an upwards invalidation level. Technical analysis supports minor wave X being complete.
A target is calculated at two degrees. At 1.01079 intermediate wave (2) would reach the 0.618 Fibonacci ratio of intermediate wave (1). At 1.01211 minor wave Y would reach 1.618 the length of minor wave W. This gives a 132 pip target zone.
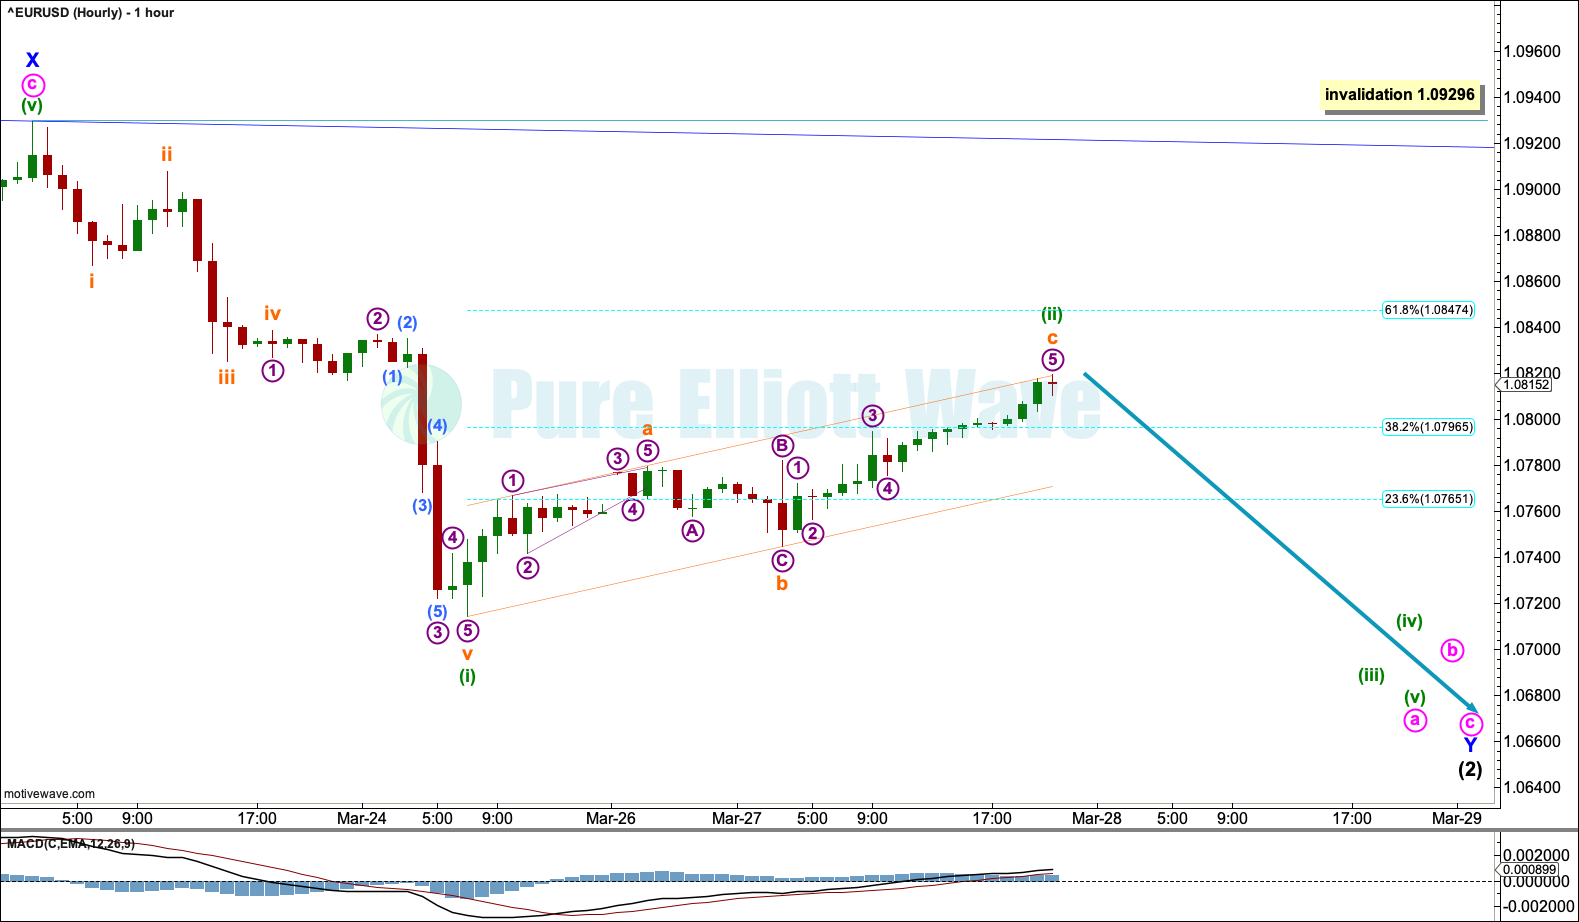
HOURLY CHART
Click chart to enlarge.
The hourly chart focusses on the start of minor Y.
Minor wave Y may be unfolding lower as a zigzag. Within the zigzag, minute wave a should subdivide as a five wave motive structure.
Within minute wave a, minuette waves (i) and (ii) may be complete. Minuette wave (i) subdivides as an impulse, and minuette wave (ii) may be a complete zigzag.
A channel is drawn about minuette wave (ii). Within the channel, subminuette wave c may have found resistance about the upper edge; it may end here, but if minuette wave (ii) does continue higher, then it may find next resistance about the 0.618 Fibonacci ratio of minuette wave (i) at 1.08484.
Minuette wave (ii) may not move beyond the start of minuette wave (i) above 1.09296.
TECHNICAL ANALYSIS
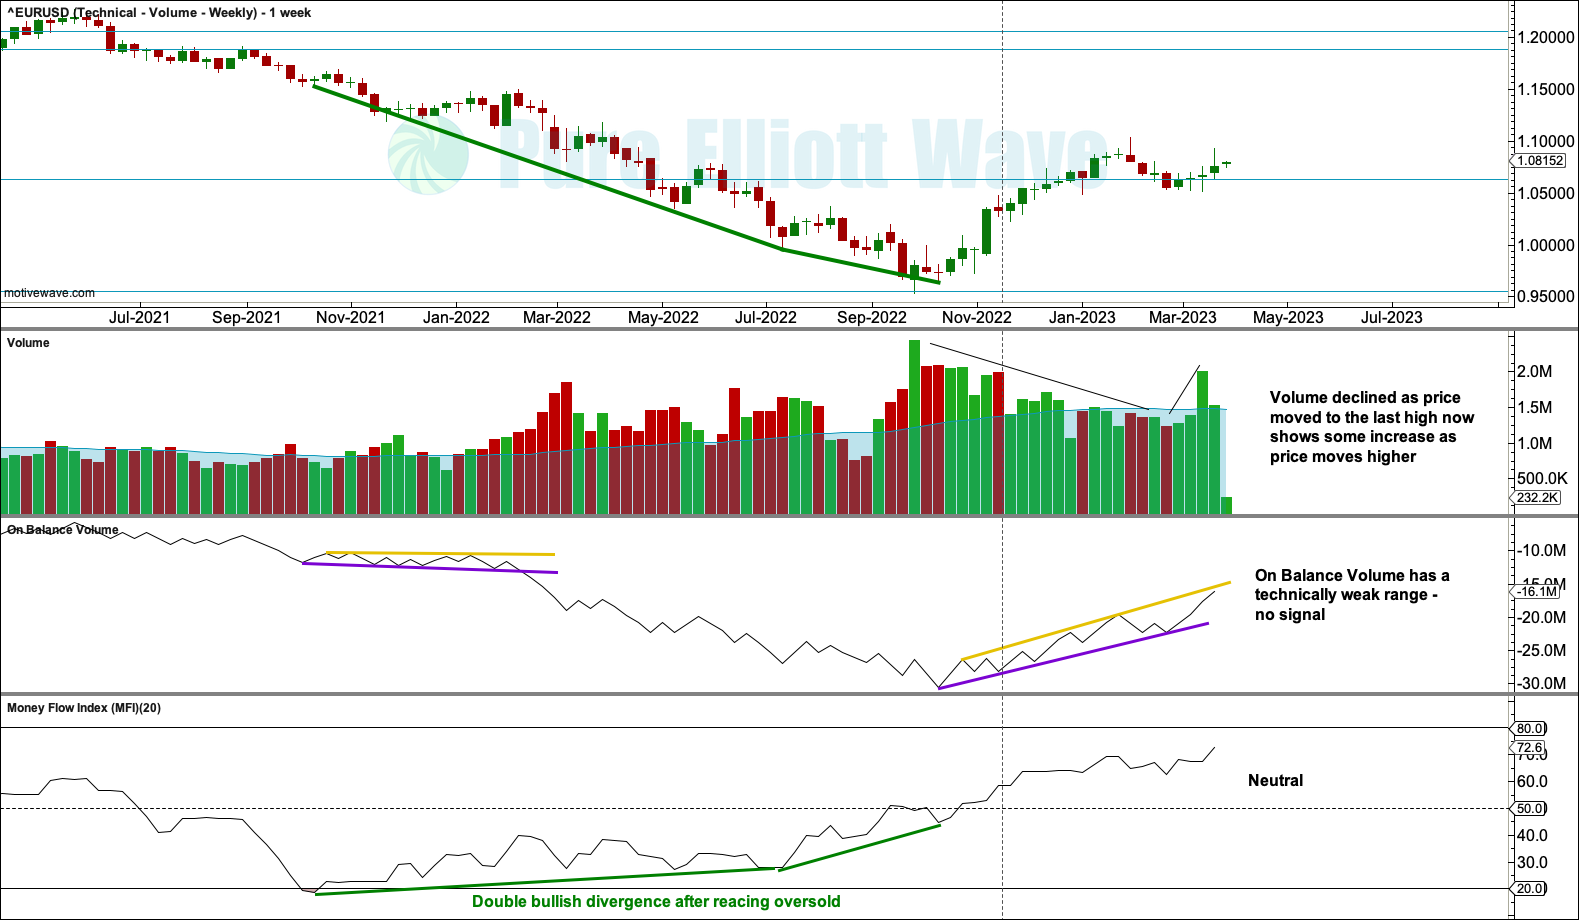
VOLUME
VOLUME WEEKLY CHART
Click chart to enlarge.
At the low in September 2022, strong bullish divergence after Money Flow reached oversold suggests this low may be sustained.
The short-term volume profile is bullish.
WEEKLY CHART

Click chart to enlarge.
At the low in September 2022, the downwards trend was very extreme while RSI reached oversold then exhibited bullish divergence. A bullish reversal pattern in a Morning Star should be given weight in these circumstances.
VOLUME DAILY CHART
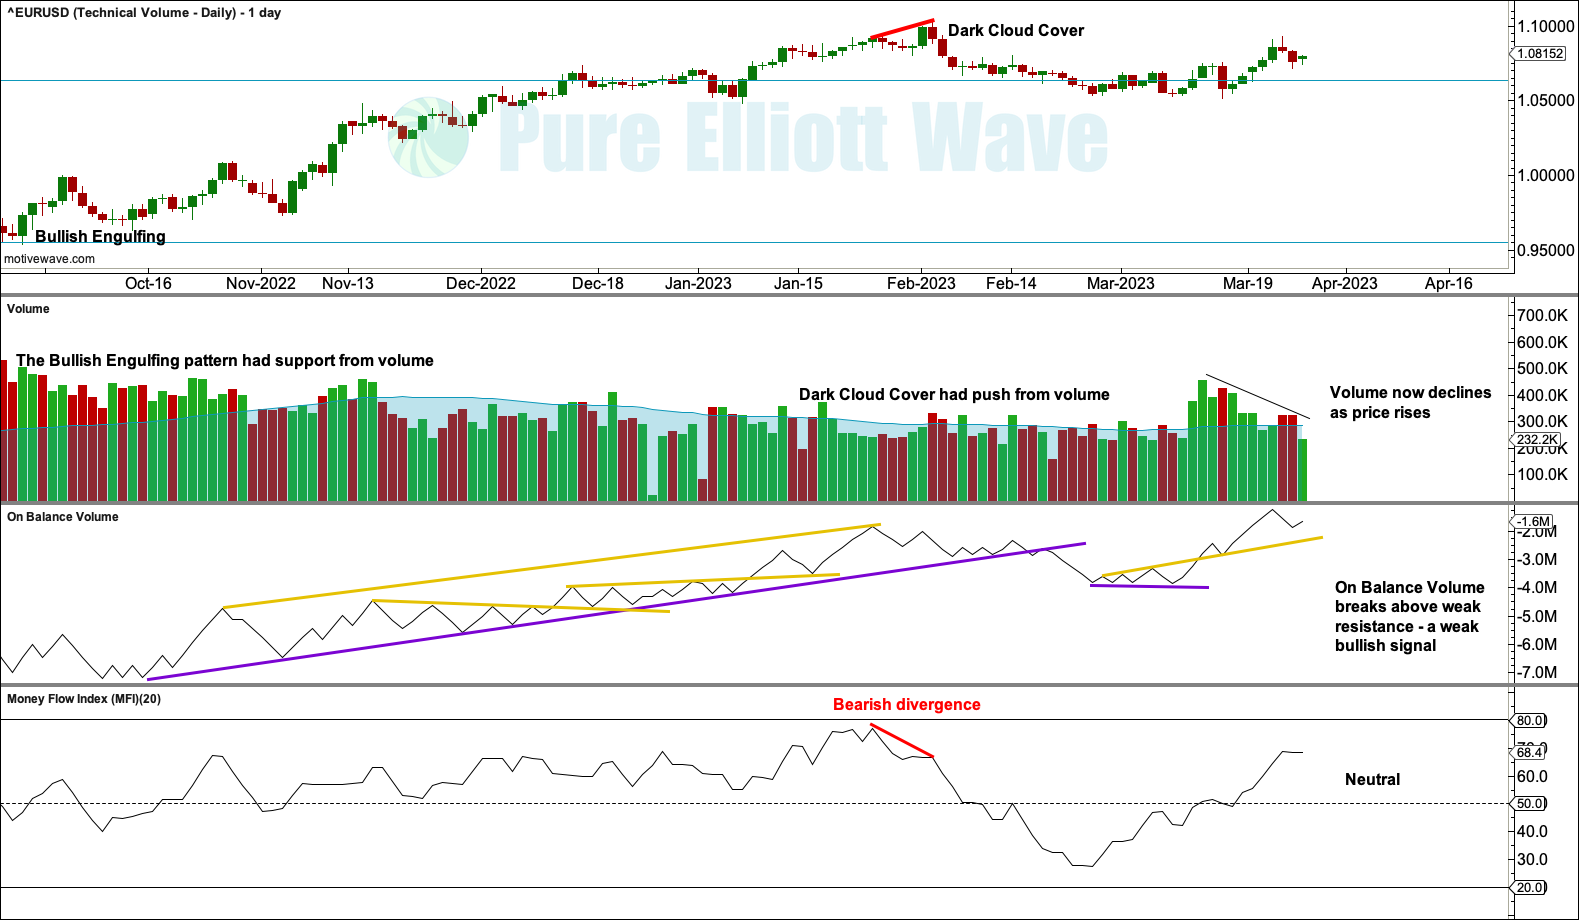
Click chart to enlarge.
The bearish signal from divergence with RSI and Dark Cloud cover may now be resolved with some downwards movement. For the short term, a decline in volume as price moves higher over the last week supports the Elliott wave count.
DAILY CHART
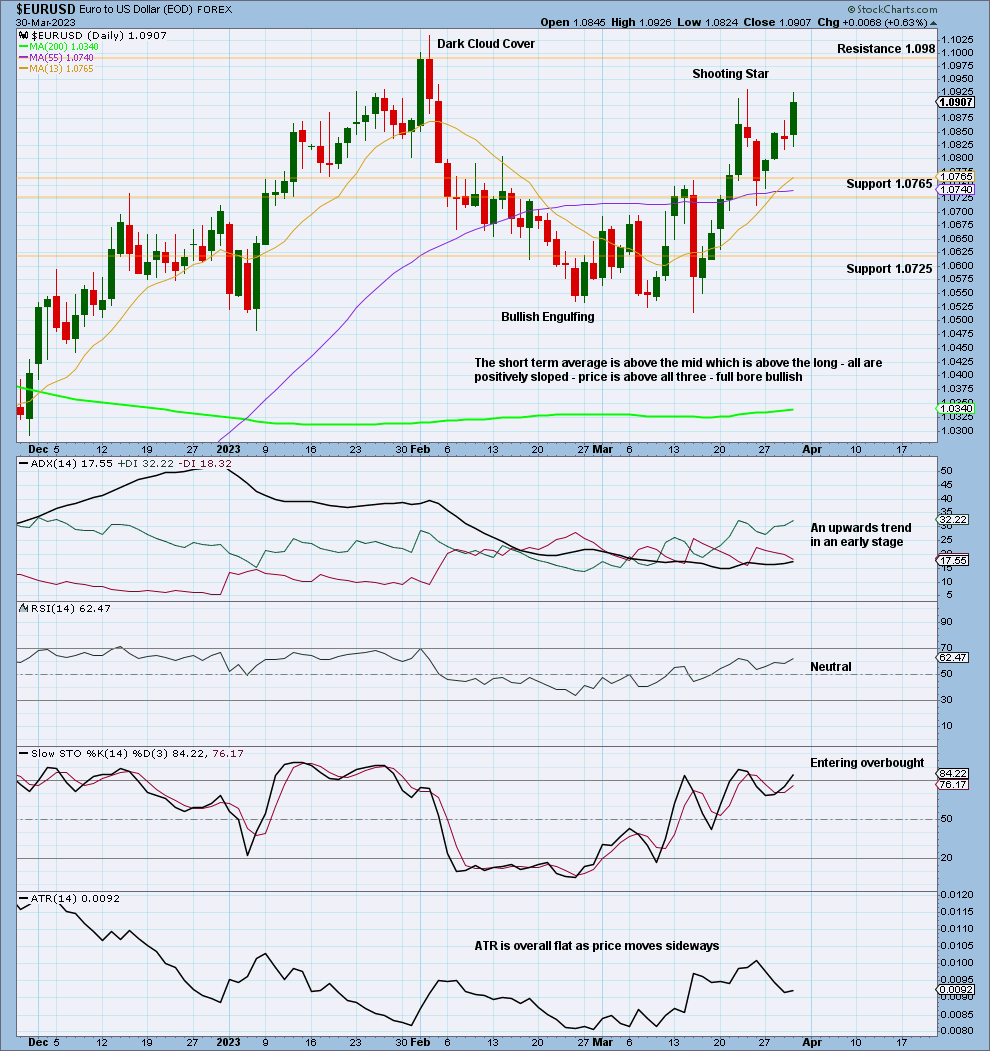
Click chart to enlarge.
There is now an upwards trend at both weekly and daily time frames. The trend is not extreme and RSI is not overbought. Look for next resistance above at 1.0988.
Edited @ 09:02 p.m. ET.
—
Careful risk management protects your trading account(s).
Follow my two Golden Rules:
1. Always trade with stops.
2. Risk only 1-5% of equity on any one trade.
—
New updates to this analysis are in bold.
—
 Save as PDF