April 4, 2023: SILVER Elliott Wave and Technical Analysis – Video and Charts
A bearish Elliott wave count is still preferred.
Summary: Upwards movement may continue until resistance is found at a channel or about 26.84.
BEARISH ELLIOTT WAVE COUNT
MONTHLY CHART
Click chart to enlarge.
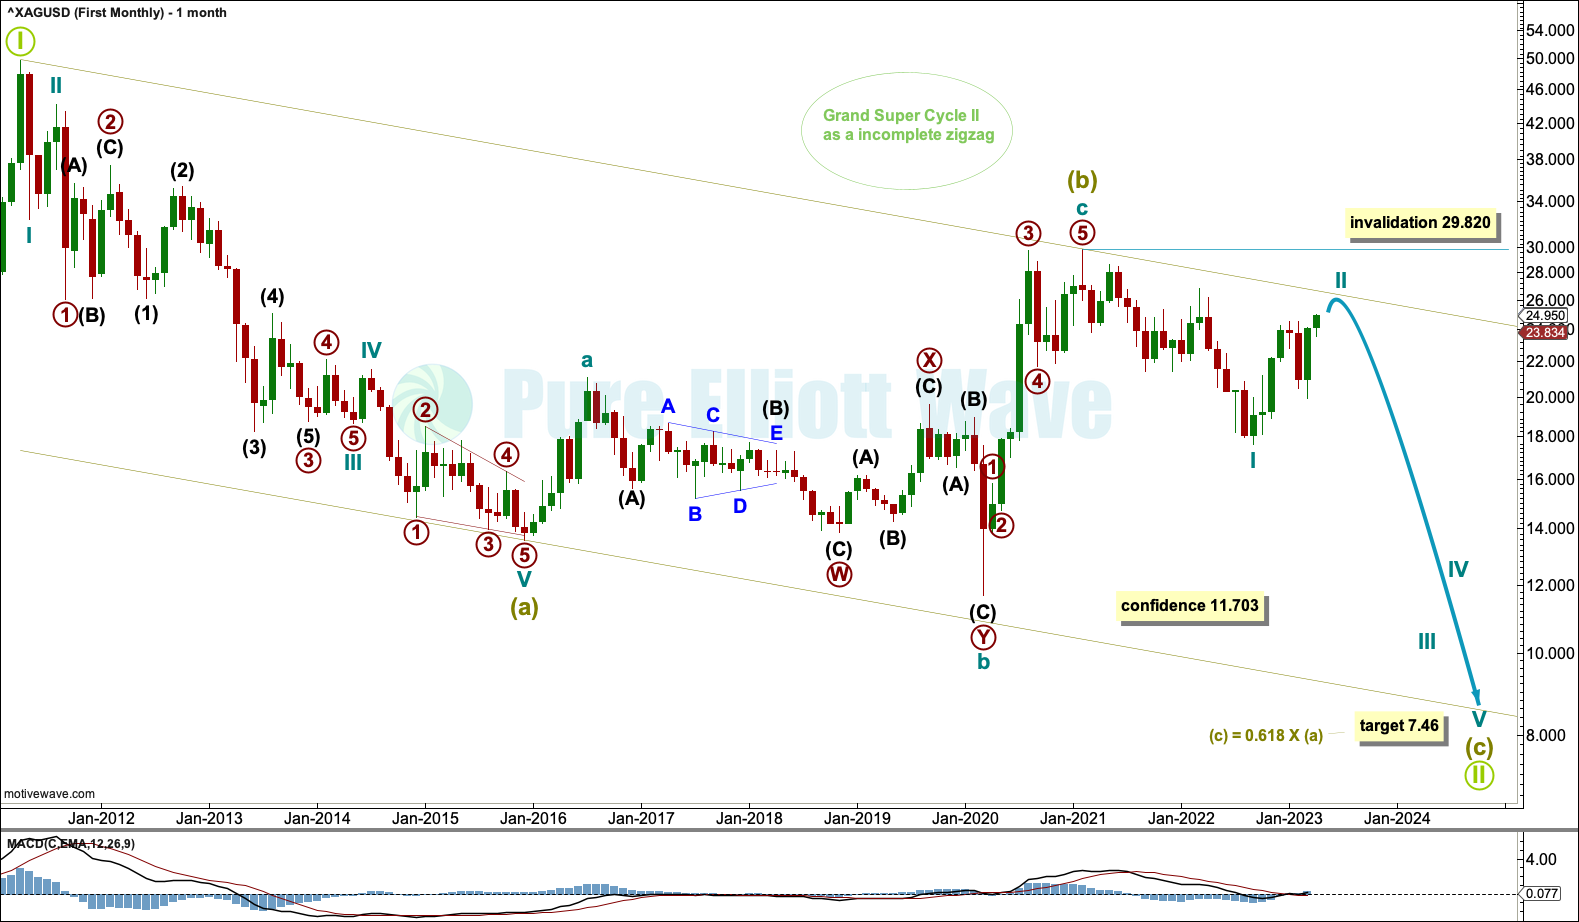
Grand Super Cycle wave II may be an incomplete zigzag. Within the zigzag: Super Cycle waves (a) and (b) may be complete and Super Cycle wave (c) may move lower.
Super Cycle wave (c) would be very likely to make a new low below the low of Super Cycle wave (a) at 13.569 to avoid a truncation. At 7.46 Super Cycle wave (c) would reach 0.618 the length of Super Cycle wave (a).
Within Super Cycle wave (c), cycle wave II may not move beyond the start of cycle wave I above 29.820.
Draw a channel about Grand Super Cycle wave II. Draw the first trend line from the high in April 2011 to the high in February 2021, then place a parallel copy on the low of December 2015. The upper edge of the channel may provide resistance.
WEEKLY CHART
Click chart to enlarge.
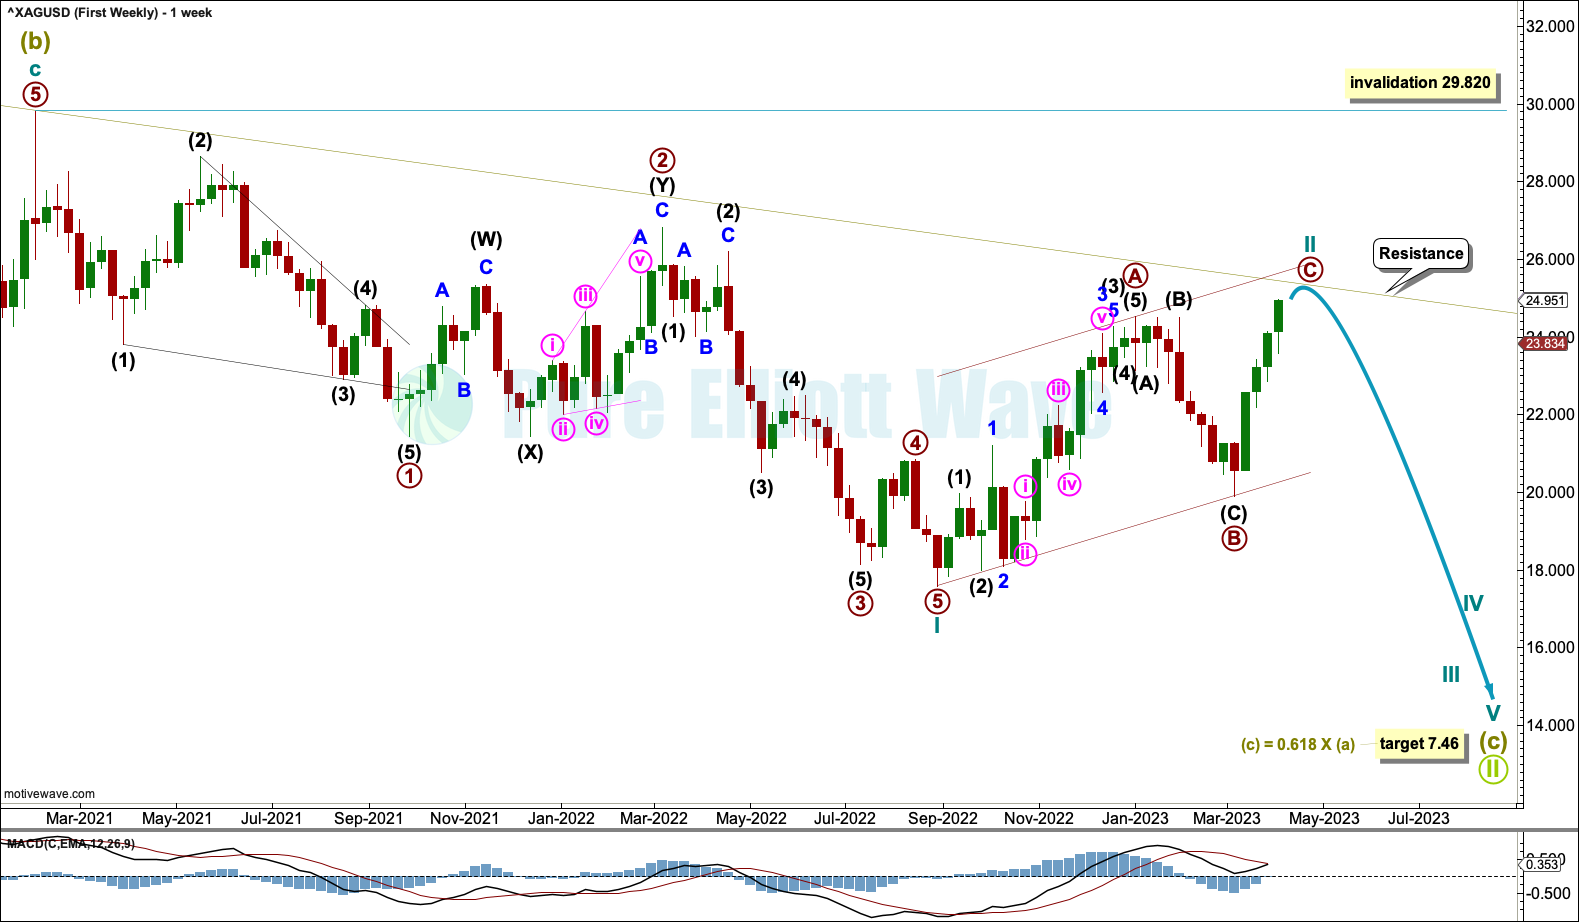
There are two possible structures that Super Cycle wave (c) may subdivide as, an impulse (more likely) or an ending diagonal (less likely). An impulse requires cycle wave I to subdivide as a five wave motive structure. Cycle wave I fits well as an impulse, which indicates Super Cycle wave (c) would most likely be subdividing as an impulse.
Within the impulse: Cycle wave I may be complete and cycle wave II may now be nearly complete. Cycle wave II may find resistance at the upper edge of the channel copied over from the monthly chart.
Cycle wave II may not move beyond the start of cycle wave I above 29.820.
DAILY CHART
Click chart to enlarge.
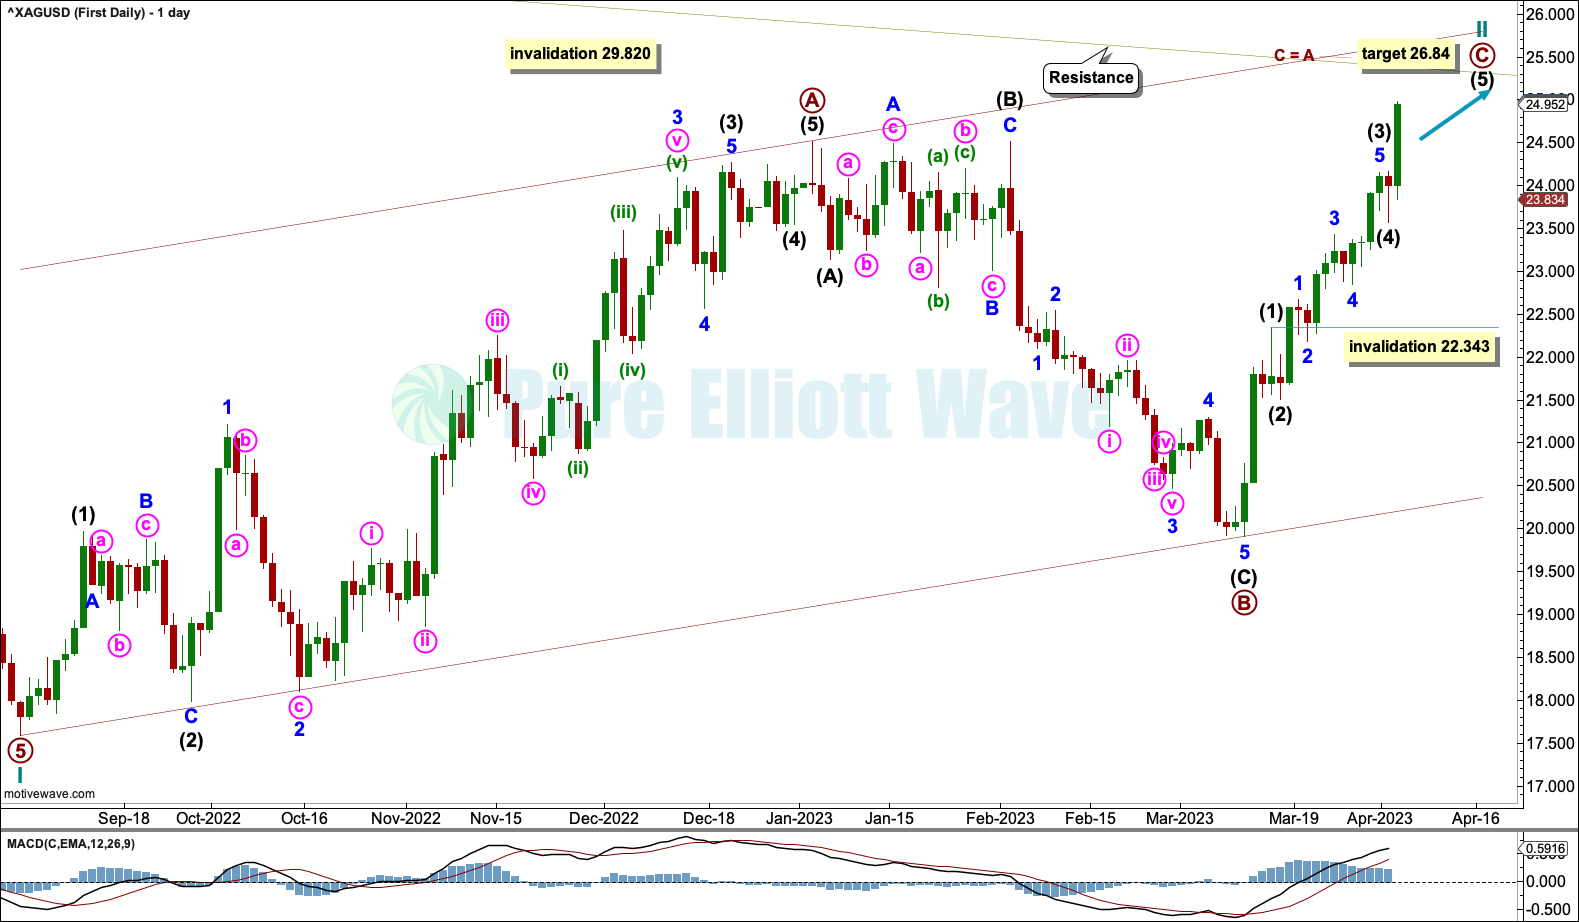
Cycle wave II may be unfolding as a zigzag. Within the zigzag: Primary waves A and B may be complete and primary wave C may be nearly complete as an impulse. Within the impulse, intermediate waves (1) through to (4) may be complete. If intermediate wave (4) continues lower, then it may not move into intermediate wave (1) price territory below 22.343.
At 26.84 primary wave C would reach equality in length with primary wave A. However, a better guide to where cycle wave II may end may be the upper edge of the channel copied over from the monthly chart.
BULLISH ELLIOTT WAVE COUNT
MONTHLY CHART
Click chart to enlarge.
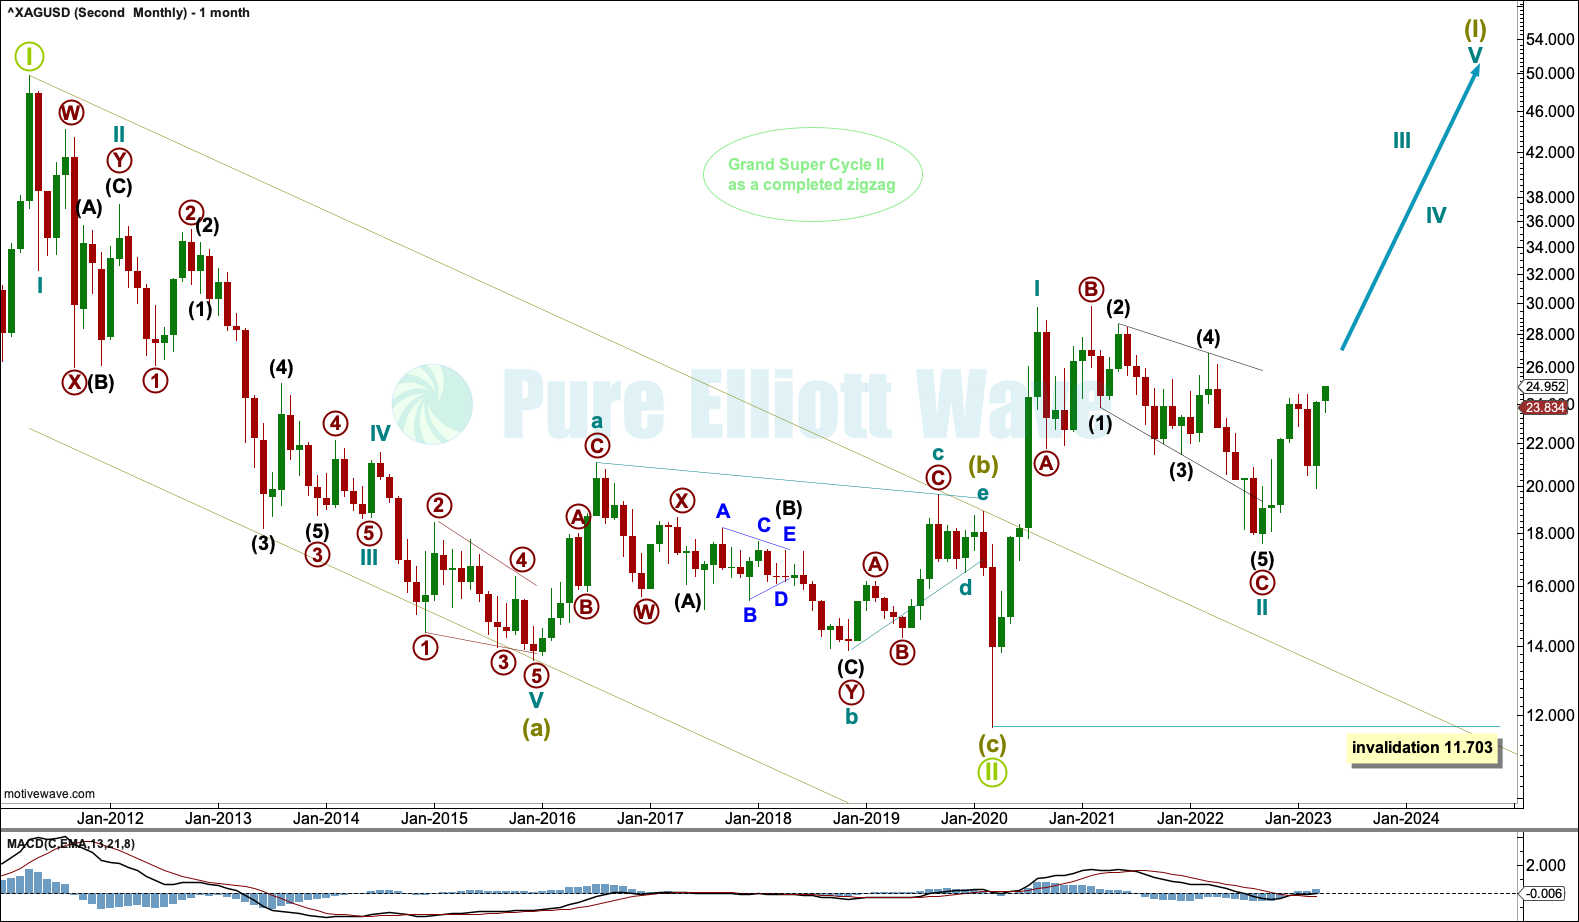
It is possible that Grand Super Cycle wave II was complete as a zigzag at the low of March 2020. However, it would have lasted only 8.9 years, which is brief for a Grand Super Cycle degree wave. These waves may be expected to last generations, which would be longer than 40 years. The brevity of Grand Super Cycle wave II for this wave count reduces its probability.
If cycle wave II continues lower, then it may not move beyond the start of cycle wave I below 11.703.
WEEKLY CHART
Click chart to enlarge.
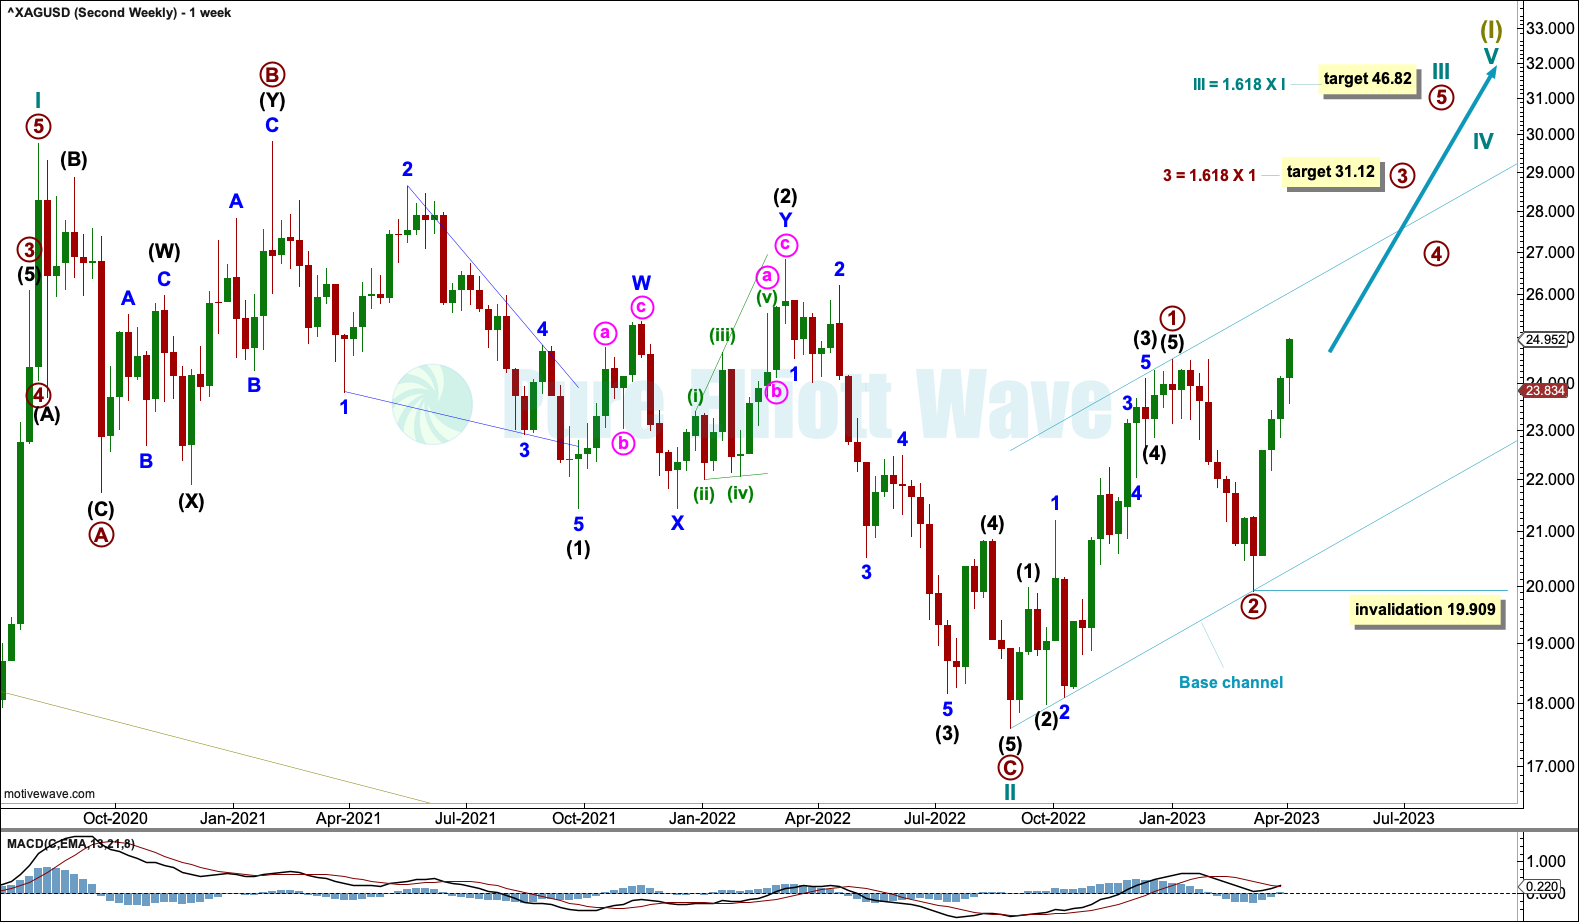
Within the new trend of Super Cycle wave (I), cycle waves I and II may be complete. Cycle wave II subdivides as a regular flat with an abnormally long primary wave C.
Cycle wave III may have begun. Cycle wave III may only subdivide as an impulse. Within the impulse, primary waves 1 and 2 may be complete. At 31.12 primary wave 3 would reach 1.618 the length of primary wave 1. Within primary wave 3, a second wave correction may not move below 19.909.
Draw a base channel about primary waves 1 and 2. Draw the first trend line from the start of primary wave 1 to the end of primary wave 2, then place a parallel copy on the end of primary wave 1. The lower edge of the base channel may show where deep corrections may find support. Primary wave 3 should have the power to break through resistance at the upper edge of the channel.
At 46.82 cycle wave III would reach 1.618 the length of cycle wave I. This target may be met in some years.
DAILY CHART
Click chart to enlarge.
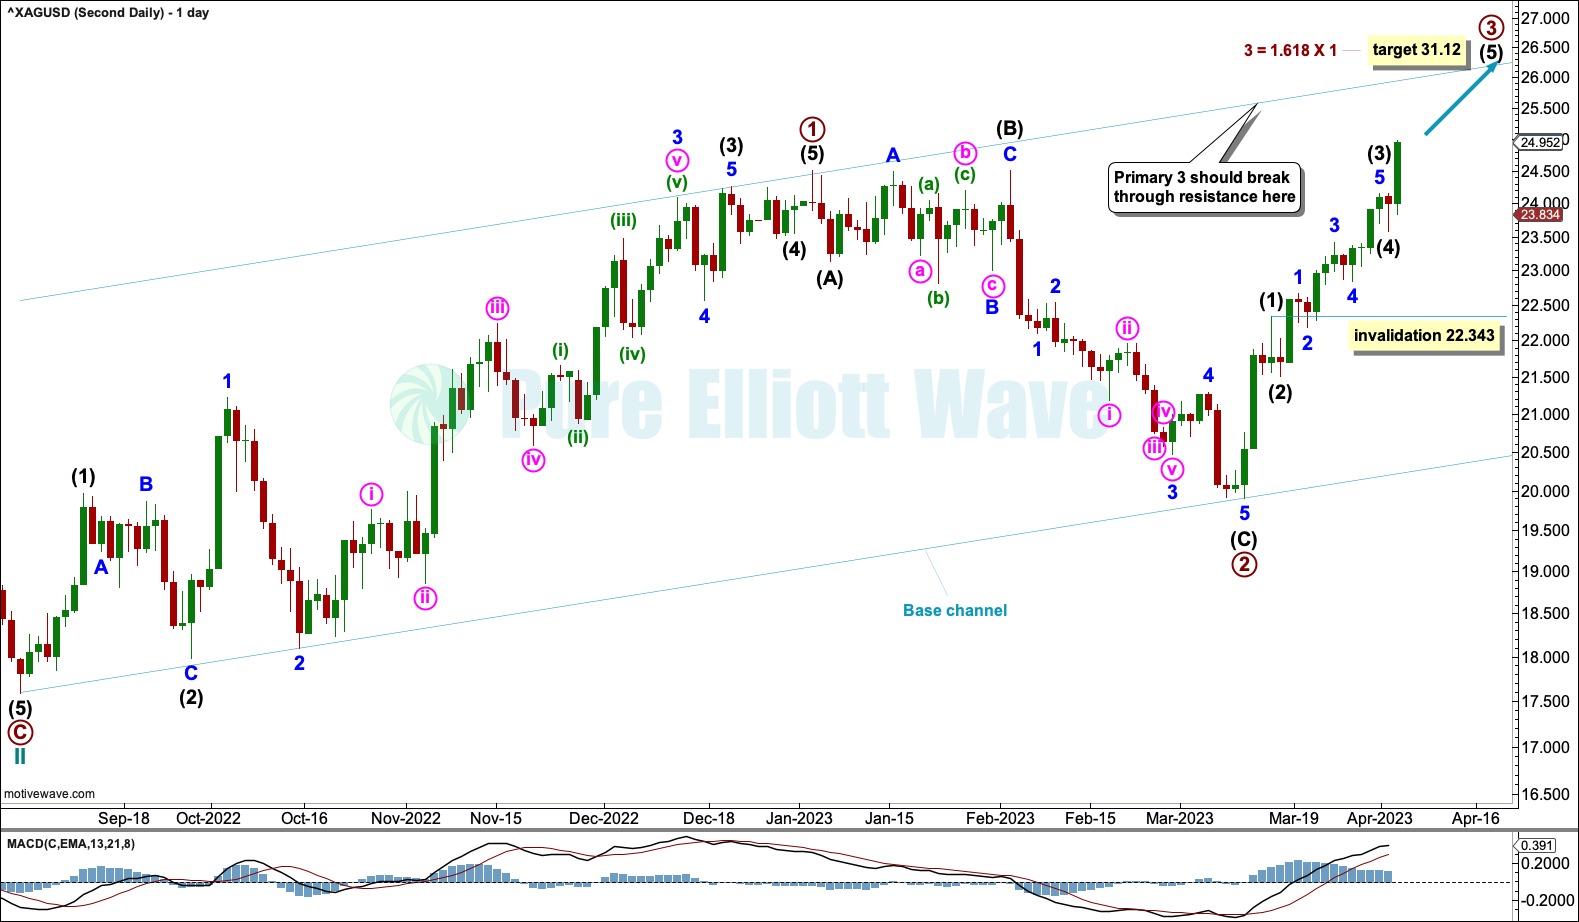
Within primary wave 3, intermediate waves (1) through to (4) may be complete. If intermediate wave (4) is incomplete, then it may not move into intermediate wave (1) price territory below 22.343.
This wave count expects intermediate wave (5) to be a long extension. It is typical for large degree fifth waves of commodities within third wave impulses to be long strong extensions.
TECHNICAL ANALYSIS
MONTHLY CHART
Click chart to enlarge.
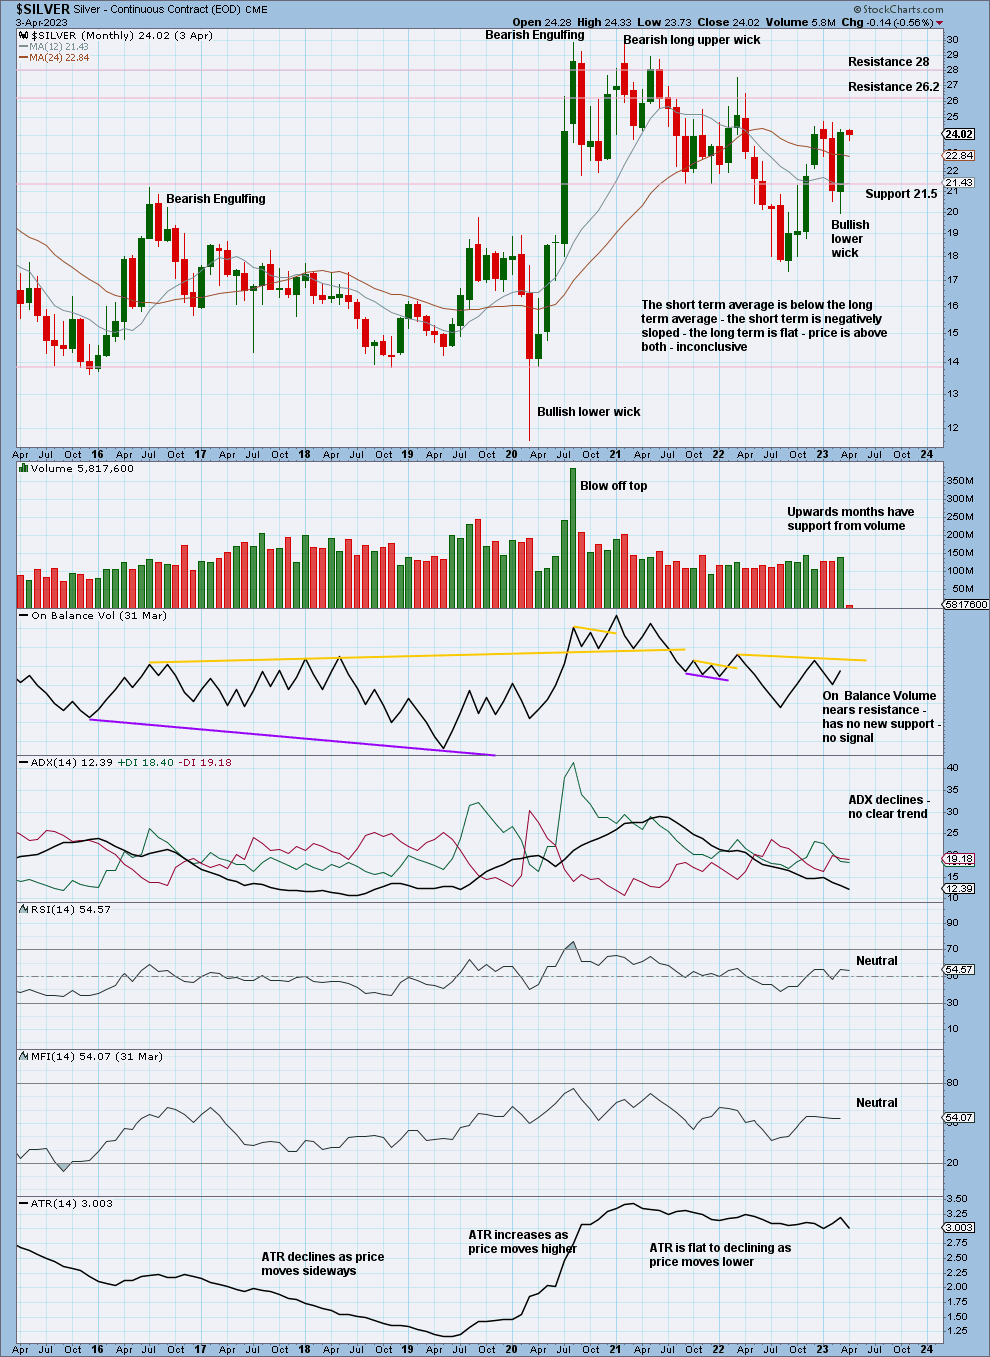
There is no clear trend at the monthly time frame.
Price is consolidating with resistance about 26.2 and support about 21.5. The volume profile is bullish.
WEEKLY CHART
Click chart to enlarge.
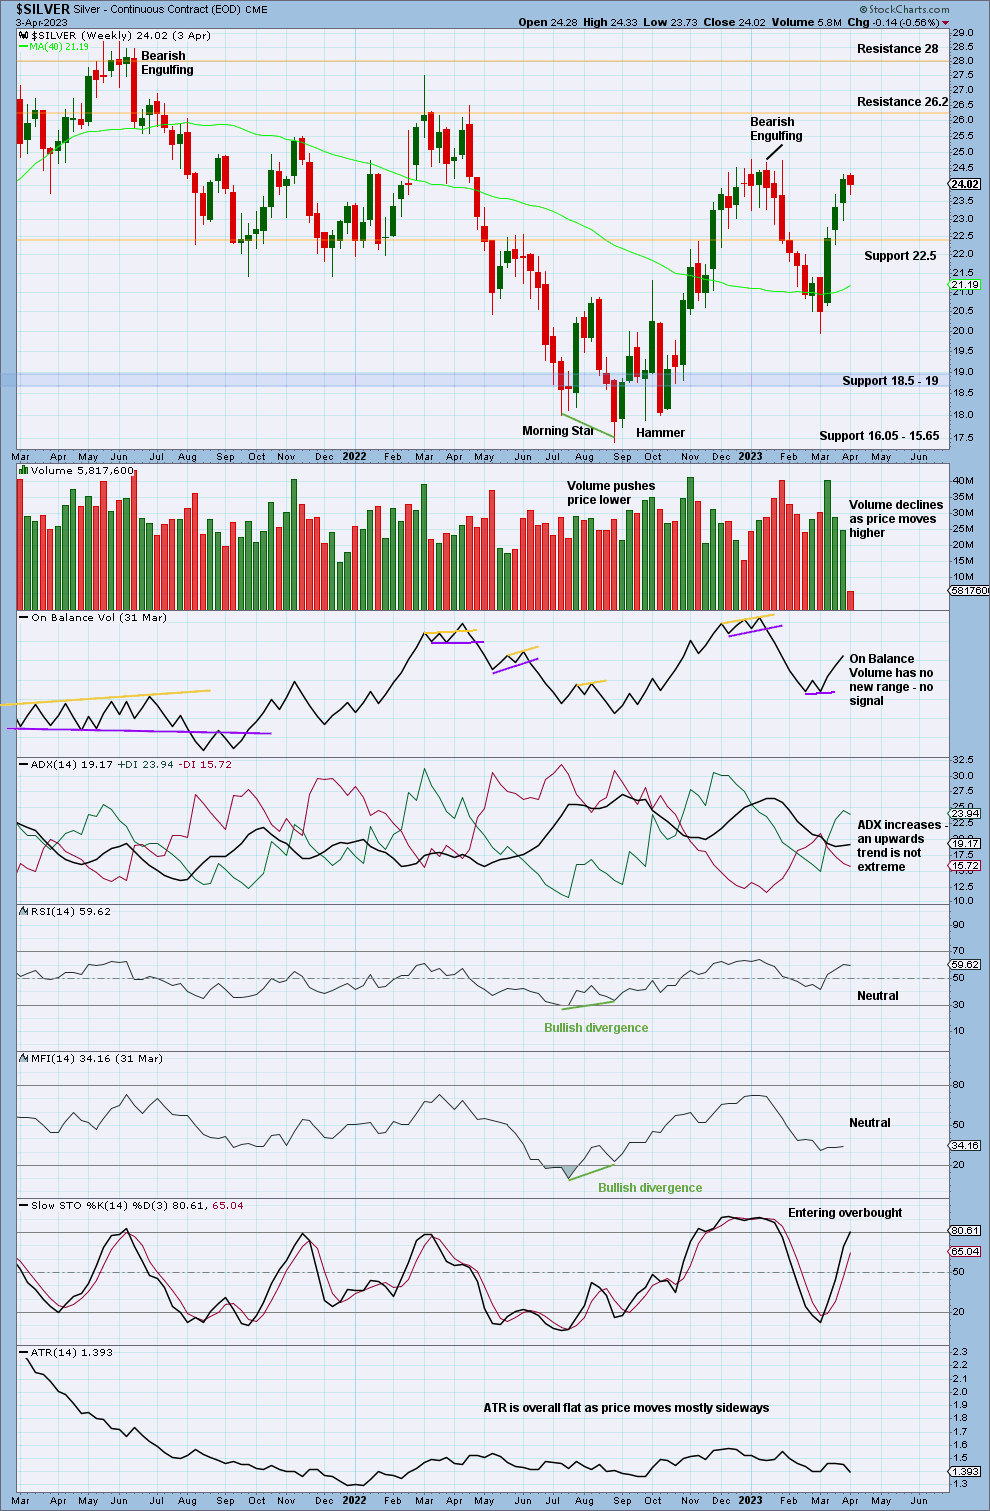
There is an upwards trend at the weekly time frame that is not extreme. RSI is not overbought. There is room for this trend to continue. Look for next resistance about 26.2 and then 28.
Declining volume is a concern for a bullish case and supports the first Elliott wave count.
DAILY CHART
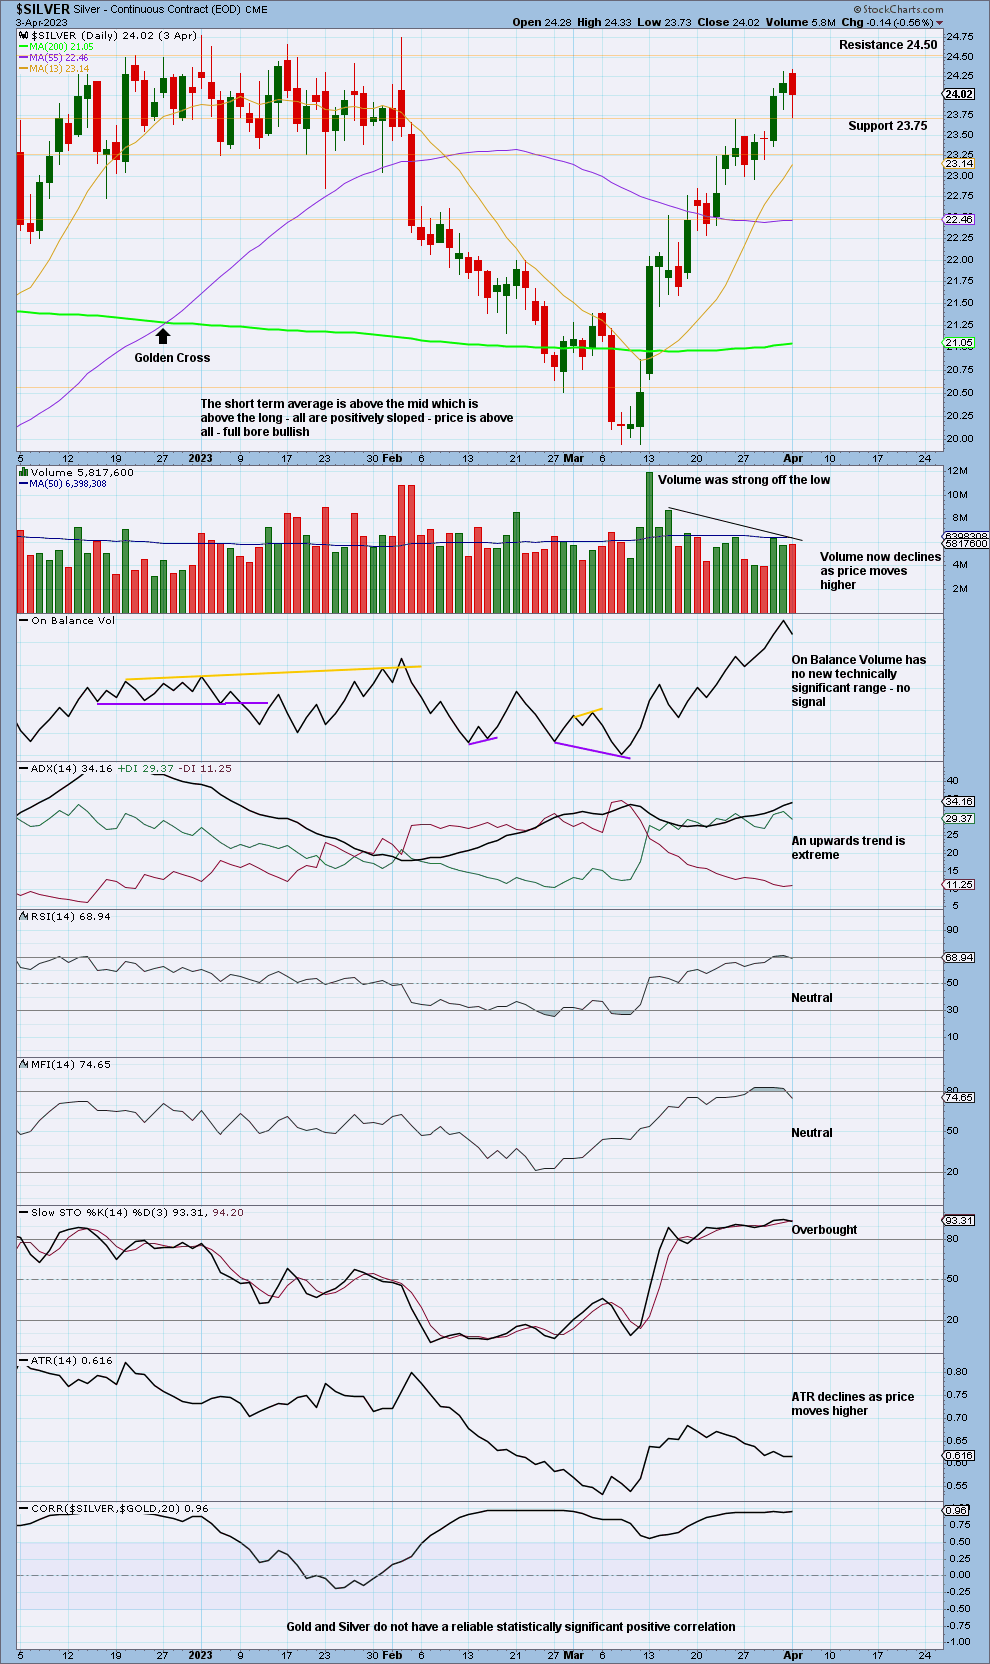
Click chart to enlarge.
There is an upwards trend that is extreme, and it can become more extreme before it ends. There is as yet no bearish divergence.
Both volume and range are declining as price moves higher. This supports the first Elliott wave count and not the second. For the second Elliott wave count, a third wave up should not come with weak volume and declining range.
Published @ 05:20 p.m. ET.
—
Careful risk management protects your trading account(s).
Follow my two Golden Rules:
1. Invest only funds you can afford to lose.
2. Have an exit strategy for both directions; when to take profit and when to exit a losing investment.
—
New updates to this analysis are in bold.
—
 Save as PDF