May 17, 2023: EURUSD Elliott Wave and Technical Analysis – Charts
Price has officially broken the trend line from September 2022 to present.
Summary: The bigger picture for Euro expects overall upwards movement for the long term, most likely to not make a new high above 1.60380.
For the short term, a pullback may continue lower to a target zone from 1.02862 to 1.01079. Thereafter, a strong third wave up may begin. Recent price action may be confirming this outlook.
An alternate, also predicting long-term upwards price movement, expects the short-term pullback is nearly over.
Quarterly and monthly charts were last updated here.
WEEKLY CHART
Click chart to enlarge.
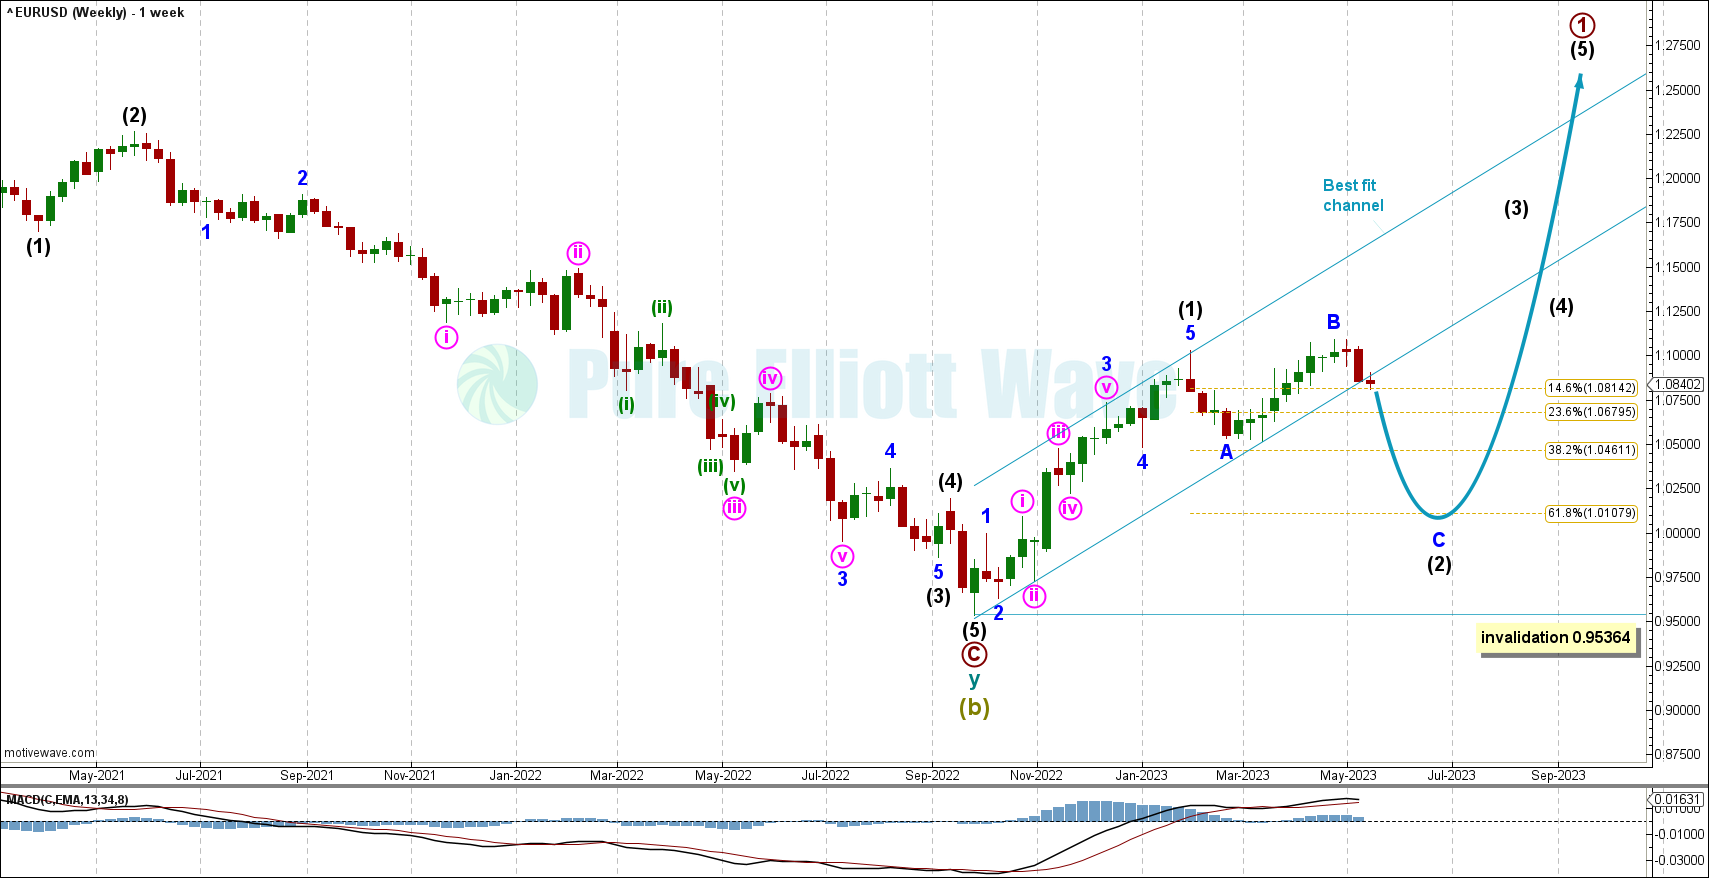
The weekly chart focusses on the end of Super Cycle wave (b) and the start of Super Cycle wave (c).
Within Super Cycle wave (c), cycle wave a must subdivide as a five wave motive structure. Primary wave 1 within cycle wave a is most likely incomplete.
Within primary wave 1: Intermediate wave (1) may be over at the previous high and now intermediate wave (2) may continue to find support about the 0.618 Fibonacci ratio of intermediate wave (1) at 1.01079.
Intermediate 2 may be unfolding as an expanded flat with minor B reaching 113% the length of minor wave A. Expanded flats are common structures. Minor wave C is most likely underway and must subdivide as a motive structure downwards.
A best fit channel has been drawn to encompass all of the present upwards movement. The best fit channel has been broken on the daily chart. A new short-term bear trend is likely.
Intermediate wave (2) may not move beyond the start of intermediate wave (1) below 0.95364.
DAILY CHART
Click chart to enlarge.
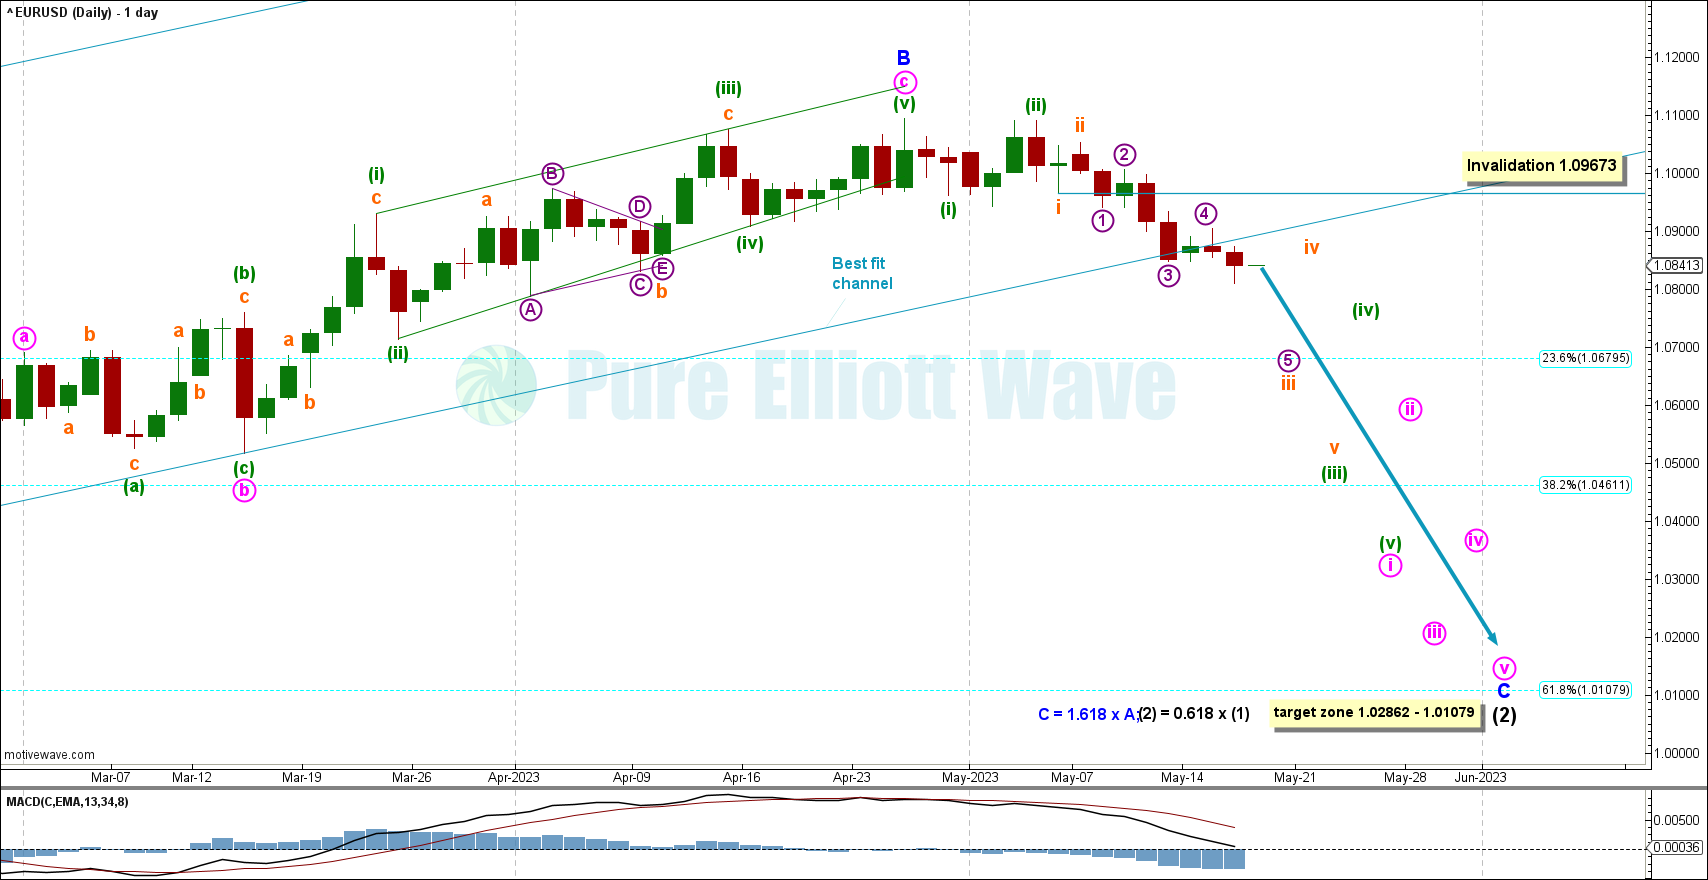
The daily chart focuses on minor waves B and C of intermediate (2).
Currently, price sits at the long-term best fit channel from September 2022 (Daily chart), encompassing all of the previous upwards movement. A full daily candlestick breaking below and not touching this channel will be another bearish signal for the medium-term trend.
Within the zigzag of minor wave B, minute wave c may have completed as an ending contracting diagonal. Within the diagonal: Minuette wave (v) is shorter than minuette wave (iii) and minuette wave (iii) is shorter than minuette wave (i).
The invalidation level at 1.09673 is utilizing the Elliott Wave rule that within an impulse wave 4 may not enter the price territory of wave 1. Price over this level would shift our focus to the alternate count detailed below.
With minor wave B complete, a target is calculated for minor wave C to reach 1.618 times the length of minor A at 1.02862, giving us a range from 1.02862 to 1.01079. This wave count is very bearish for the short term.
Today the long standing best fit channel, encompassing the bullish trend since September 2022, has met our definition of a breach. The daily candlestick for today is below and not touching the trend line. A bear trend may be starting.
HOURLY CHART
Click chart to enlarge.
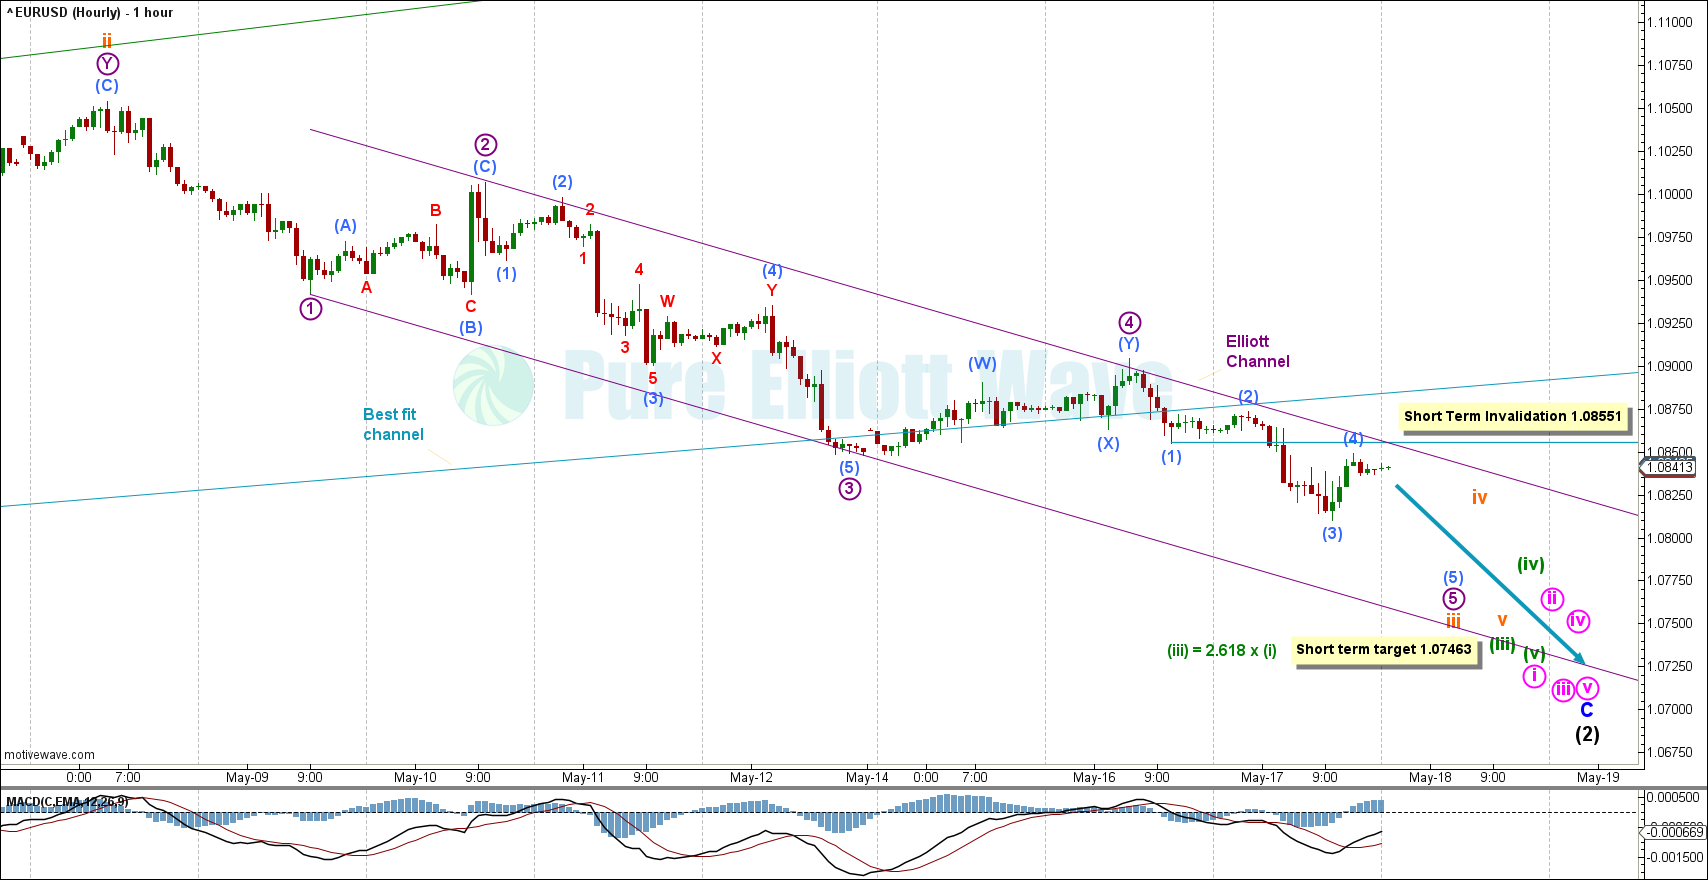
The hourly chart focuses on minuette wave (iii) of minor wave C.
Recent overlapping price action after the end of minuette (ii) could be subdividing as an extending impulse. Invalidation for this idea is close at 1.09415. A breach of this level would be bullish for the short term.
A target has been calculated for minuette wave (iii) to reach the 2.618 fibonacci extension of minuette (i) at 1.07463.
Recent price movement has remained inside the orange Elliott channel. Micro wave 5 of subminuette iii may find support along the lower edge of this channel. Micro wave 5 may be complete if price breaks above the short-term invalidation point at 1.08551. If price rises above that level, subminuette wave iv may bring a very short-term upwards movement that should not to exceed over 1.09673 (see the daily invalidation point).
For the short term, the downwards trend is expected to continue.
ALTERNATE WEEKLY CHART
Click chart to enlarge.
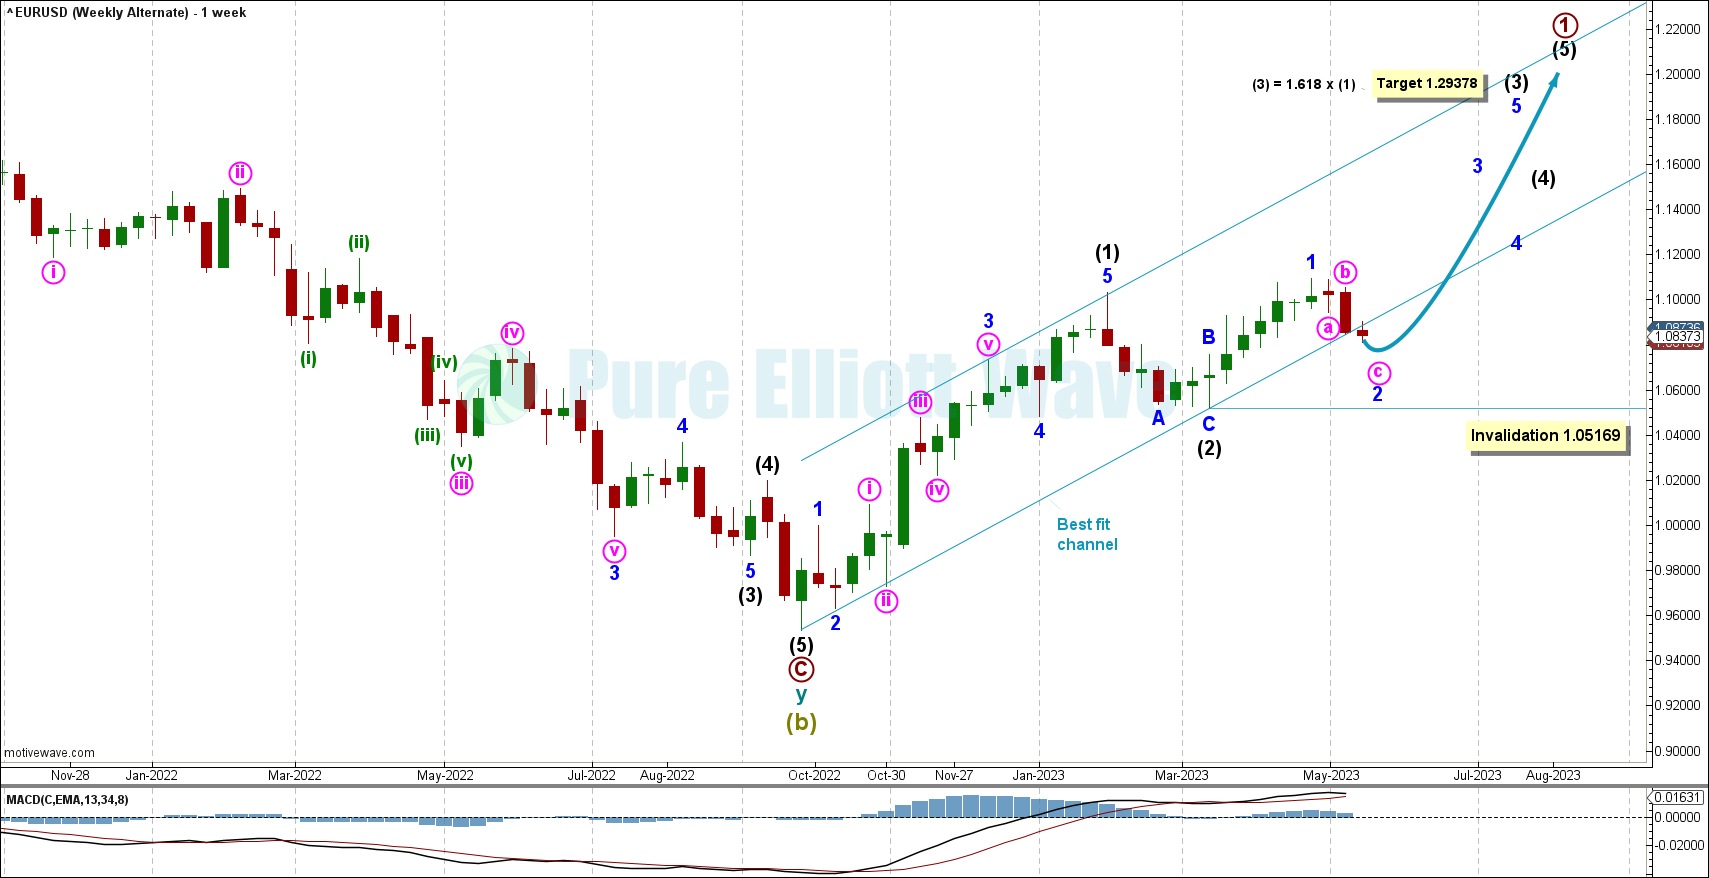
This alternate reflects the possibility of intermediate (2) as complete.
This chart expects a shallower pullback in the short term followed by more upwards movement.
Minor wave 1 be complete. Minor wave 2 may be nearing completion as a zigzag.
A target is calculated for intermediate (3) to reach 1.618 the length of intermediate (1) at 1.29378.
Minor wave 2 may not move beyond the start of minor wave 1 below 1.05169.
ALTERNATE DAILY CHART
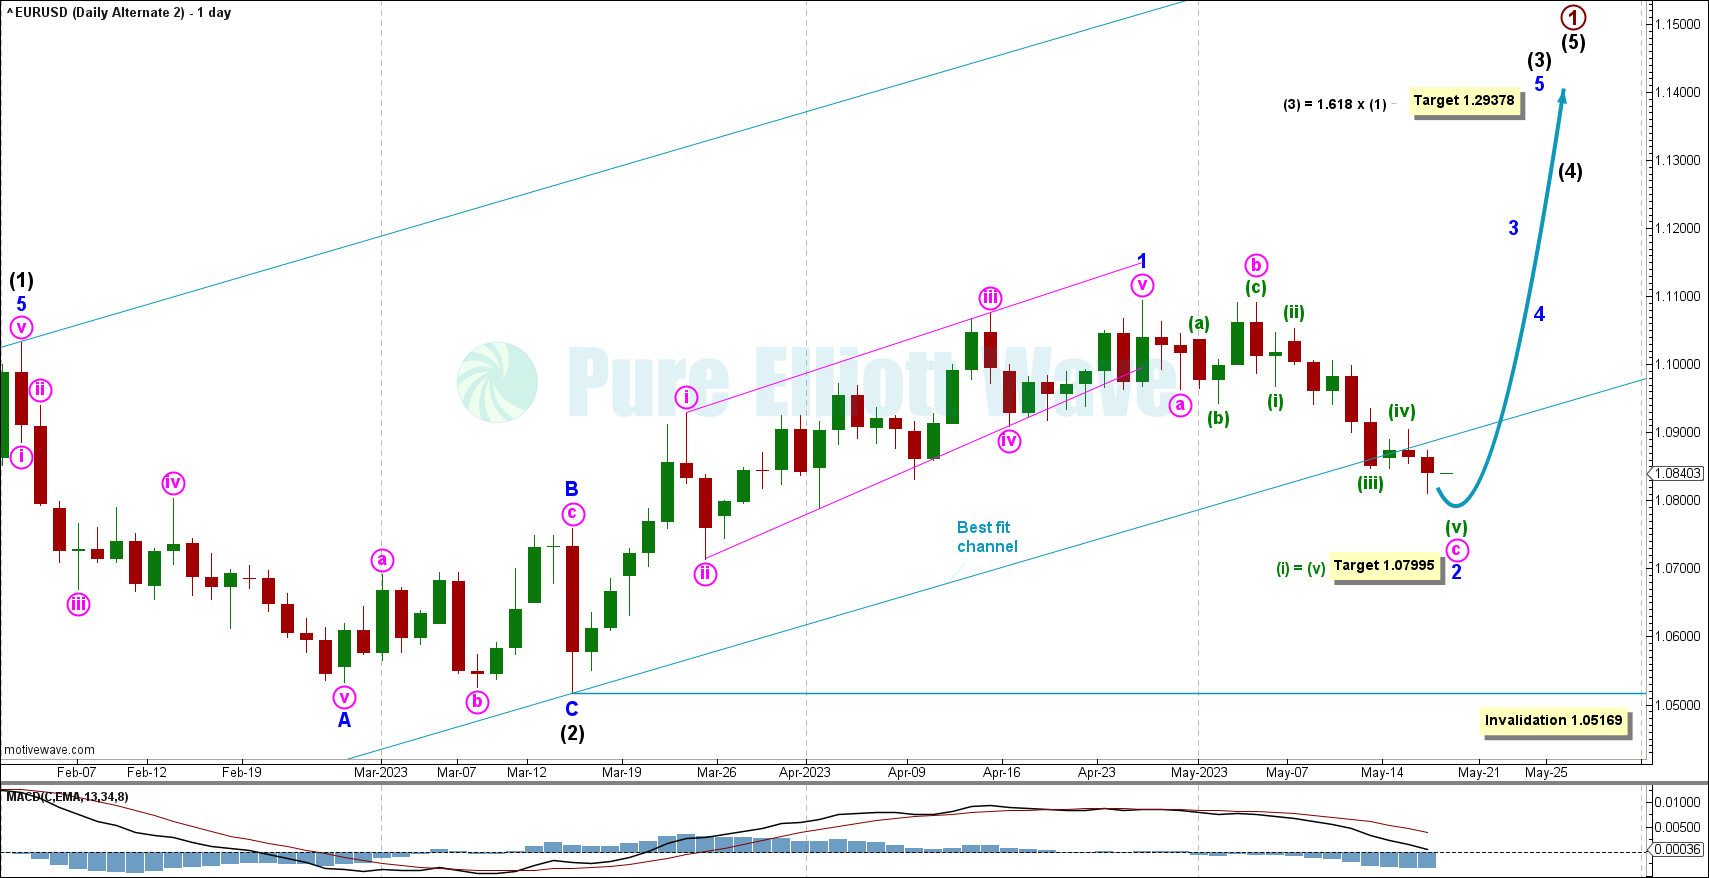
Click chart to enlarge.
This daily alternate wave count expects a nearly complete shallow pullback for minor 2.
This alternate expects a less severe pullback unfolding now, but has a lower probability given the brief shallow intermediate (2).
With minuette wave (iv) possibly complete, a target has been calculated for minuette wave (v) to reach equality in length with minuette wave (i) at 1.07589. There is no upwards invalidation for this alternate. Downwards invalidation sits below at the start of minor 1 at 1.05169.
Confidence in this alternate wave count would come if the main wave count invalidation point was breached above 1.09673.
ALTERNATE HOURLY CHART
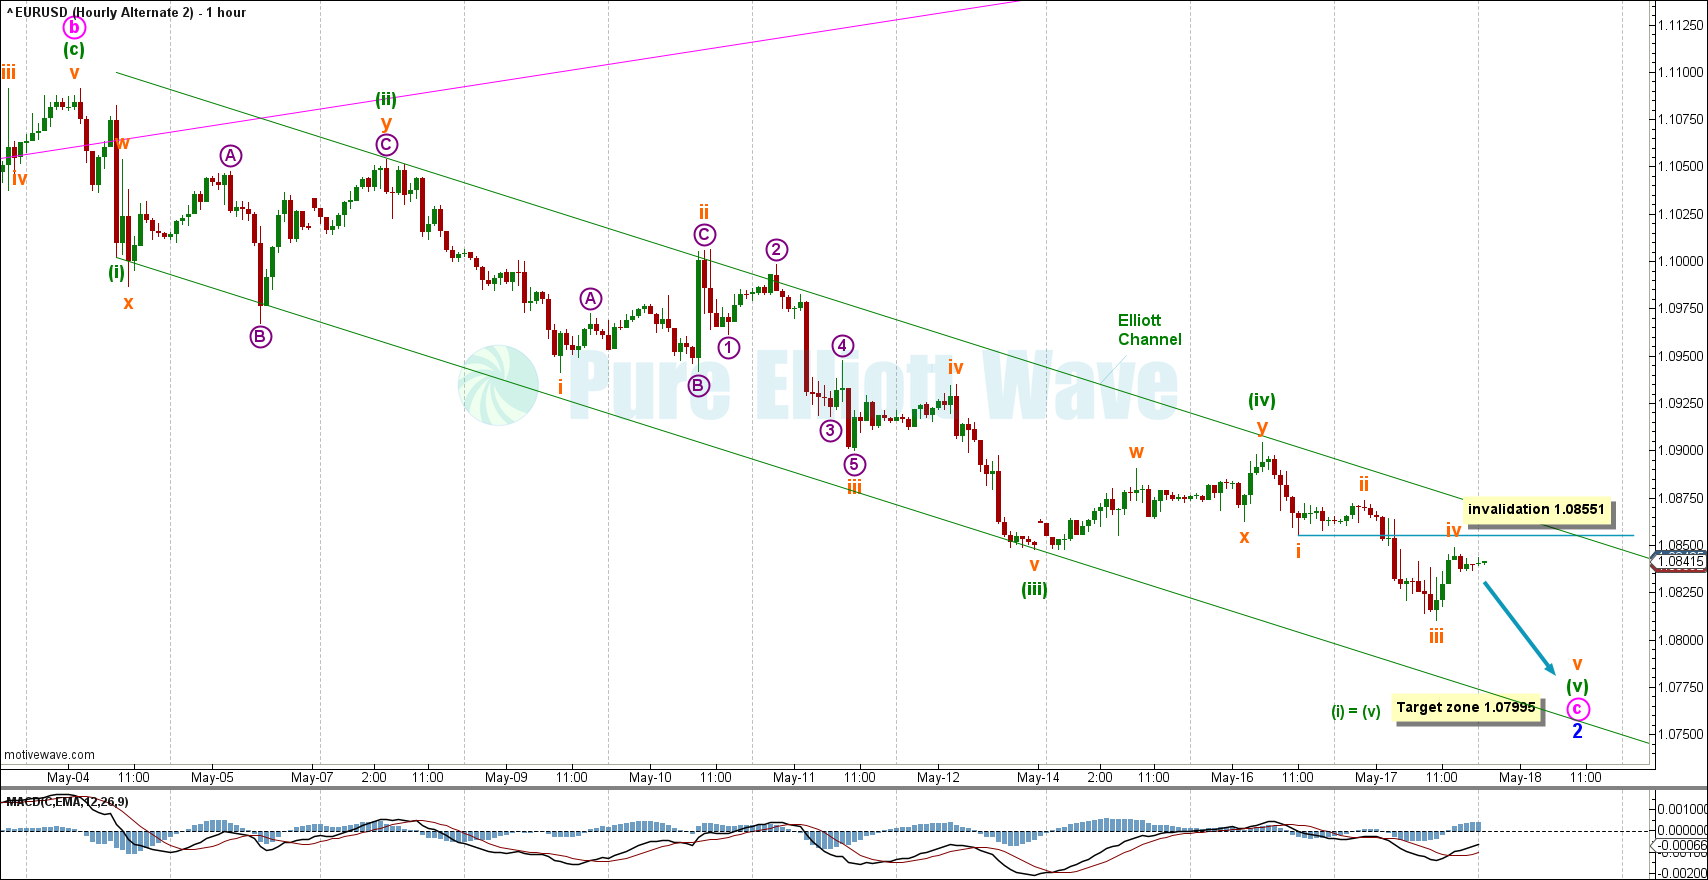
Click chart to enlarge.
This alternate reflects the short-term possibility that minor 2 may be very close to completion as a zigzag.
Within minor 2: Minute waves a and b are complete and minute wave C may be nearing completion.
Within minute wave c, minuette wave (iv) may not move into minuette wave (i) price territory above 1.10019.
The blue Elliott Channel has acted as resistance for the correction from minuette wave (iv). Minuette wave (v) could possibly reach the lower end of this channel and reach the nearby target of 1.07995, at which minuette wave (i) and minuette wave (v) would reach a common ratio of 1:1.
This count expects one more thrust downwards before bullish price action.
TECHNICAL ANALYSIS
WEEKLY VOLUME
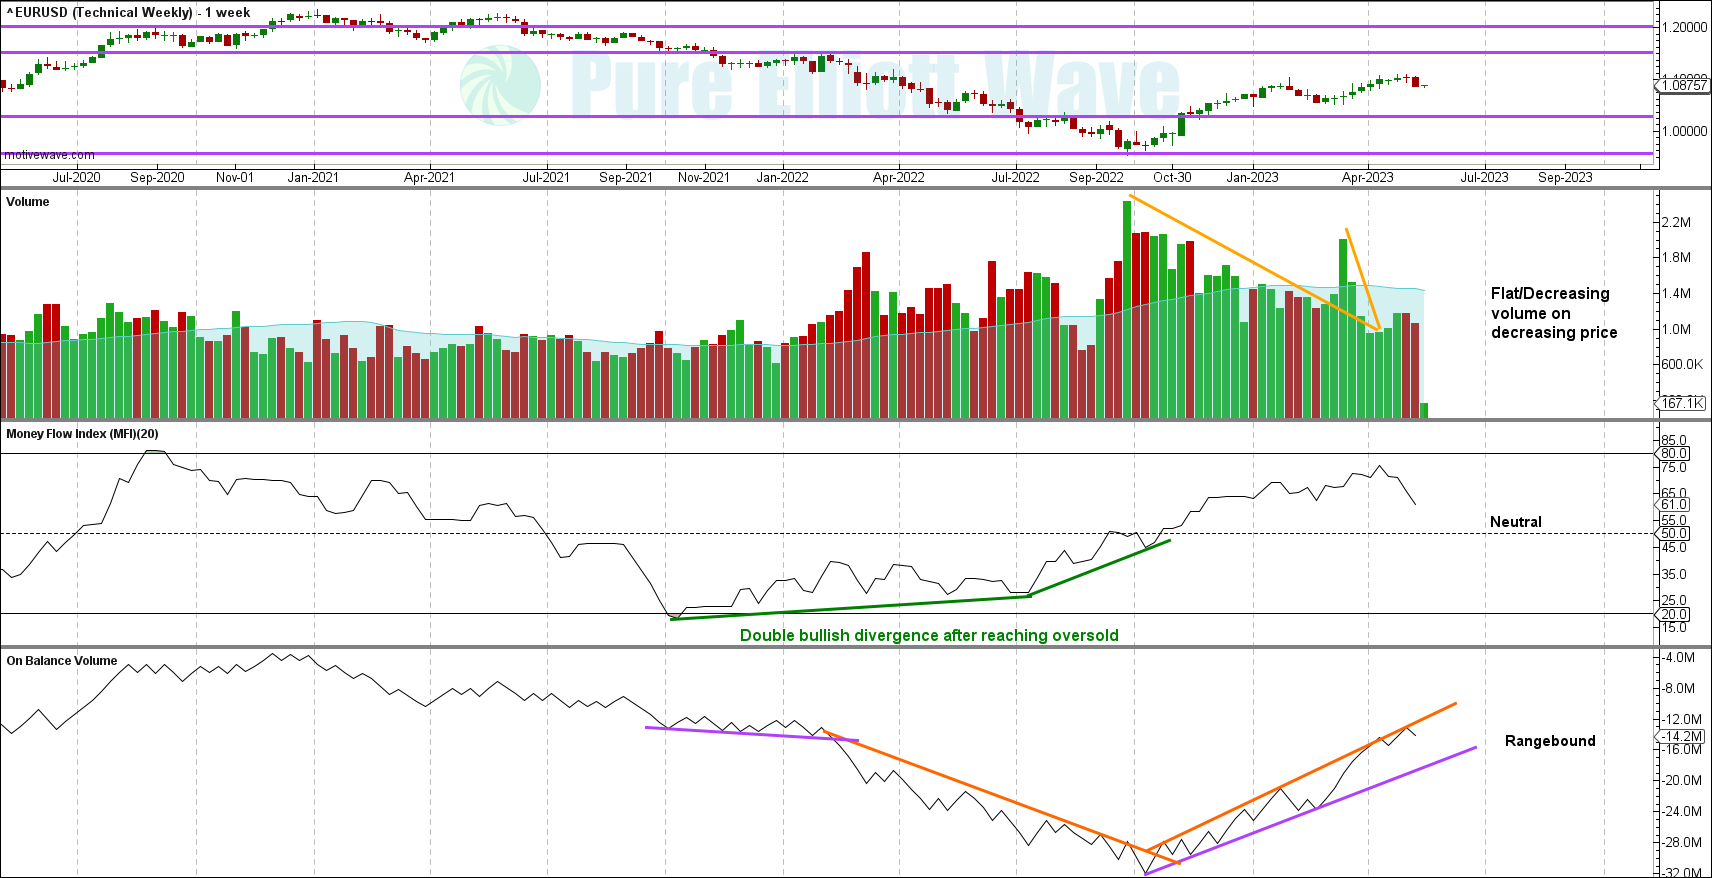
Click chart to enlarge.
Volume remains decreasing to flat with a new possible trend change. This is normal for the EURUSD coming off of tops.
WEEKLY TECHNICALS

Click chart to enlarge.
Last week’s candle was a strong bearish candle, supporting the top reversal patterns from the weeks before.
Next overhead resistance sits at 1.1170. Support below at 1.050.
ADX shows there is no longer a bullish trend.
This chart is bearish.
DAILY VOLUME
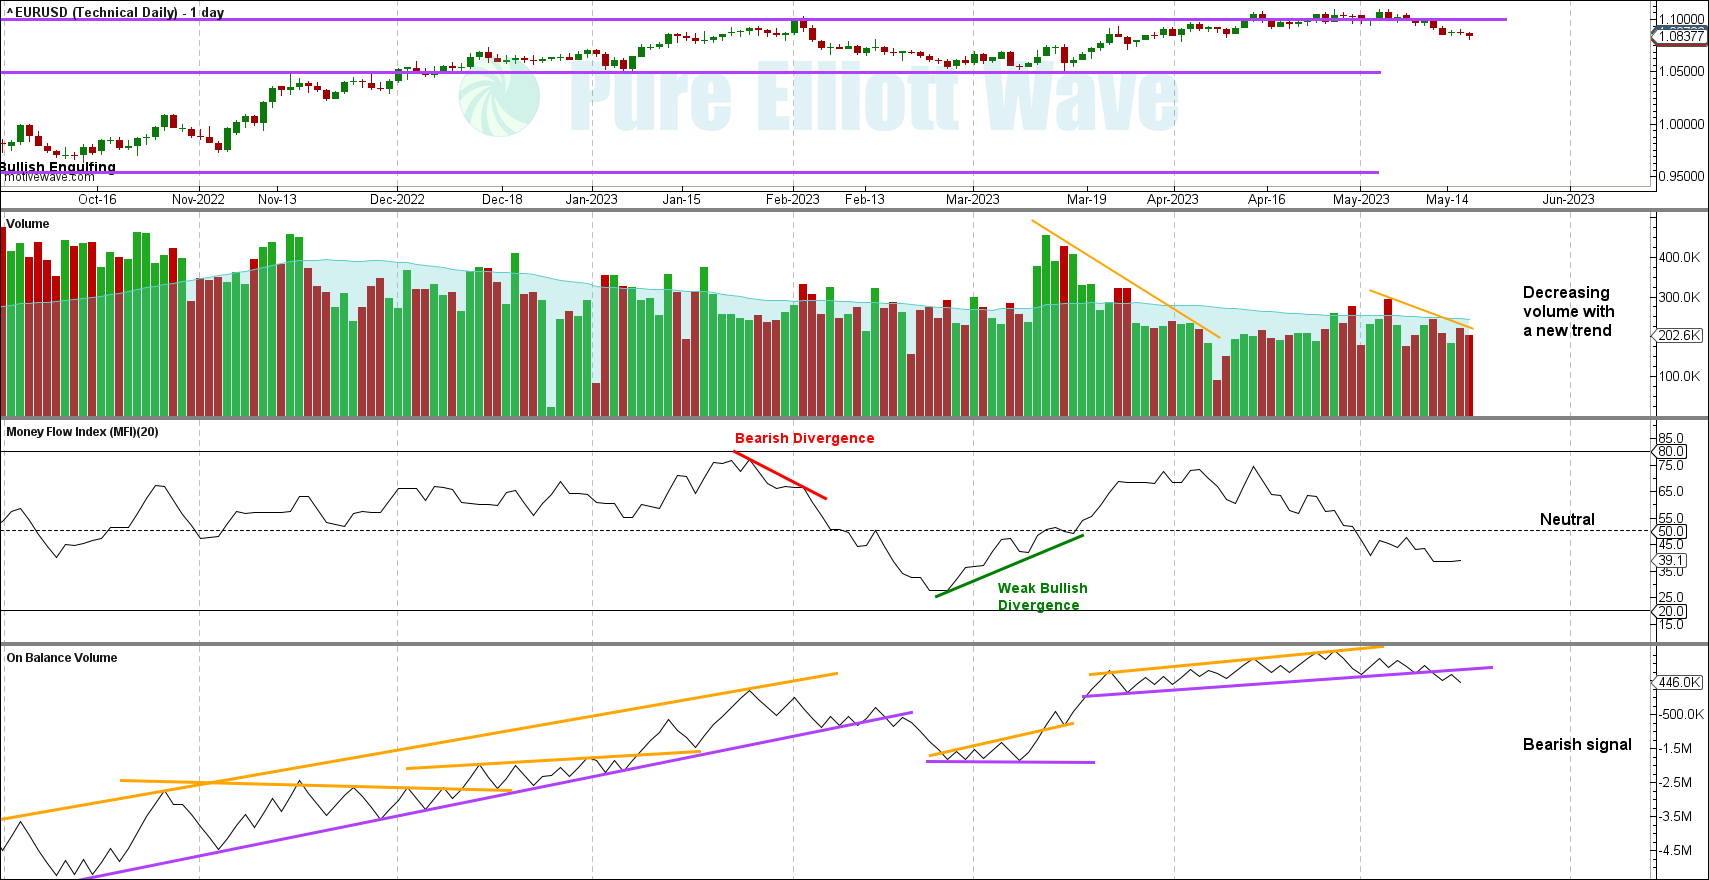
Click chart to enlarge.
The past week shows a decrease in volume with bearish price action. This is normal for tops on the EURUSD when studying past price/volume action.
There was a strong bearish signal from On Balance Volume. The signal is strong due to the slope being reasonably flat and the line tested 4-6 times and held for a reasonably long amount of time.
DAILY TECHNICALS
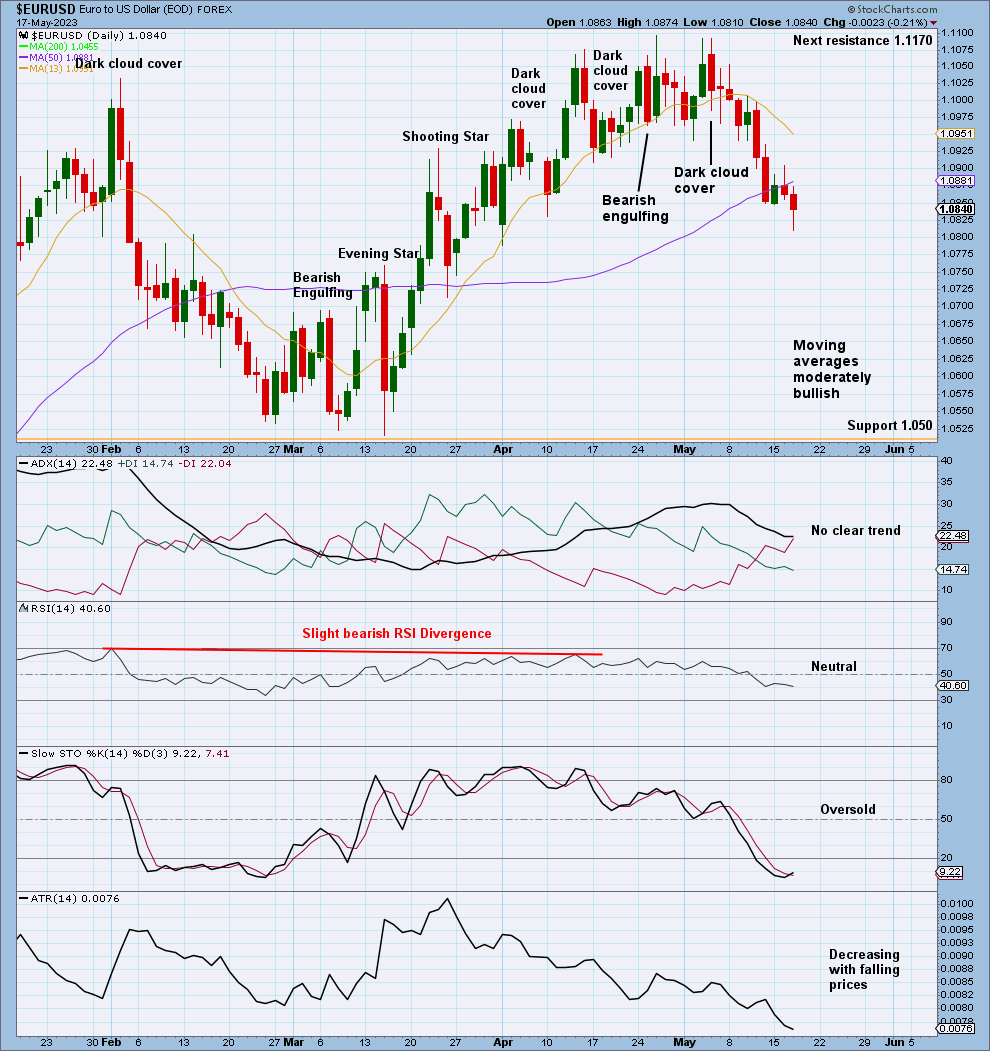
Click chart to enlarge.
Today’s candle has a slightly bullish lower wick.
ADX indicates the previous extreme trend has ceased.
With Stochastics oversold simultaneously with decreasing ATR and price, downside could be limited before another pullback happens.
The moving averages are moderately bullish, all sloping up, with the 13 day now sloping down.
This chart is bearish for the medium term.
For the short term, the bullish lower wick, declining range, and oversold Stochastics indicate that the downside may be limited before a pullback occurs.
Published @ 06:46 p.m. ET.
—
Careful risk management protects your trading account(s).
Follow our two Golden Rules:
1. Always trade with stops.
2. Risk only 1-5% of equity on any one trade.
—
New updates to this analysis are in bold.
—
 Save as PDF