June 30, 2023: Natural Gas Elliott Wave and Technical Analysis – Video and Charts
ELLIOTT WAVE COUNT
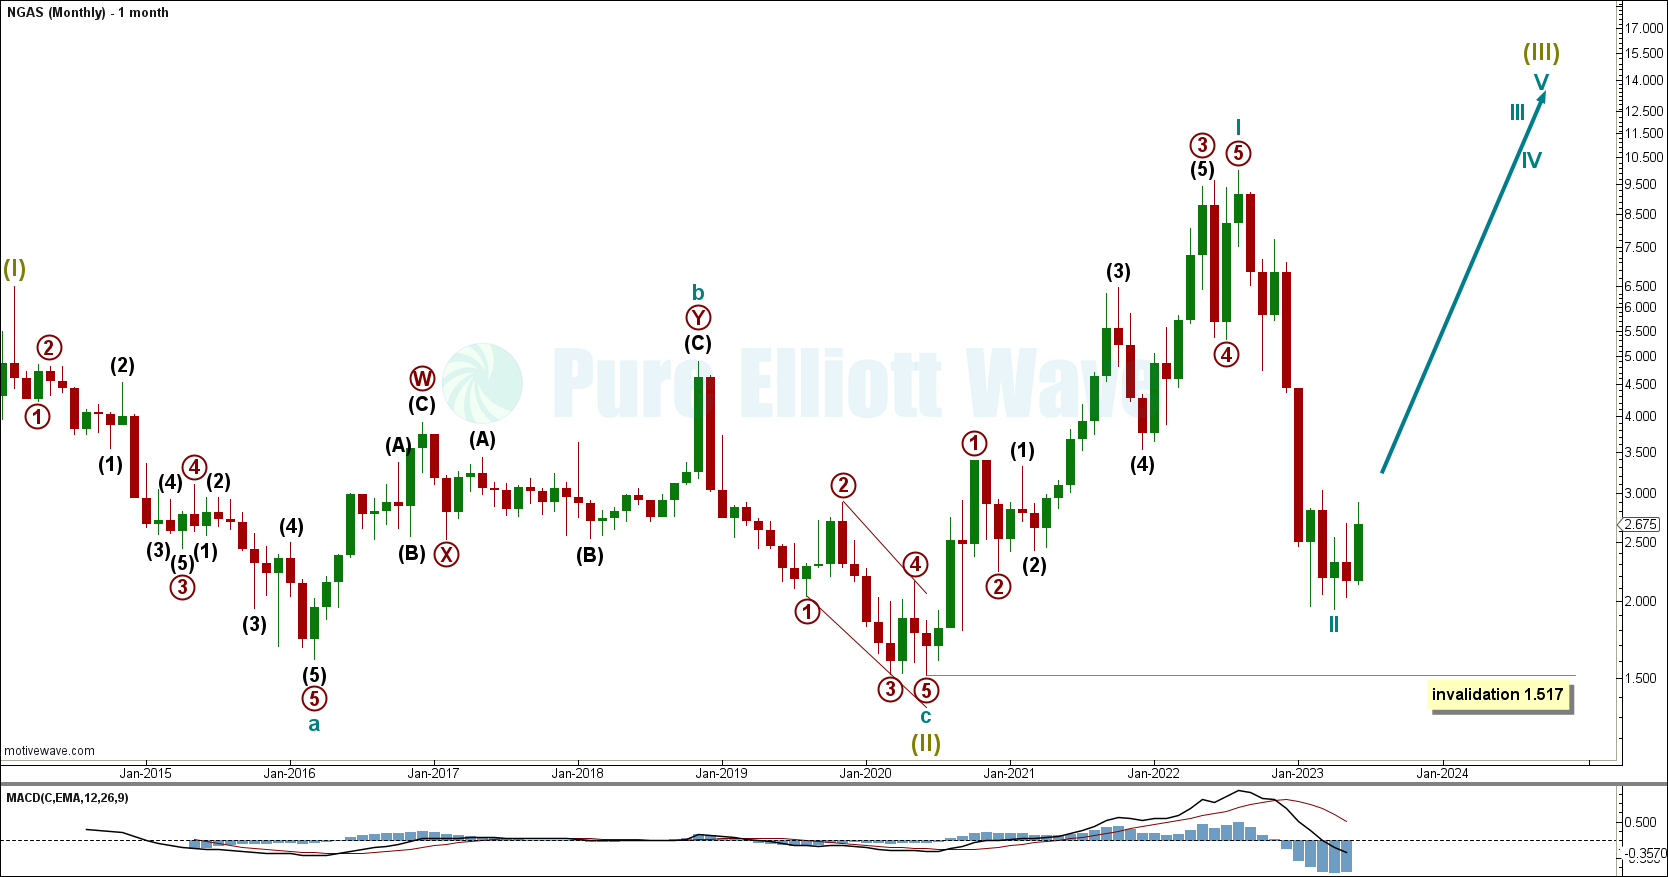
MONTHLY
Click chart to enlarge.
Data from FXCM for Natural Gas begins in June 2012.
An impulse higher ending in February 2014 is labelled as a potential first wave. The following bear market subdivides as a zigzag and is labelled as a complete second wave at Super Cycle degree.
A third wave up at Super Cycle degree may have begun. Within the third wave, cycle wave I may be either nearing an end (main wave count) or may already be complete (alternate wave count).
Cycle wave II may be complete at the last low, subdividing as a single zigzag. If it moves lower, then it may not move below the start of cycle wave I at 1.517.
Cycle wave III is now expected to push price higher. It must make a new high above the end of cycle wave I and may only subdivide as an impulse.
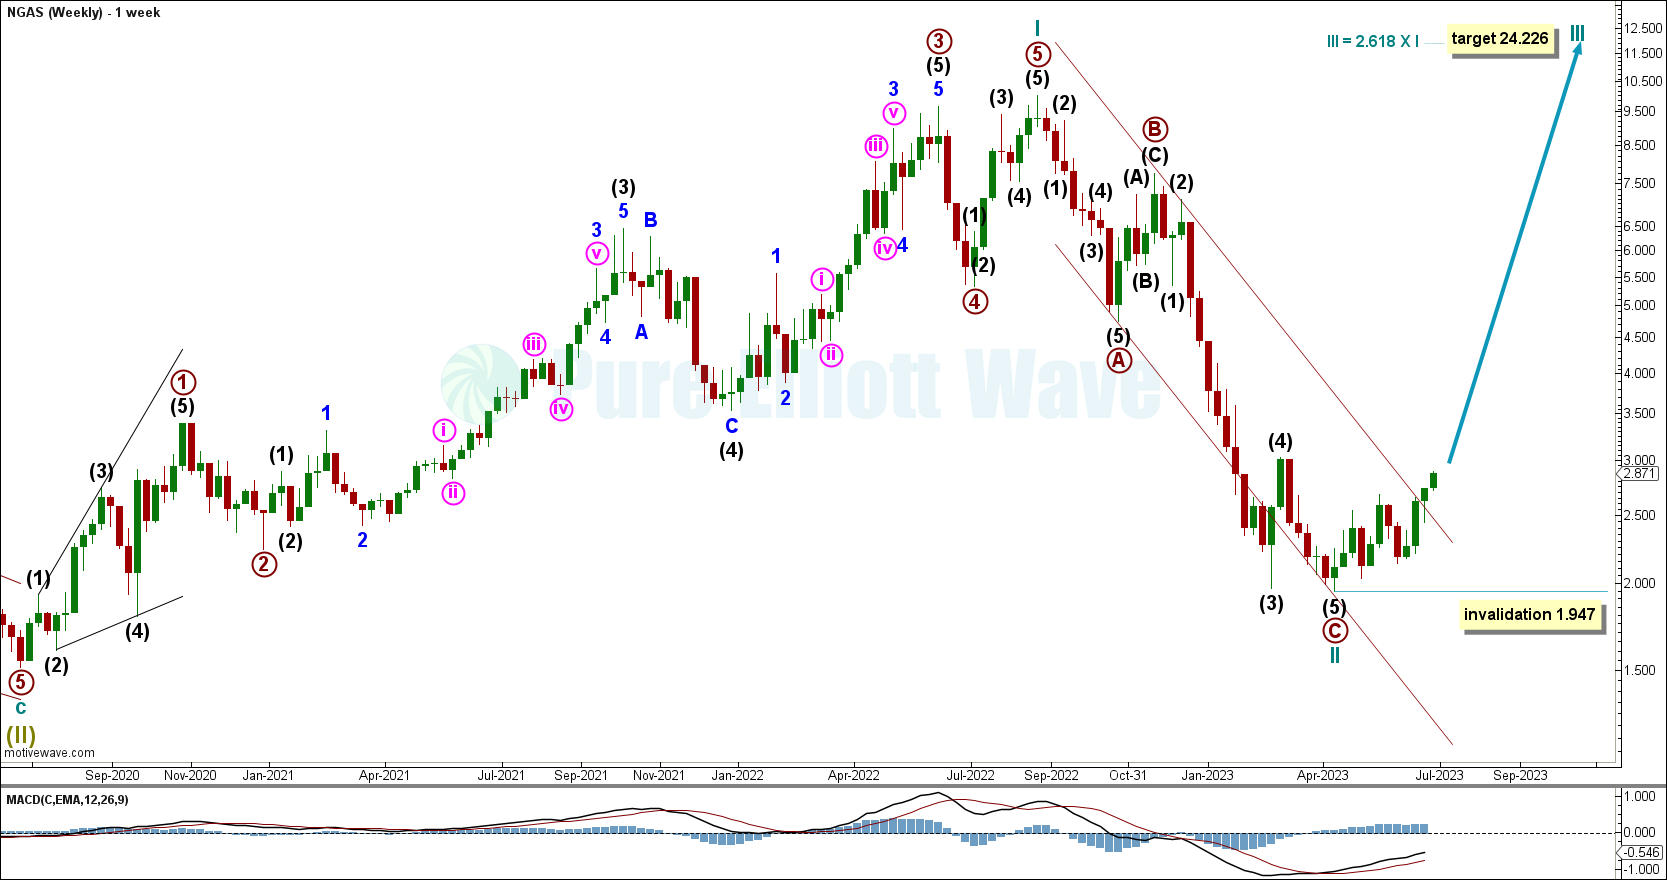
WEEKLY
Click chart to enlarge.
Cycle wave II subdivides well as a single zigzag.
The channel which contains cycle wave II is breached by a full weekly candlestick above and not touching the upper edge. This meets our definition of a channel breach and adds confidence that the bear market of cycle wave II may be complete and cycle wave III may have begun.
A corrective movement within cycle wave III cannot move below its start at 1.947.
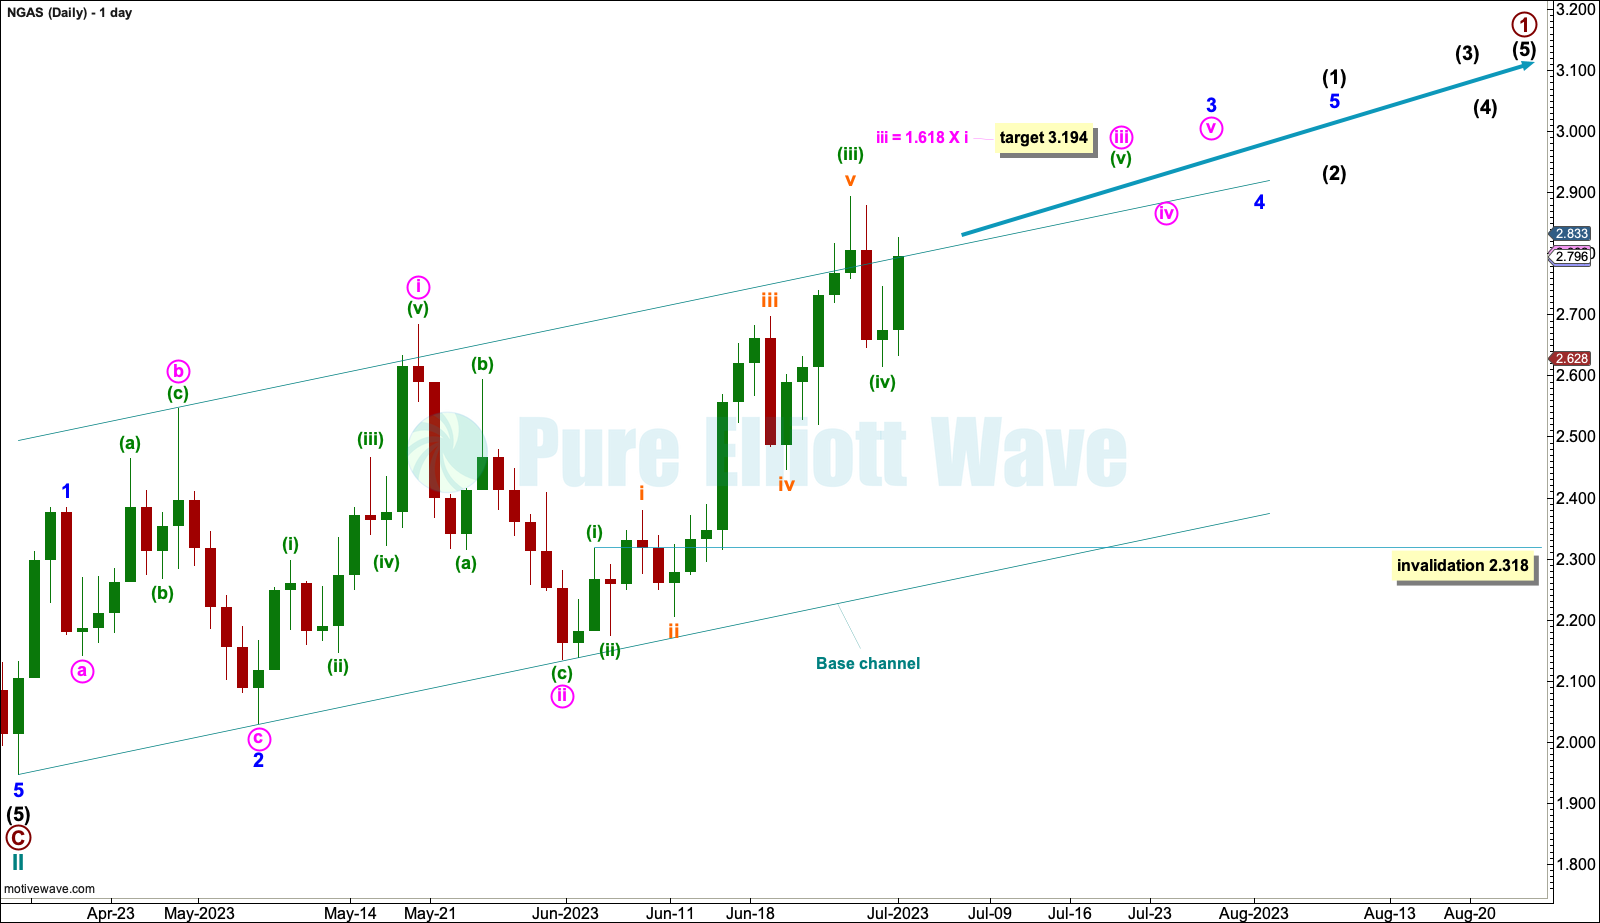
DAILY
Click chart to enlarge.
Within cycle wave III, primary wave 1 may be incomplete.
Within primary wave 1, intermediate wave (1) may be incomplete.
Within intermediate wave (1): Minor waves 1 and 2 may be complete and, within minor wave 3, minute waves i and ii may be complete. This wave count now expects overlapping third waves to push price higher with increased momentum.
Within minute wave iii of minor wave 3, minuette waves (i) through to (iv) may be complete. If minuette wave (iv) continues lower, then it may not move into minuette wave (i) price territory below 2.318.
At 3.194 minute wave iii would reach 1.618 the length of minute wave i.
TECHNICAL ANALYSIS
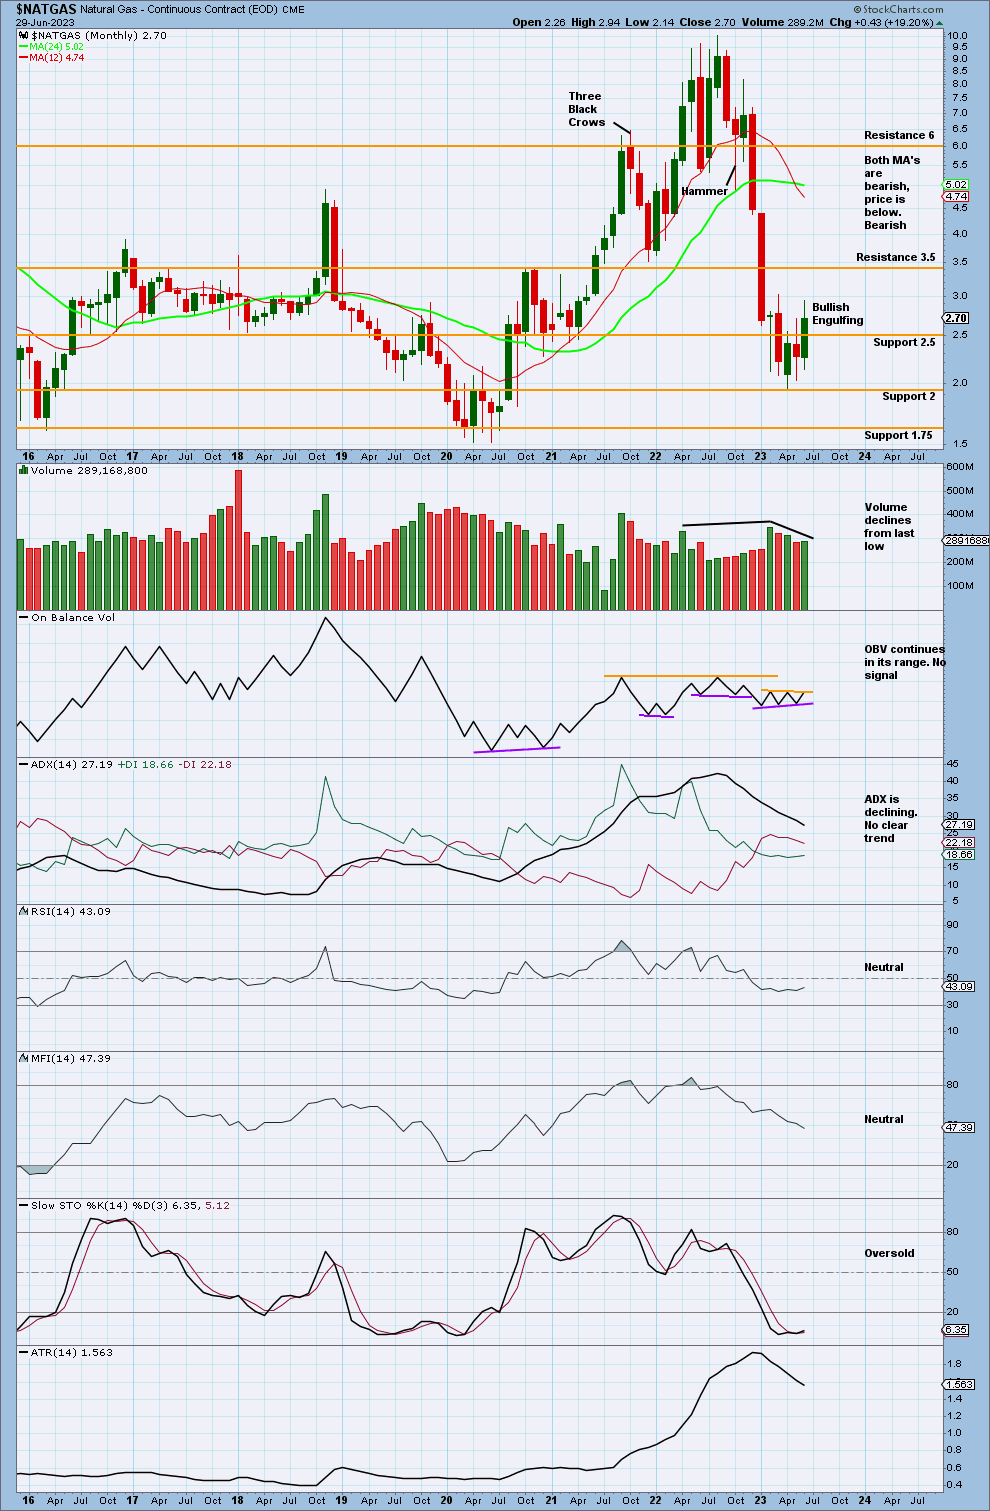
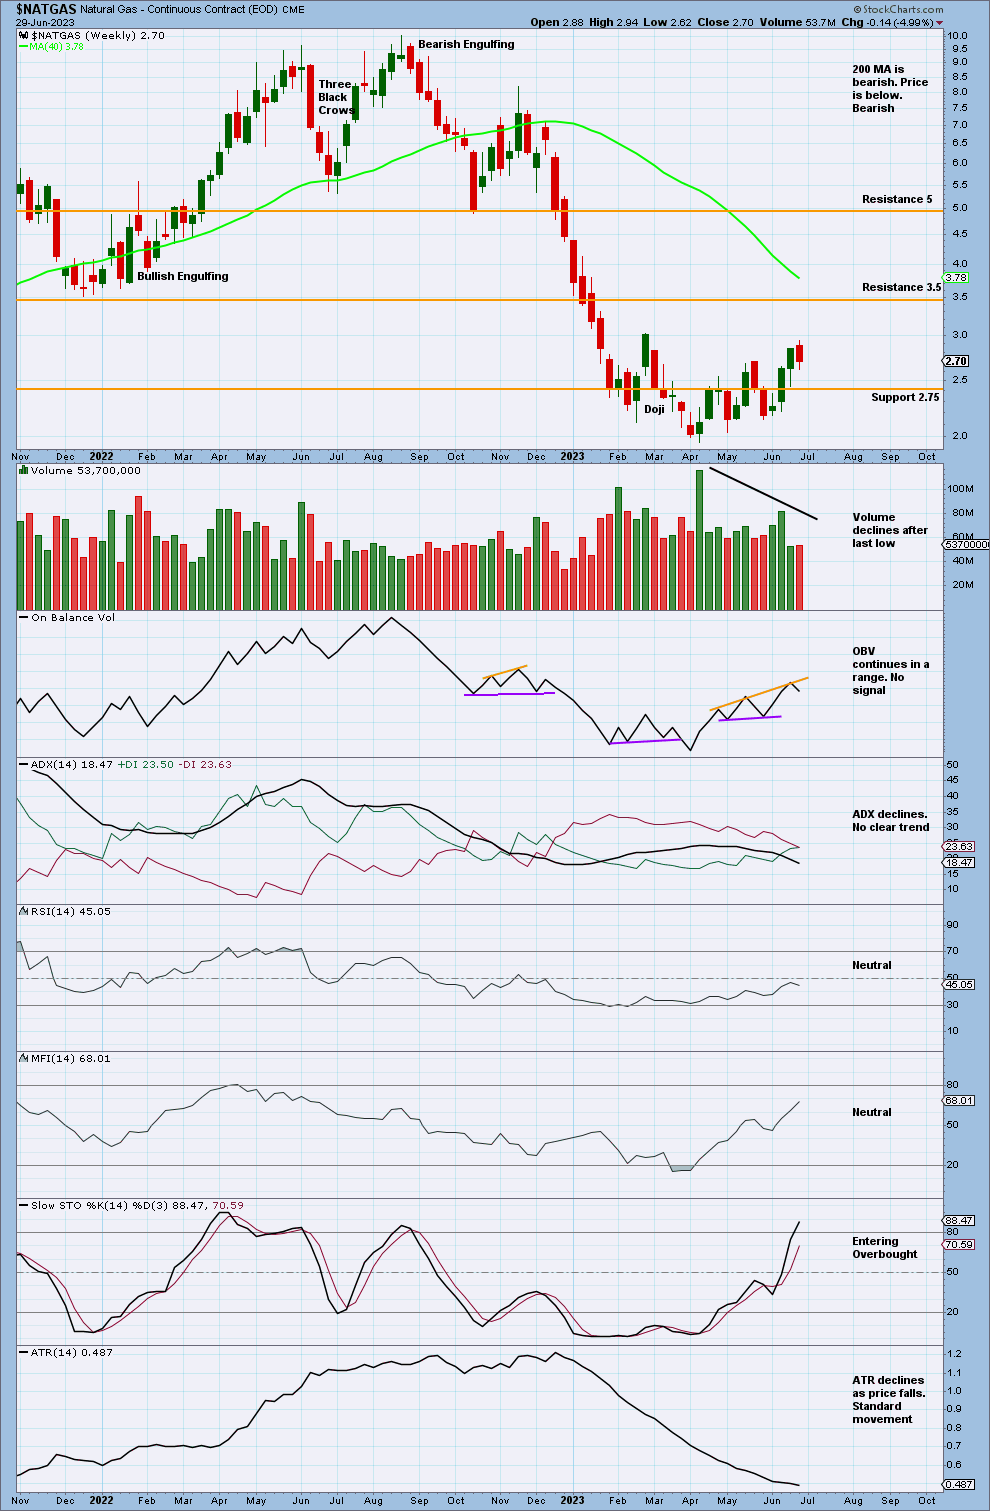
MONTHLY
Click chart to enlarge.
Price has begun to move up from its last low, finding support at 2.
Volume declines, indicating weakness in bullish movements. However, the Bullish Engulfing pattern does have a little support from volume.
ADX indicates no clear trend.
Stochastics is oversold. Price may continue upwards until it reaches resistance and Stochastics reaches overbought. Next resistance is about 3.5.
WEEKLY
Click chart to enlarge.
In recent weeks, upwards weeks exhibit strongest volume. The short-term volume profile is bullish.
Price has found a consolidation area around support/resistance at 2.75.
Stochastics is entering overbought. It may continue to reach fully overbought while price reaches next resistance about 3.5.
DAILY
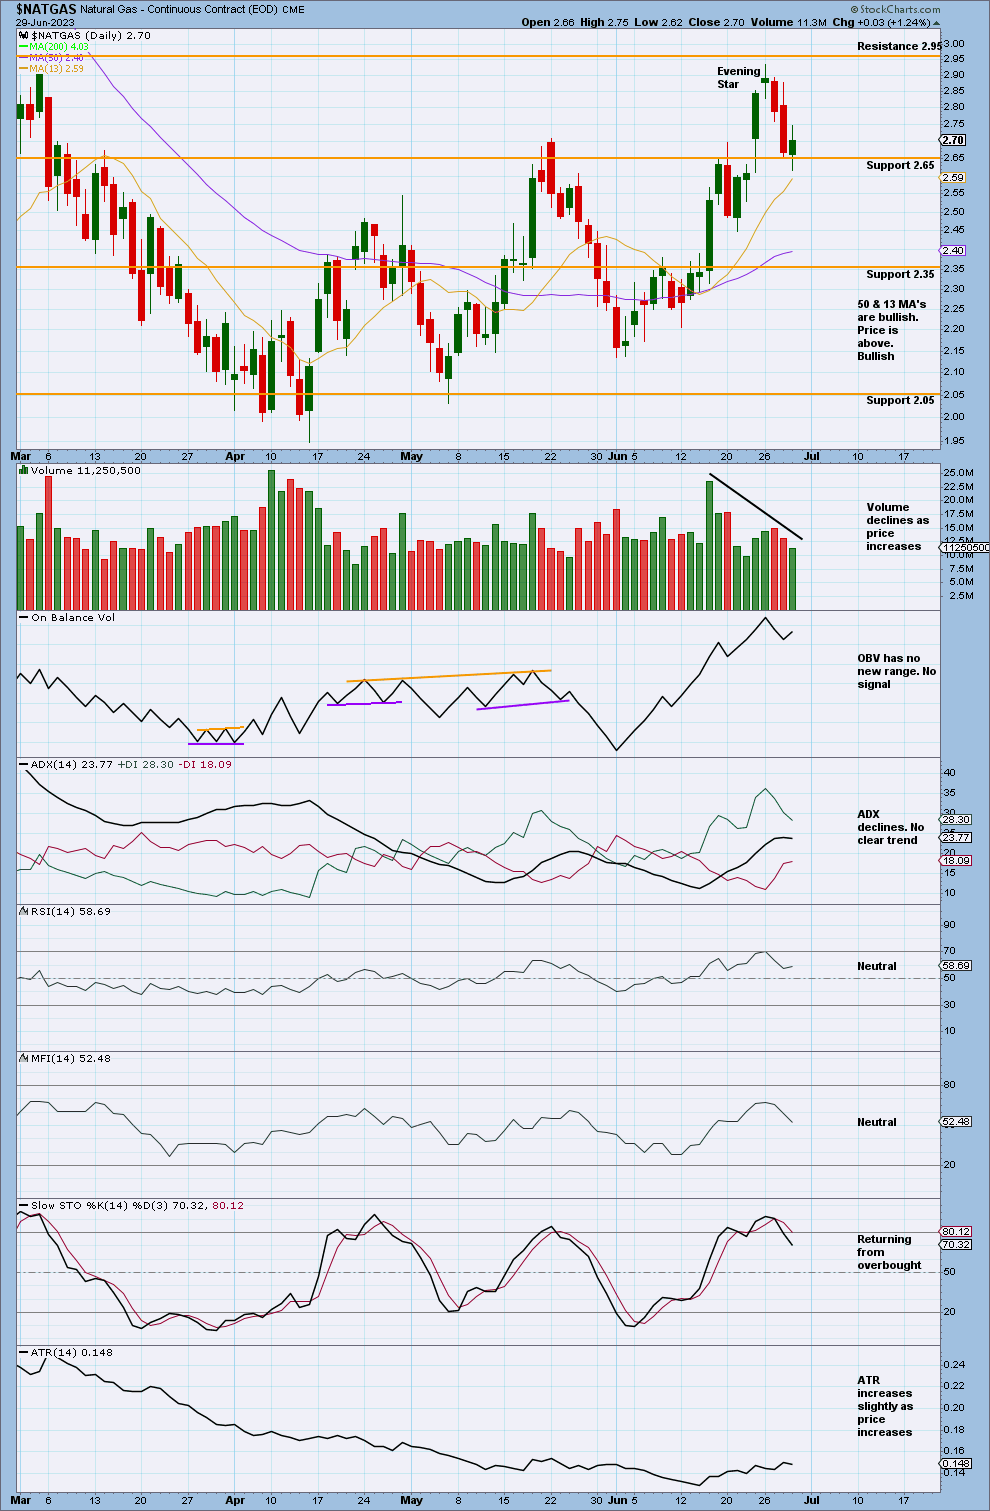
Click chart to enlarge.
At the last short-term high was an evening star candlestick pattern.
In this instance, we will use the model of Stochastics plus support and resistance on weekly and monthly time frames.
Published @ 12:55 p.m. ET on July 1, 2023.
—
Careful risk management protects your investments.
Follow my two Golden Rules:
1. Invest only funds you can afford to lose.
2. Have an exit plan for both directions – where or when to take profit, and when to exit a losing investment.
 Save as PDF