What is Elliott Wave Analysis: A Beginner’s Guide
Elliott Wave analysis is a powerful tool used in technical analysis to identify and analyze market trends. It is based on the observation that markets move in waves, with each wave representing a specific stage in the market’s overall trend. By understanding and applying the principles of Elliott Wave analysis, traders and investors can gain valuable insights into market dynamics.
However, it’s important to note that effective Elliott Wave analysis requires strict adherence to the Elliott Wave rules. Deviating from these rules can undermine the accuracy and reliability of the analysis. Therefore, practitioners of Elliott Wave need to ensure that their analysis consistently meets all the rules of the Elliott Wave Principle.
To learn Elliott Wave analysis, it’s essential to grasp the fundamental principle that, according to the Elliott Wave Principle, market trends follow a specific pattern consisting of five waves in the direction of the trend, known as motive waves, and three waves against the trend, known as corrective waves. When counting Elliott Waves,these waves are labeled as follows:
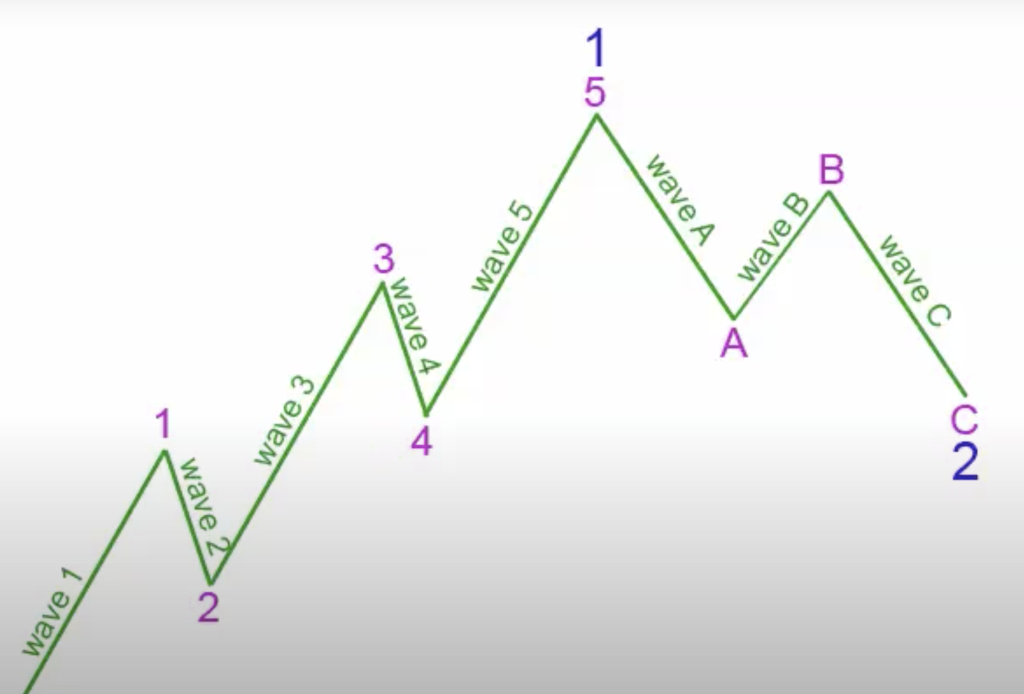
Motive Waves: Motive waves move in the direction of the trend and consist of five waves. Motive waves are labeled 1, 2, 3, 4 and 5.
Corrective waves: Corrective waves move against the trend and consist (almost always) of three waves. These waves are labeled A, B, and C.
Motive waves, labeled as 1, 2, 3, 4, and 5, move in the direction of the prevailing trend. They are often characterized by strong and decisive price movements. On the other hand, corrective waves, labeled as A, B, and C, move against the trend and are typically characterized by choppier and overlapping price action as the market consolidates.
By identifying these waves and understanding their characteristics, you can assess the strength and potential duration of a trend. Motive waves provide insights into the underlying momentum and strength of the market, while corrective waves offer opportunities for market consolidation and potential trend reversals.
It’s important to note that Elliott Wave analysis is not solely based on wave counting. It also incorporates other technical analysis tools and indicators to support and validate wave patterns. Fibonacci retracements, trendlines, and moving averages are commonly used in conjunction with Elliott Wave analysis to enhance its effectiveness.
The utilization of Elliott Wave analysis for precise trend identification presents a potent methodology to examine market trends and make well-informed investment decisions. By understanding the principles of Elliott Wave and consistently following the established rules, you can acquire a more profound comprehension of market dynamics and potentially enhance your investment results. For more overviews on Elliott Wave structure visit our resources section.