Diagonals – Rewriting One Elliott Wave Rule
For a long time I have suspected that within diagonals the third wave may be the longest actionary wave, that is the longest of waves 1, 3 and 5. Now, following some extensive research, I have found several examples of both leading and ending diagonals where their third waves are the longest. Those examples are noted in this article.
For a long time the rules regarding wave lengths of diagonals were written in “Pure Elliott Wave” as follows:
“For contracting diagonals the fourth wave must be shorter than the second, the fifth wave must be shorter than the third, and the third wave must be shorter than the first.
For expanding diagonals the fourth wave must be longer than the second, the fifth wave must be longer than the third, and the third wave must be longer than the first.”
Phrases in italics are the important points to note which are now changed.
Given the following examples which fit into a complete Elliott Wave count which meets all Elliott Wave rules at all degrees, the rules regarding wave lengths for diagonals will be rewritten as follows:
“For contracting diagonals the fourth wave must be shorter than the second, the third wave is usually shorter than the first wave and the fifth wave must be shorter than the first. The third wave may not be the shortest of one, three and five, and may sometimes be the longest.
For expanding diagonals the fourth wave must be longer than the second, the third wave must be longer than the first and the fifth must be longer than the first. Sometimes the third wave is the longest of waves one, three and five.”
Phrases in bold are new.
This fits with third wave personality. Third waves are typically the longest and strongest portion of an impulse, and so it makes sense that within diagonals they may also be the longest actionary wave.
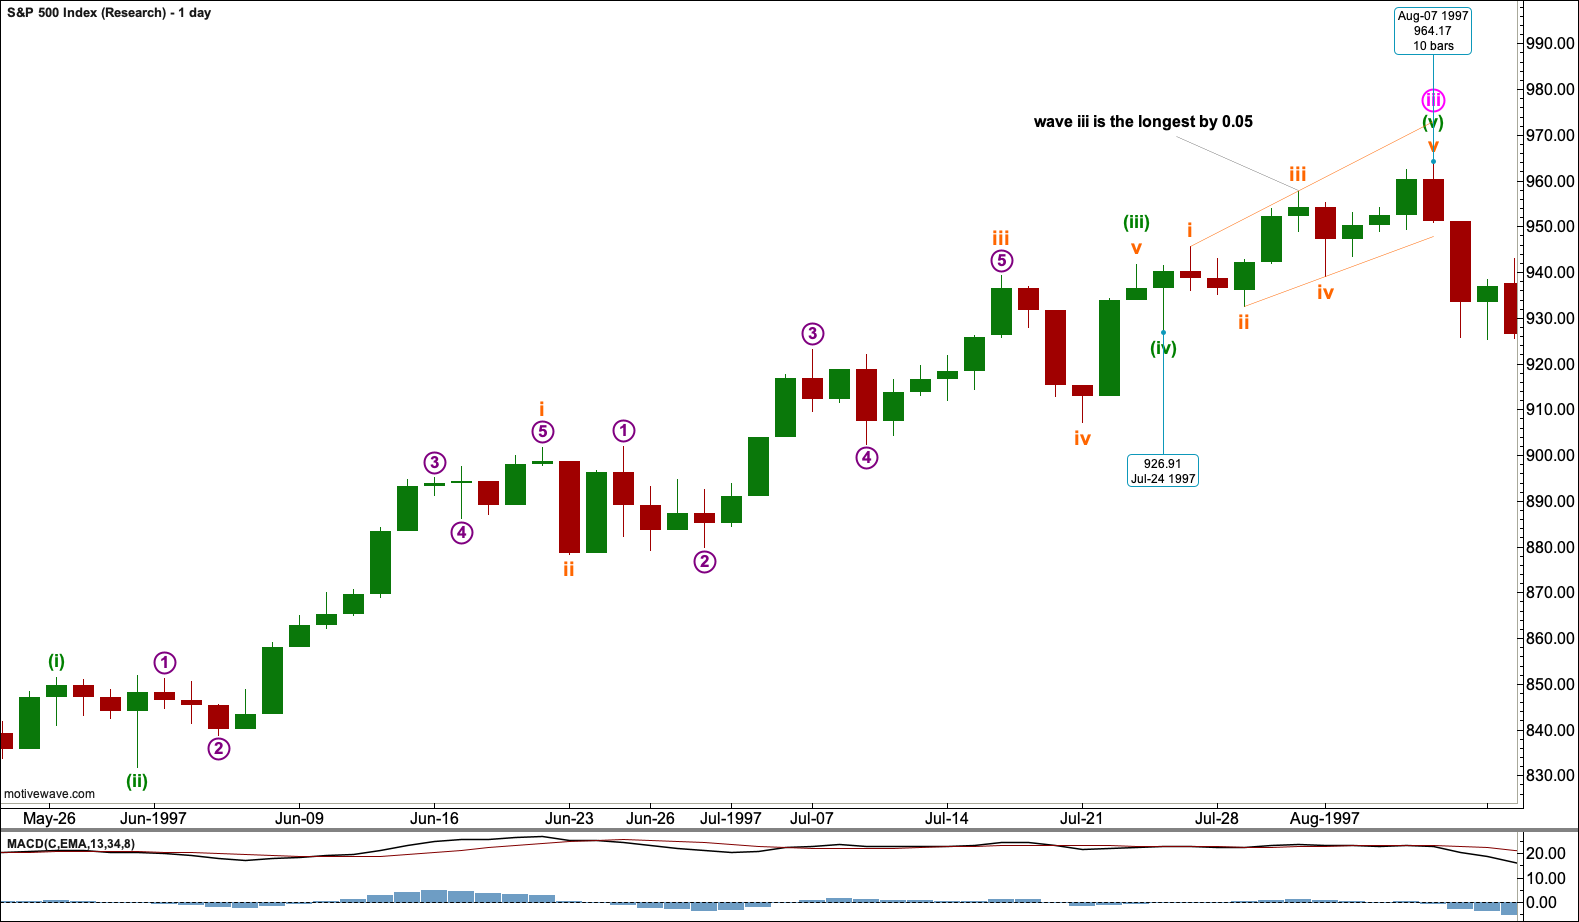
Click chart to enlarge.
This example is an ending expanding diagonal from the S&P 500 from 1997.
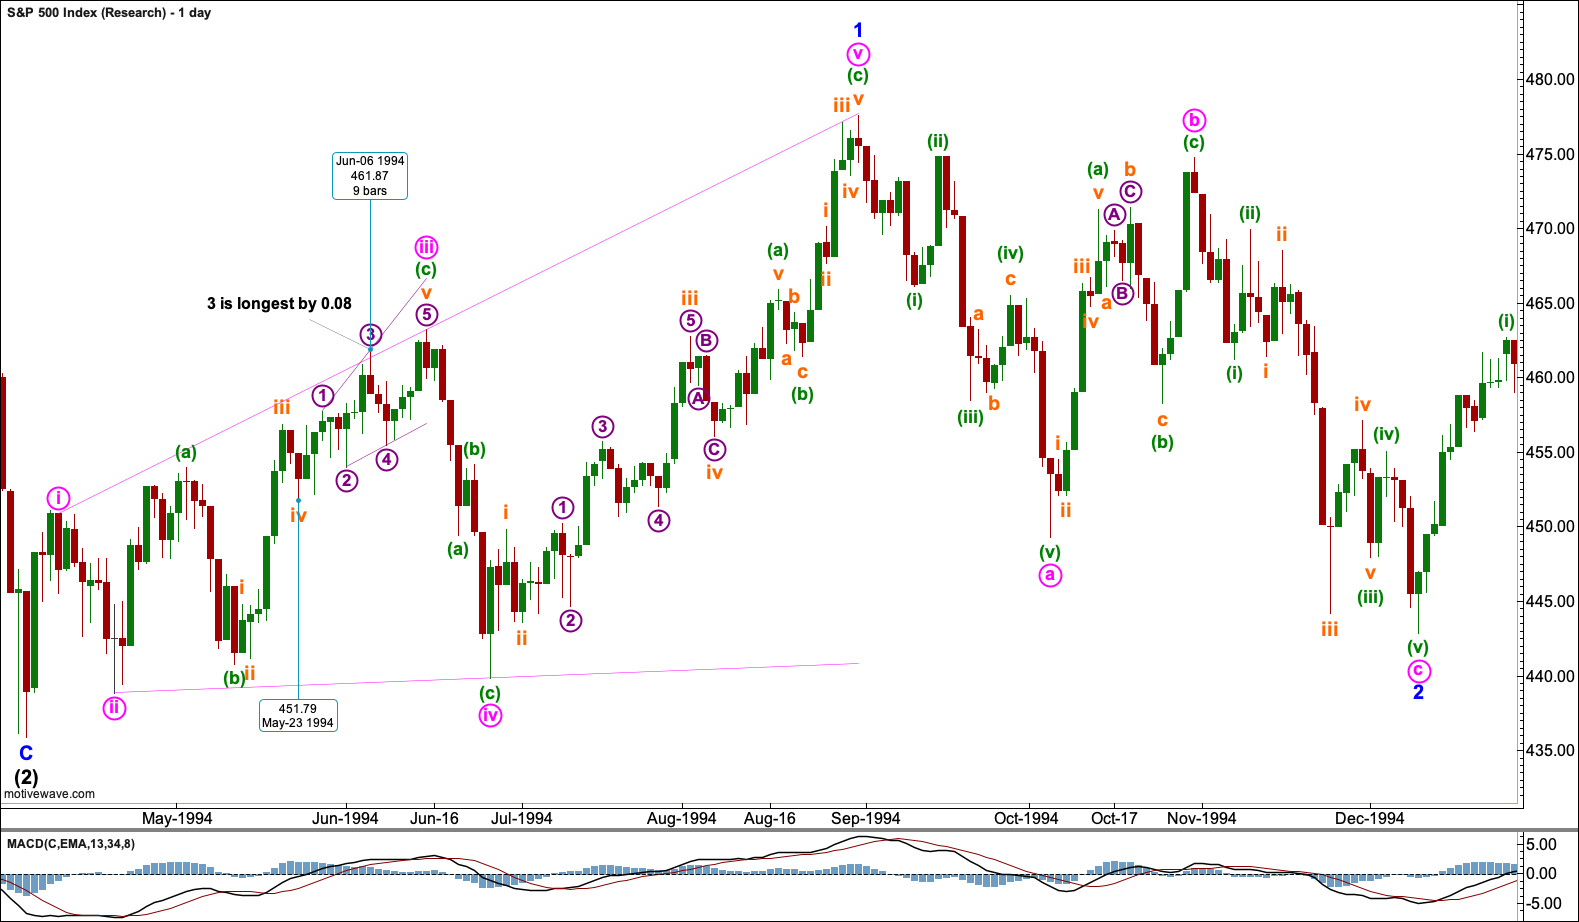
Click chart to enlarge.
This example is an ending expanding diagonal from the S&P 500 from 1994.
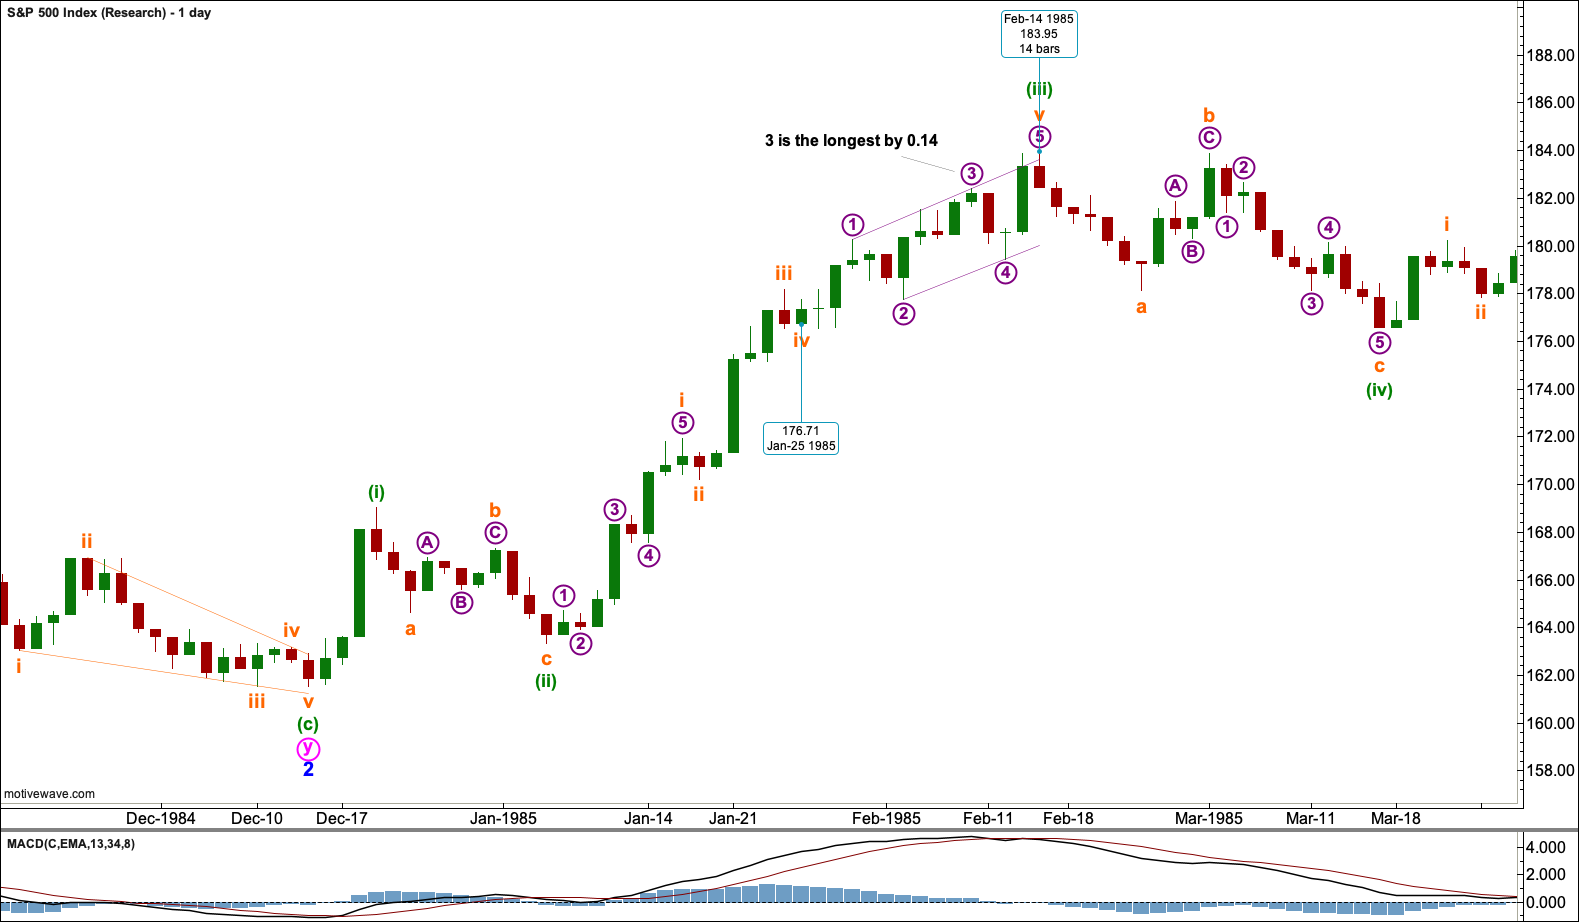
Click chart to enlarge.
This example is an ending contracting diagonal from the S&P 500 from 1985.
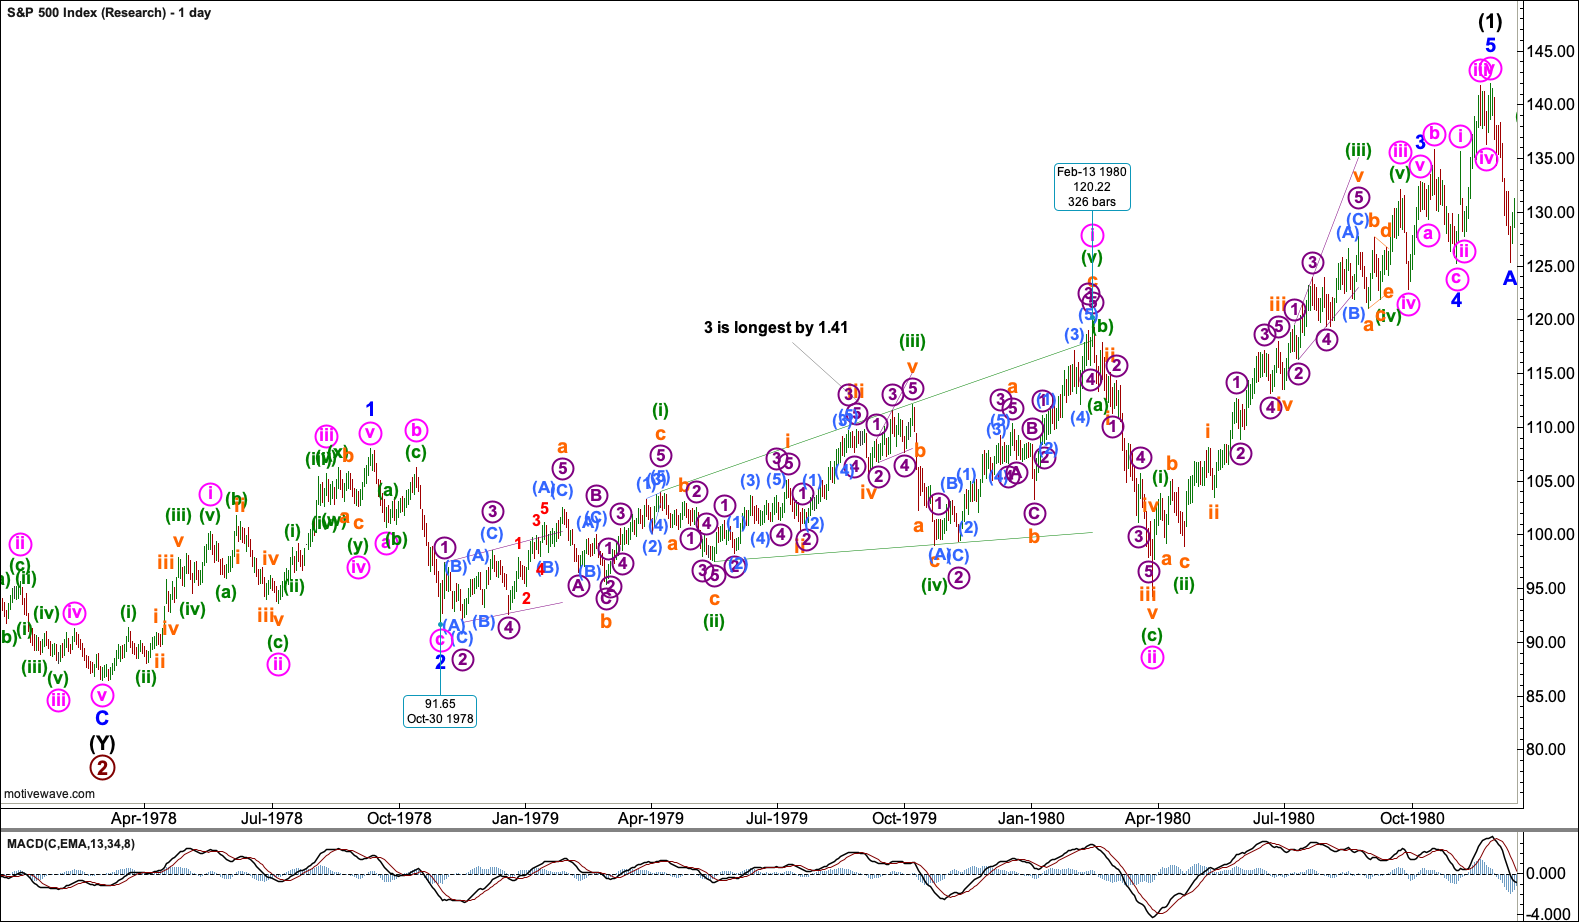
Click chart to enlarge.
This example is a leading expanding diagonal from the S&P 500 from 1979 to 1980.
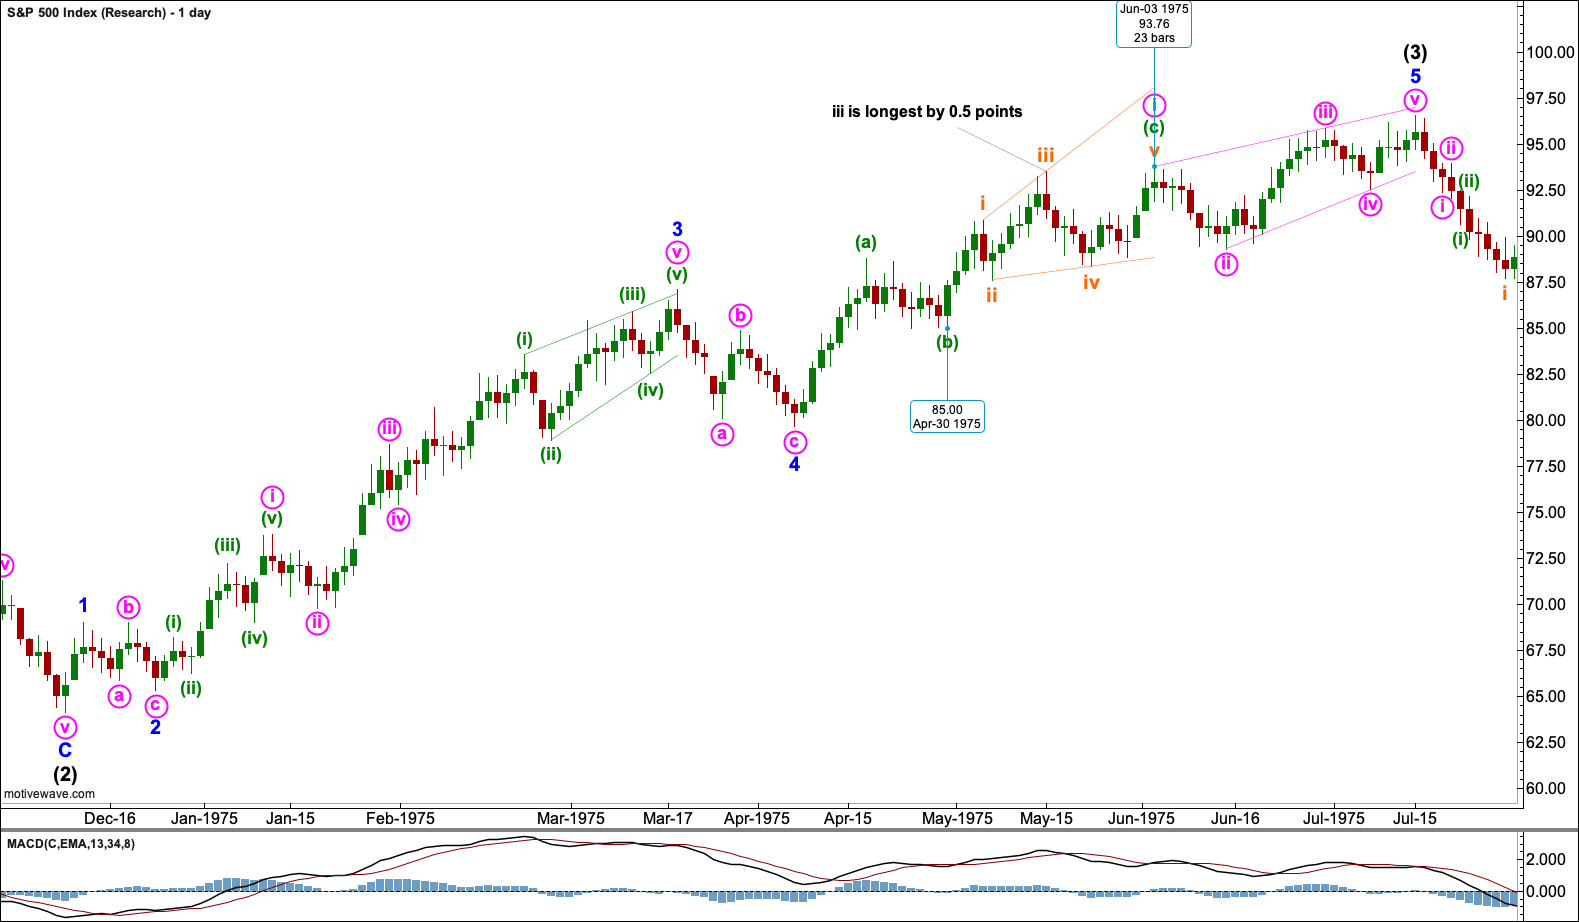
Click chart to enlarge.
This example is an ending expanding diagonal from the S&P 500 from 1975.
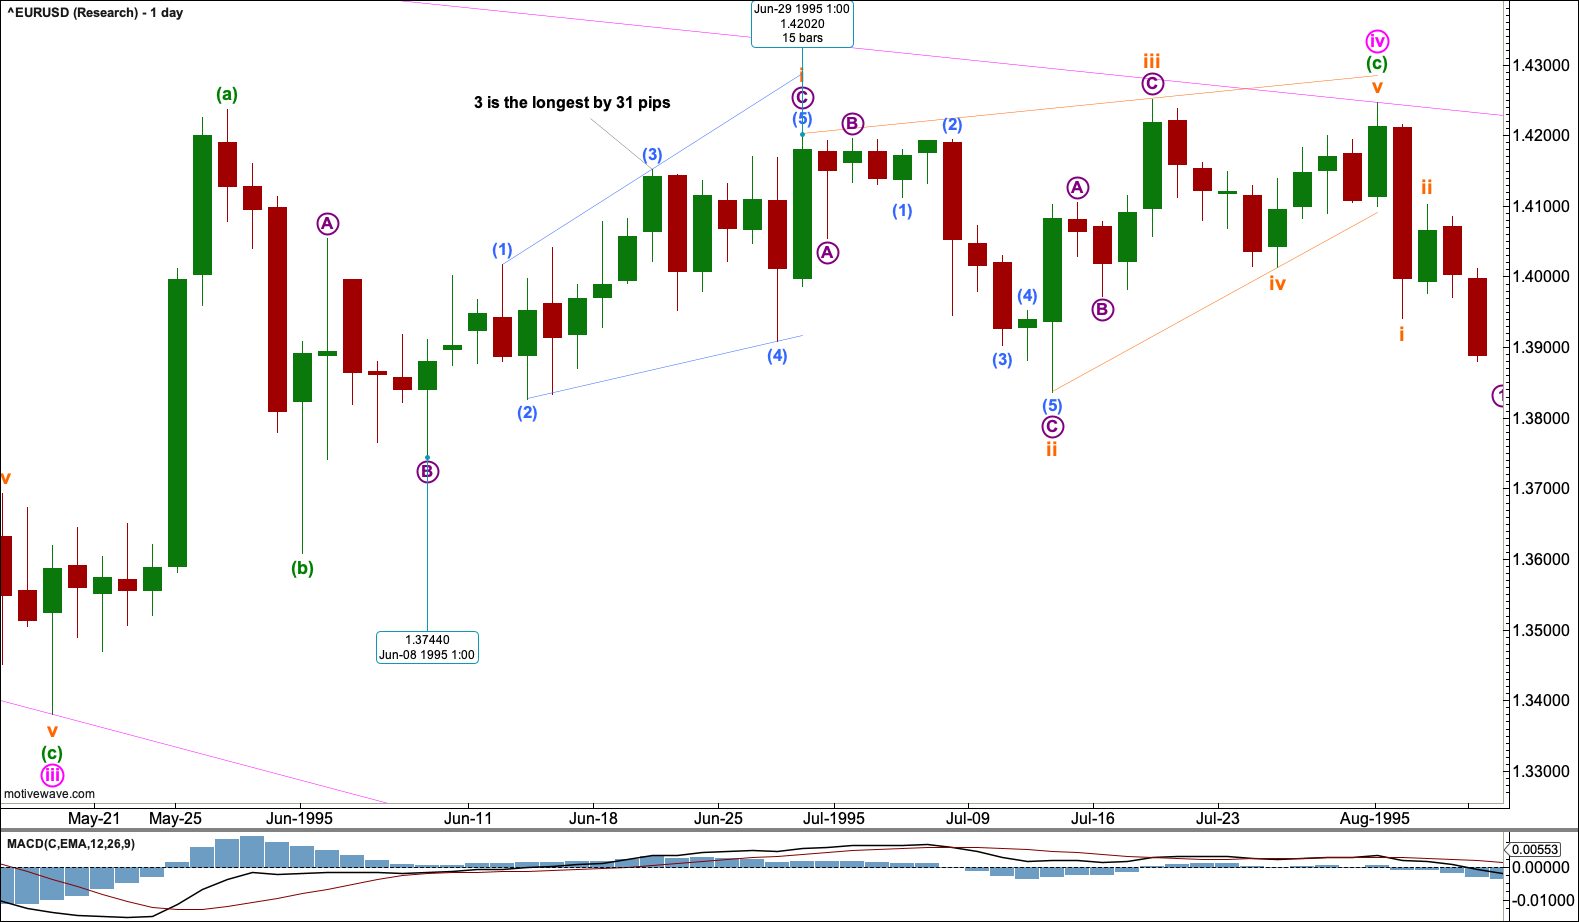
Click chart to enlarge.
This example is an ending expanding diagonal from the EUR/USD from 1995
.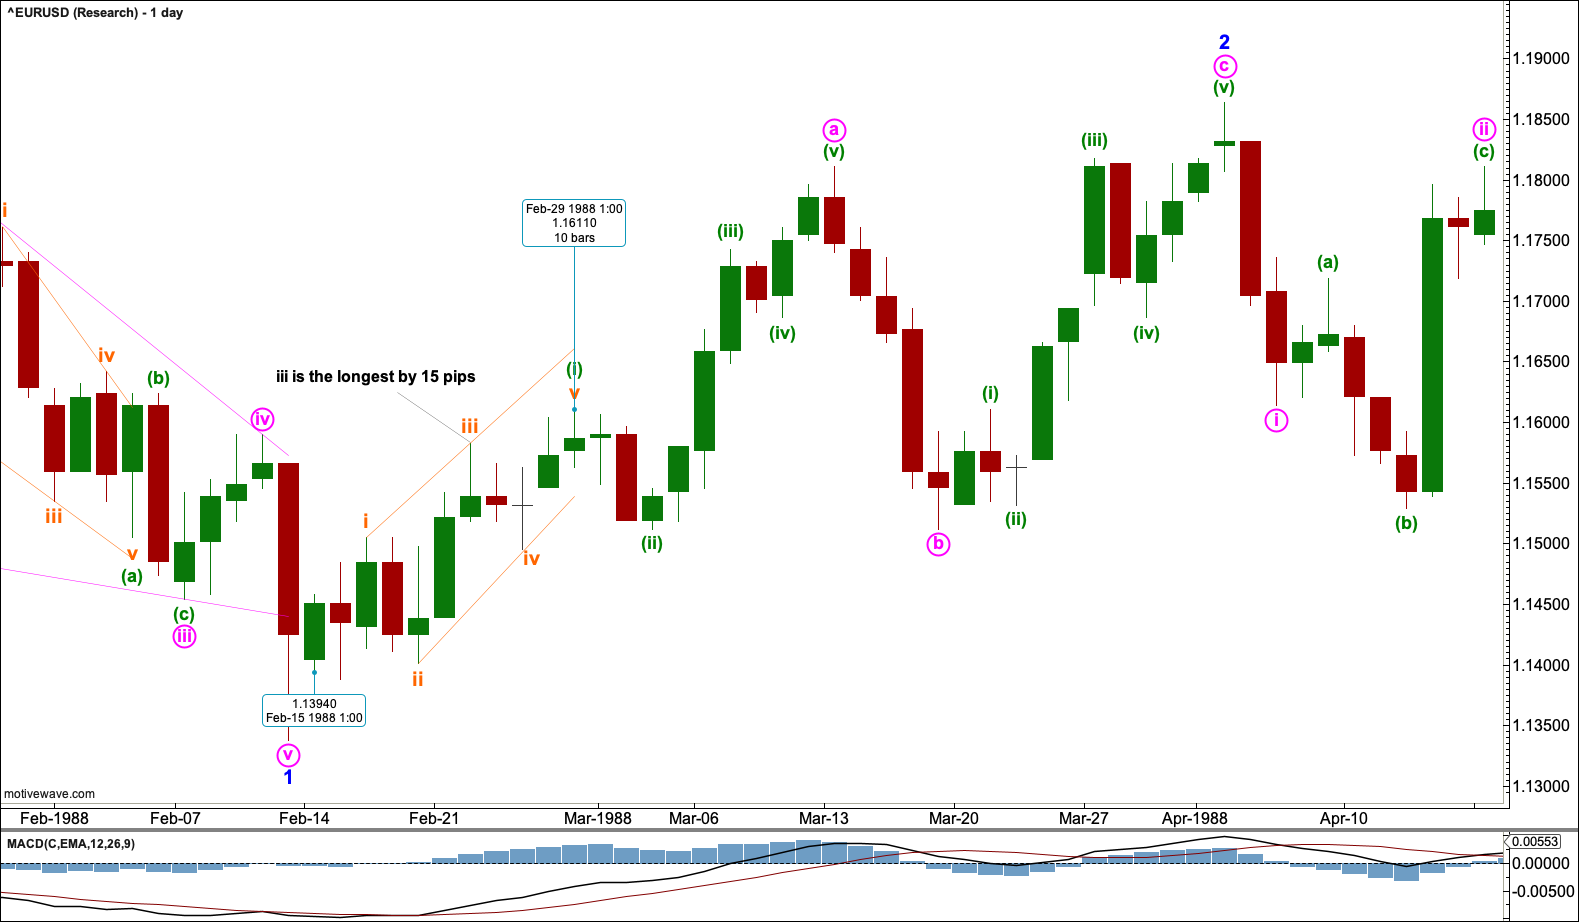
Click chart to enlarge.
This example is a leading contracting diagonal from EUR/USD from 1988.
Click chart to enlarge.
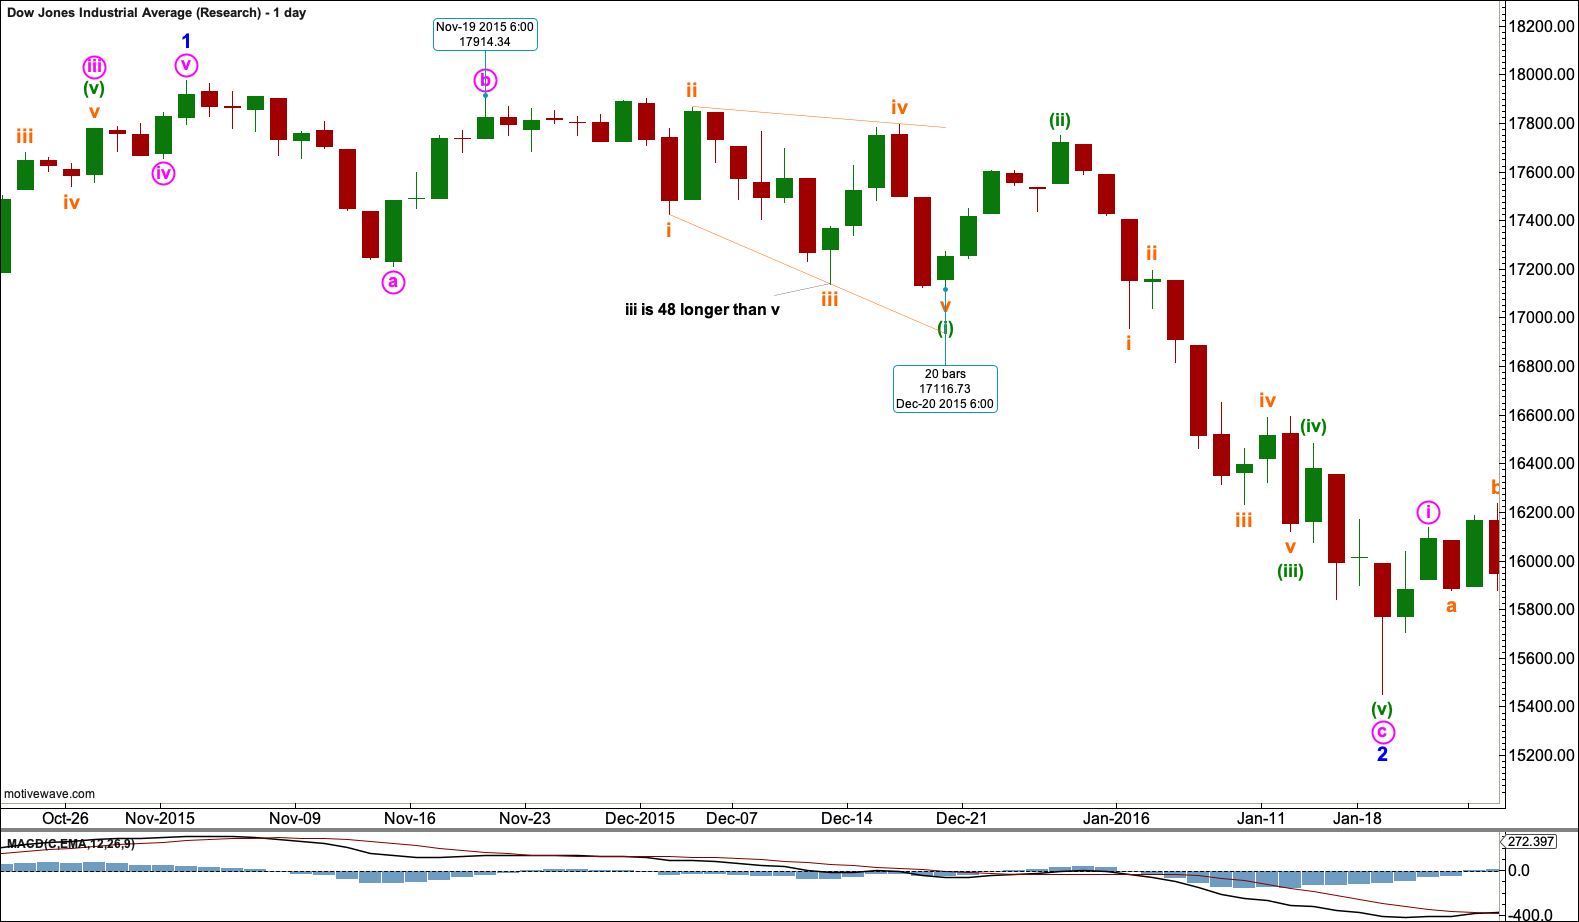
This example is a leading expanding diagonal from the DJIA from 2015 to 2016.
Click chart to enlarge.
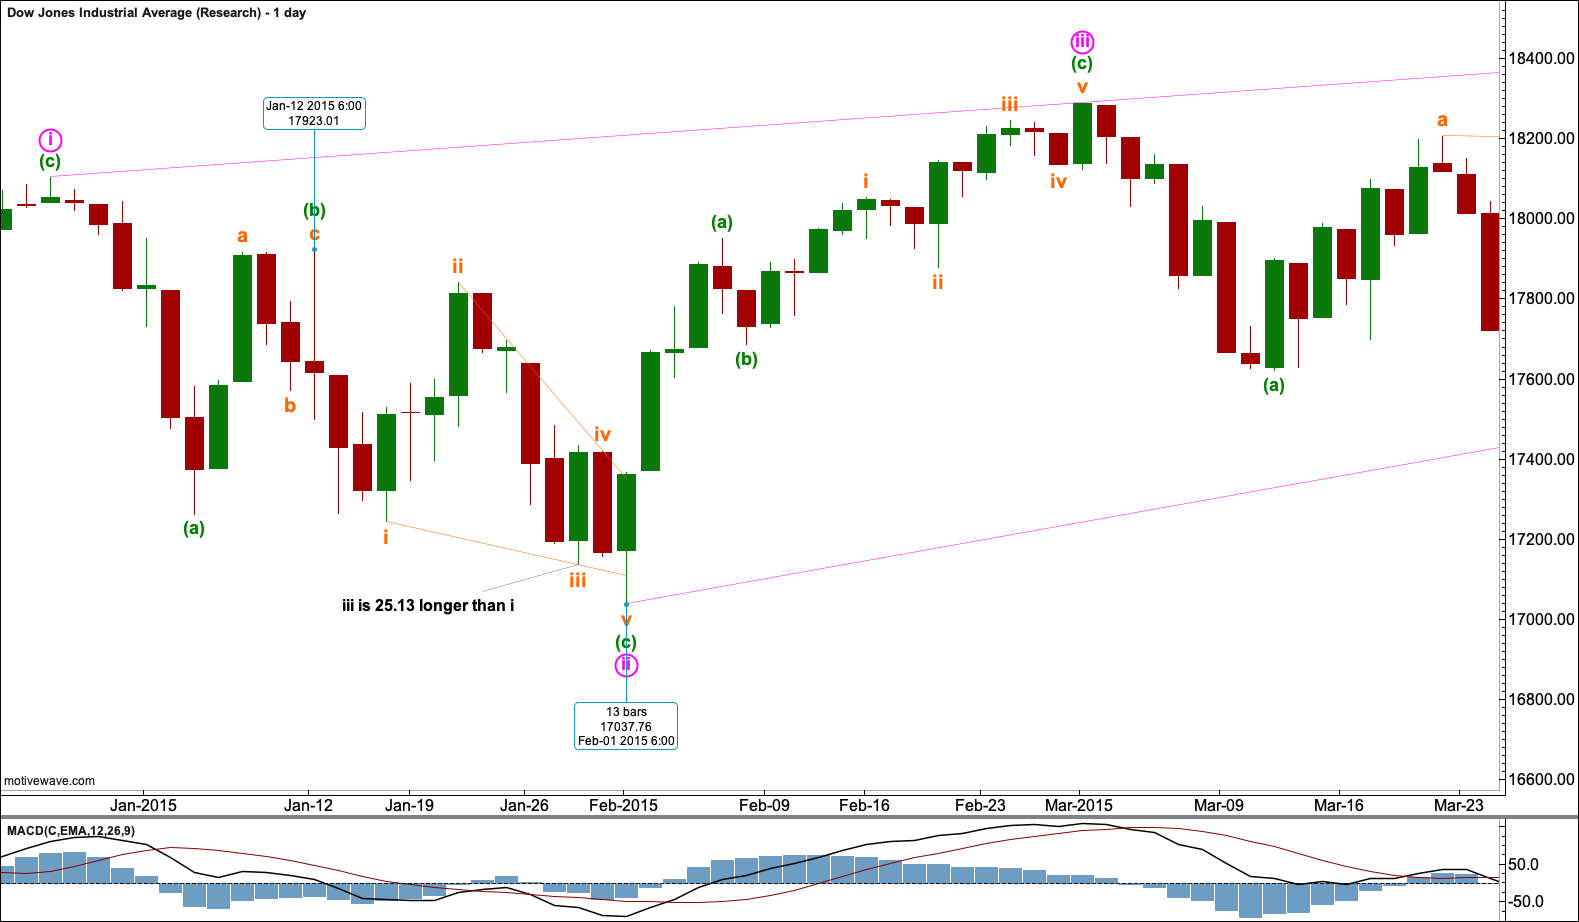
This example is an ending contracting diagonal from the DJIA from 2015.
Click chart to enlarge.
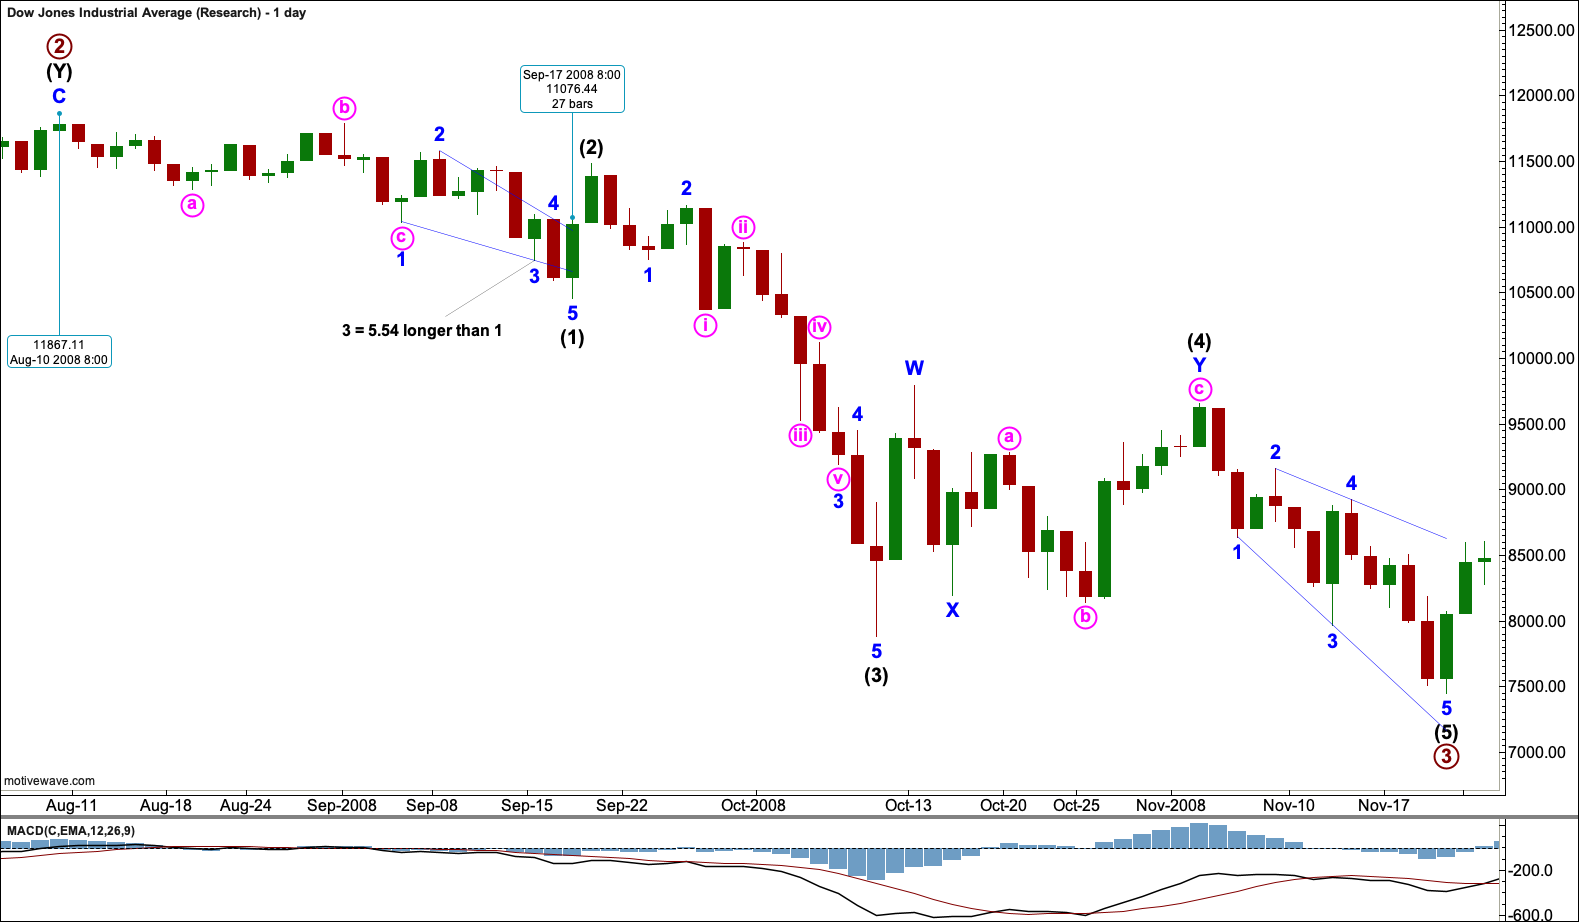
This example is a leading contracting diagonal from the DJIA from 2008.
Click chart to enlarge.
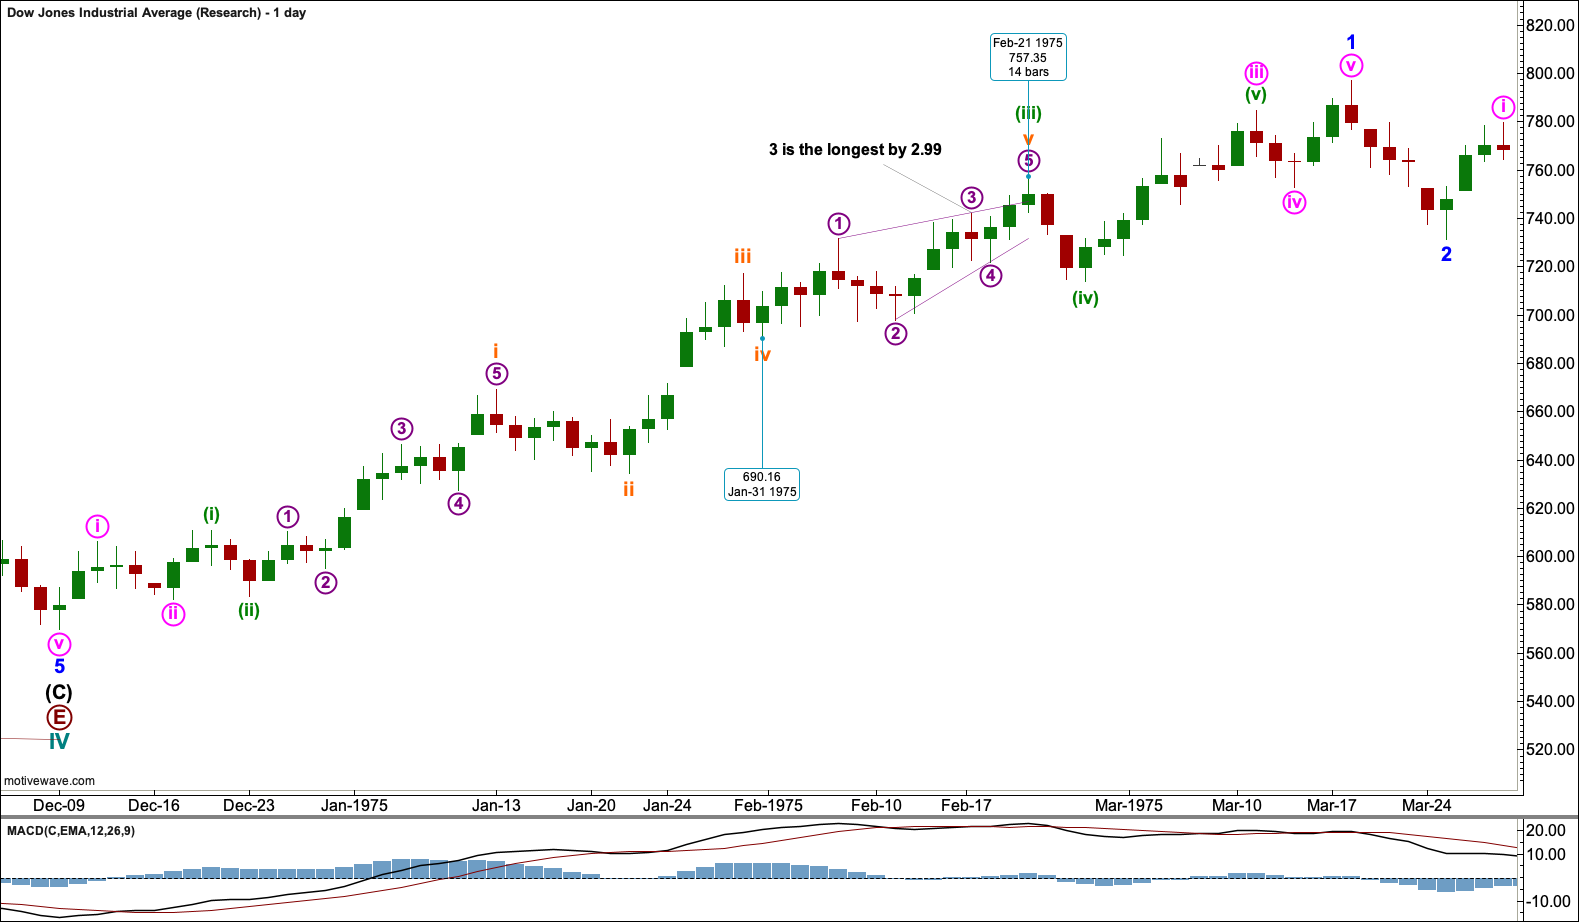
This example is an ending contracting diagonal from the DJIA from 1975.
Click chart to enlarge.
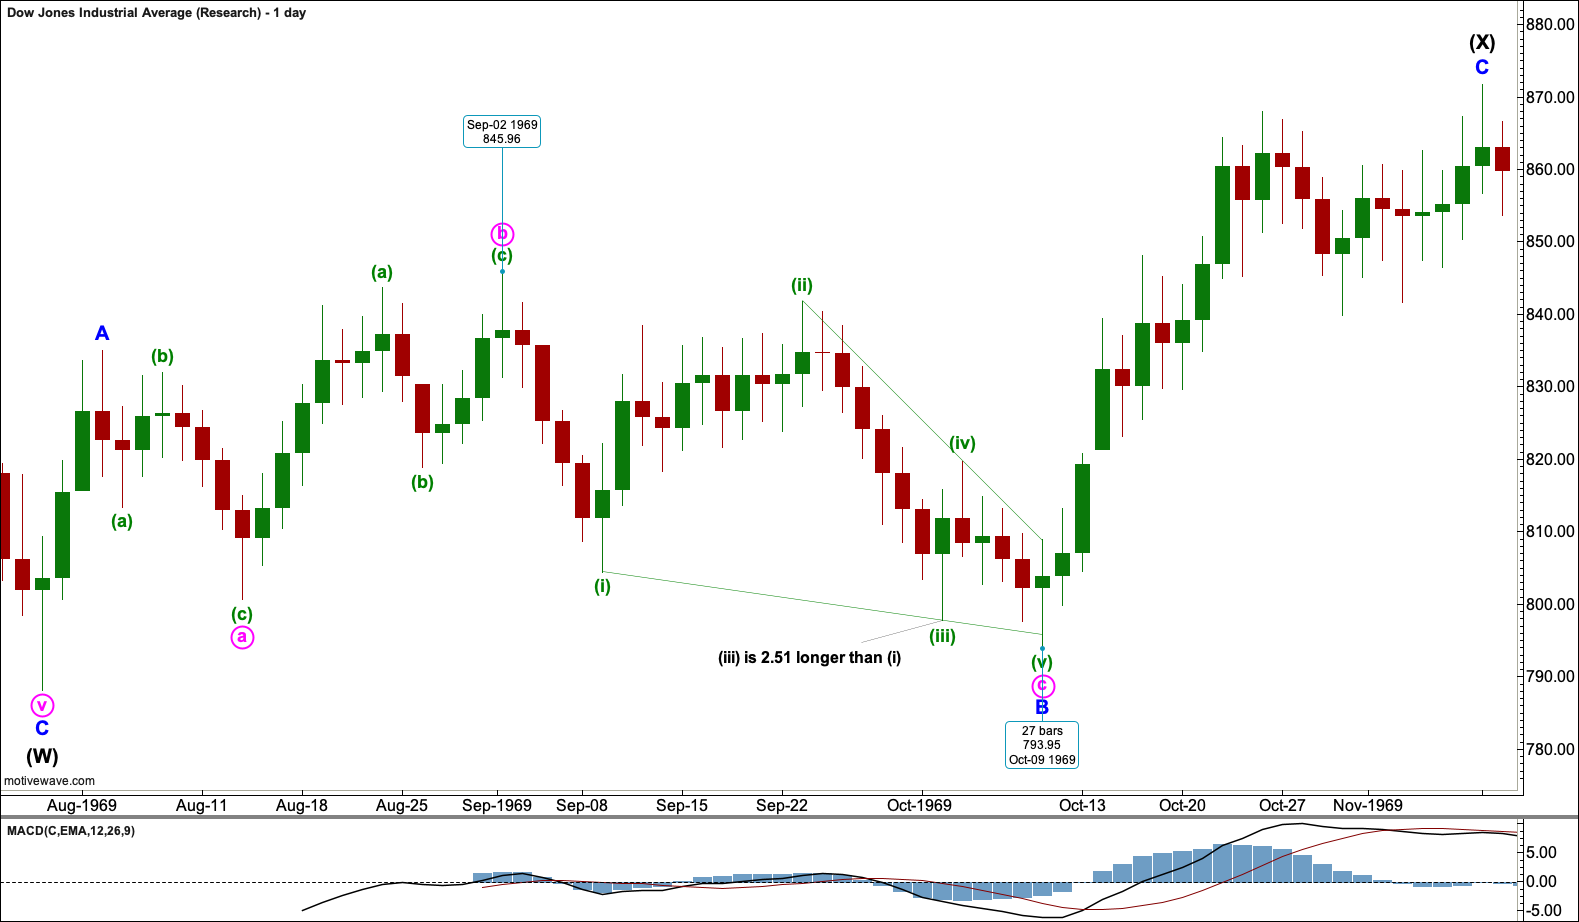
This example is an ending contracting diagonal from the DJIA from 1969.
Click chart to enlarge.
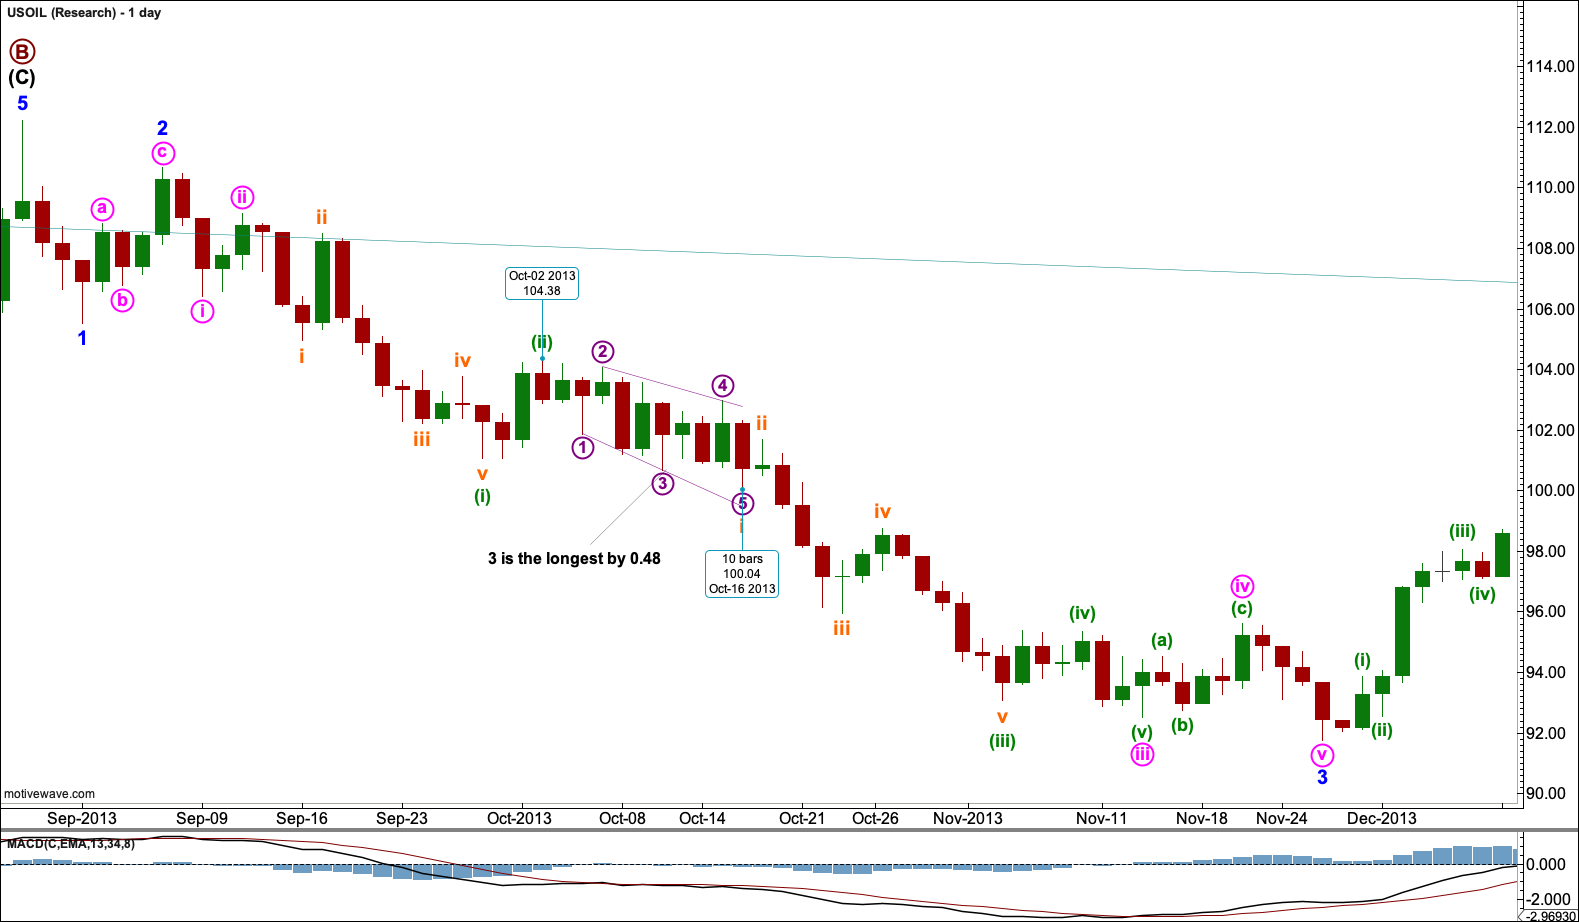
This example is a leading expanding diagonal from US Oil from 2013.
Click chart to enlarge.
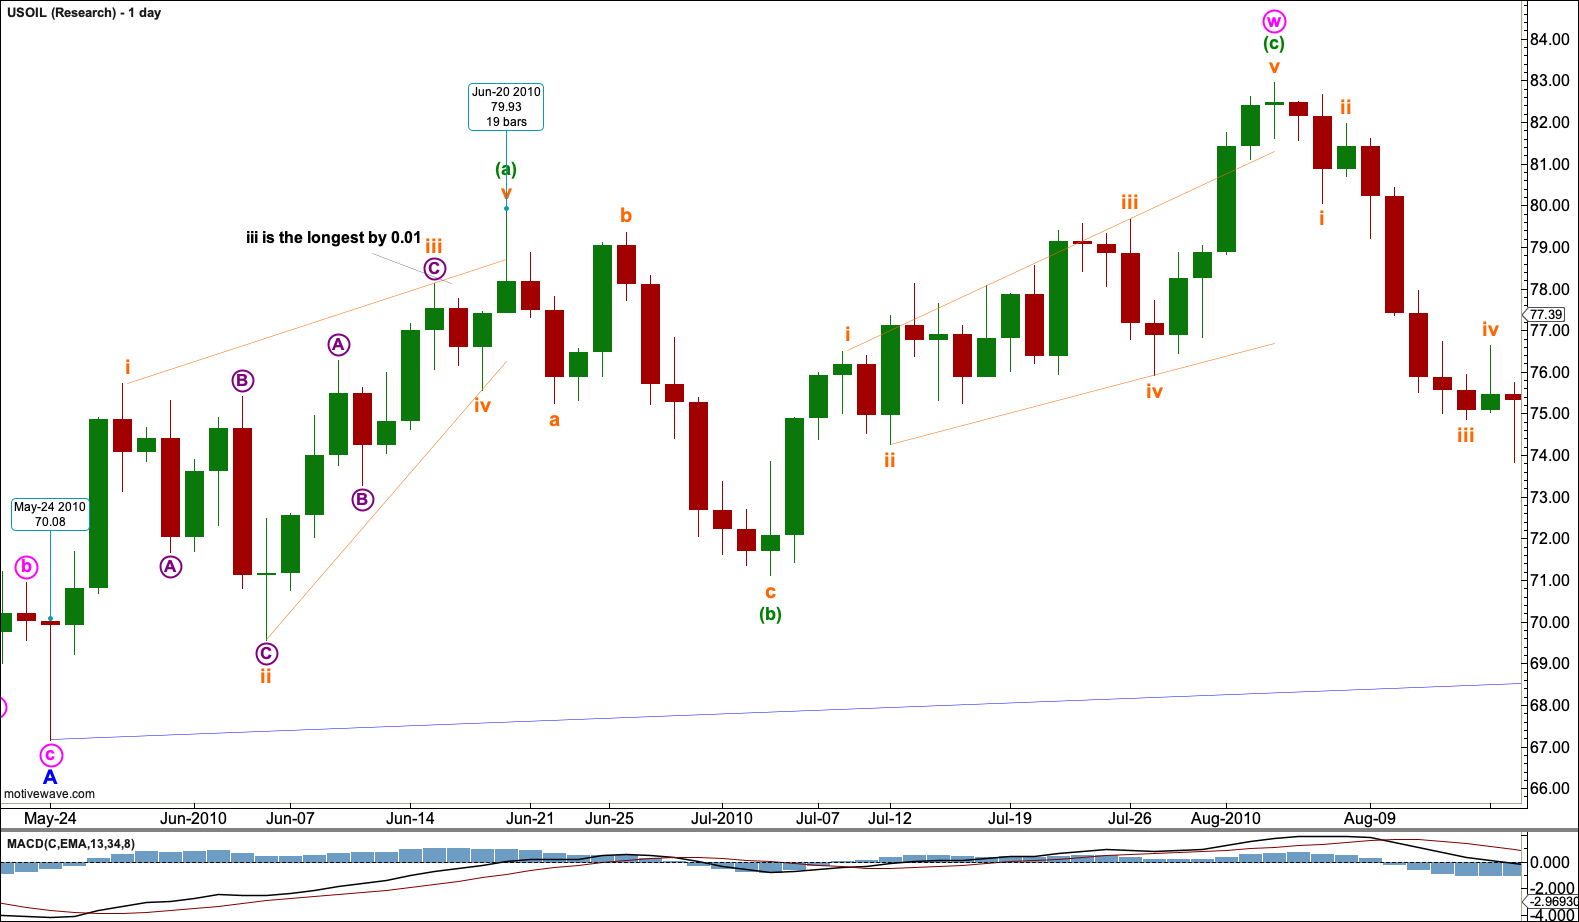
This example is a leading contracting diagonal from US Oil from 2010.
Click chart to enlarge.
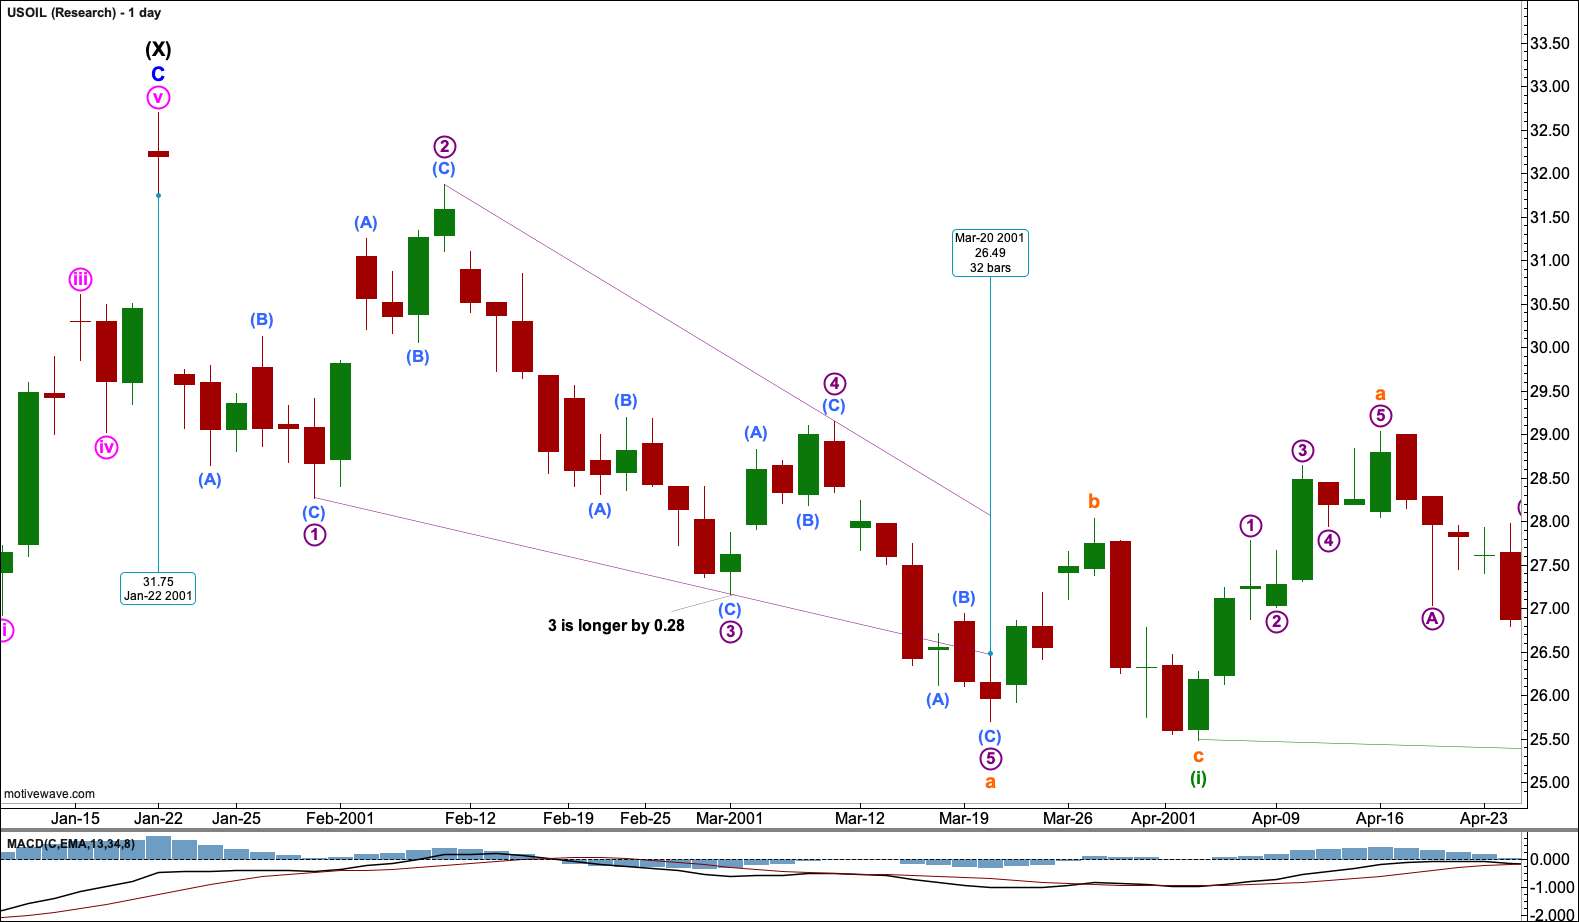
This example is a leading contracting diagonal from US Oil from 2001.