May 6, 2024: ETHUSD (Ethereum) Elliott Wave and Technical Analysis – Video and Charts
Summary: Upwards movement is expected to continue.
Long-term ballpark figures estimate ETHUSD’s price to increase towards levels around 15,972 or 27,941.
Mid-term ballpark figures estimate ETHUSD’s price to increase towards levels around 52,214 or 92,877.
For the short term, ETHUSD is expected to move higher towards 13,325.
The data used for this analysis comes from CryptoCompare.
All charts are on a semi-log scale.
ELLIOTT WAVE COUNT
MONTHLY
Click chart to enlarge.
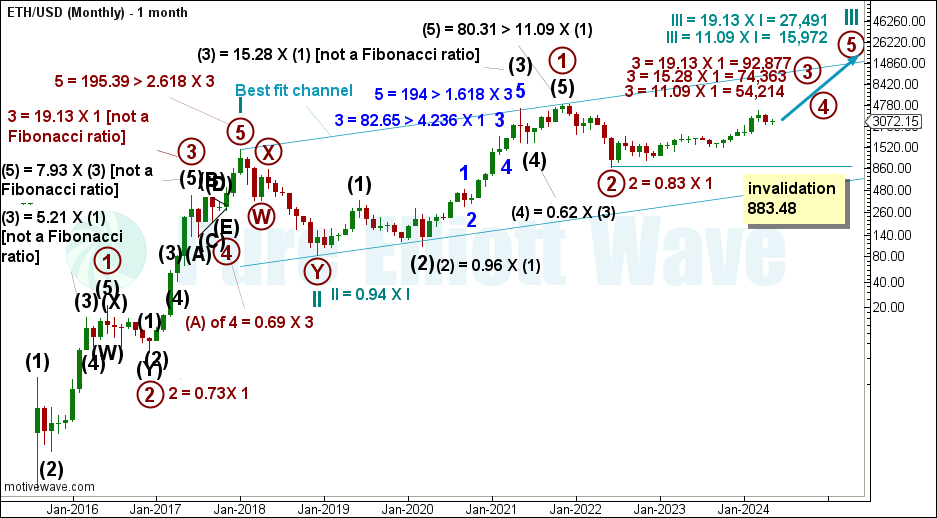
This monthly chart shows the complete price history of ETHUSD.
Currently, cycle wave III within Supercycle wave (I) is expected to move ETHUSD higher. Third waves may only subdivide as impulses.
Within cycle wave III, primary wave 3 moves price higher. Any second wave corrective movement within primary wave 3 cannot move below 883.48.
The long-term and mid-term figures shown on the chart are ballpark figures; they are not to be used as exact targets. This is due to the high volatility within crypto markets, making it difficult to calculate a specific range where price may move.
The ratio of 11.09 is an extreme Fibonacci ratio. This ratio sees primary wave 3 to increase ETHUSD’s price towards 54.214. Using the same ratio, cycle wave III would increase ETHUSD’s price to 15,972.
The ratio of 15.28 is not a Fibonacci ratio; it is derived from the ratio between intermediate waves (3) and (1) within primary wave 1 of cycle wave III.
The ratio of 19.13 is not a Fibonacci ratio; it is derived from the ratio between primary waves 3 and 1 within cycle wave I.
The best fit channel drawn around cycle wave III may be broken to the upside with increasing range and momentum from multiple third waves. If that does happen, then there will be increased confidence in this wave count.
WEEKLY
Click chart to enlarge.
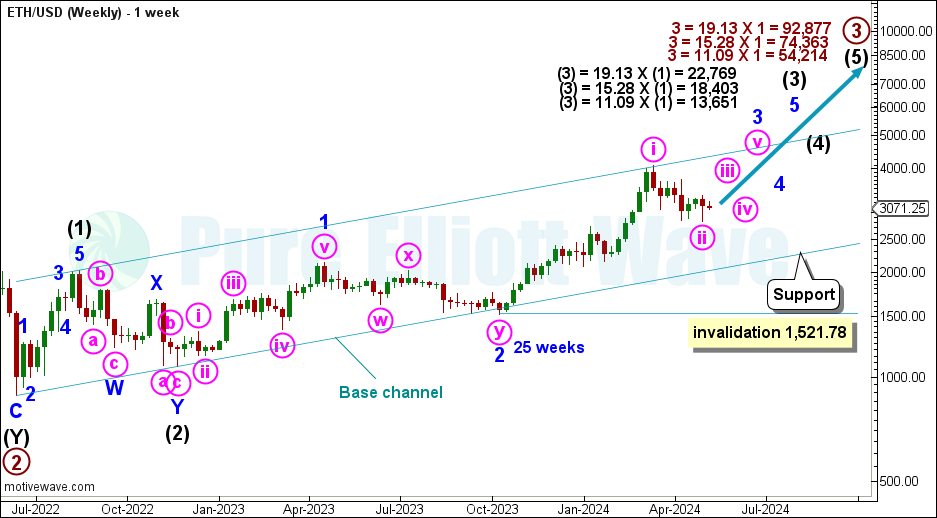
Primary wave 3 may only subdivide as an impulse. Within the impulse, intermediate wave (3) moves price higher.
A base channel is drawn around primary wave 3. Draw a line from the start of intermediate wave (1) to the end of intermediate wave (2) with a parallel copy placed at the end of intermediate wave (1). Intermediate wave (3) should break above this channel with increasing range and momentum.
Using the 11.09, 15.28, 19.13 ratios, ballpark figures estimate a range between 13,651 and 22,769 for intermediate wave (3). Note: These are not targets and only give a vague idea where intermediate wave (3) may end.
Within intermediate wave (3), minor and minute third waves continue to move price higher with increasing range and momentum.
If minute wave ii continues lower, then it may find support at the lower edge of the base channel. Minute wave ii cannot move below the start of minute wave i at 1,521.78.
Minute wave i found resistance at the upper edge of the base channel. Minute wave iii should have the power to break above the channel. If this happens, then there will be additional confidence in this wave count.
DAILY
Click chart to enlarge.
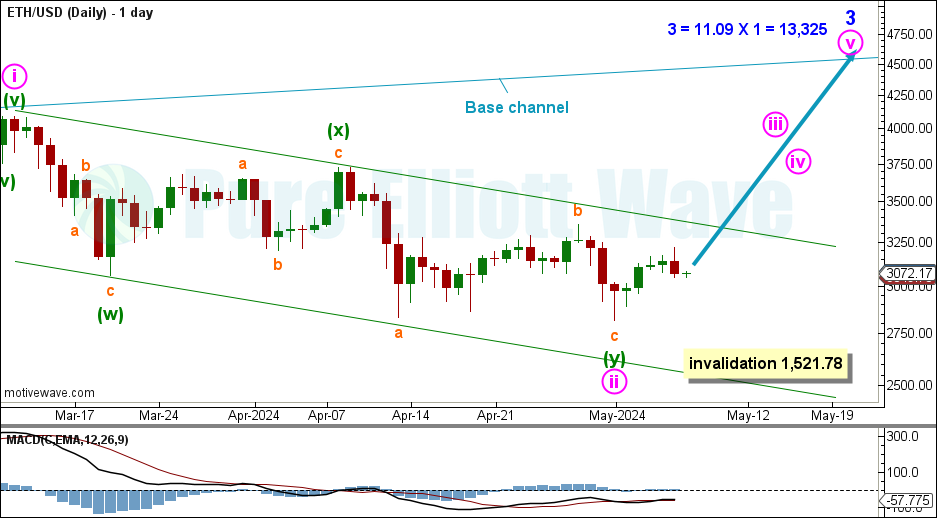
Within minor wave 3, minute wave ii is labelled complete at the May 1st low, subdividing as a double zigzag. Minute wave iii is now expected to move price higher.
An Elliott channel (green) is drawn around minute wave ii using Elliott’s technique for a correction. Draw a line from the start of minuette wave (w) to the end of minuette wave (x) with a parallel copy placed at the end of minuette wave (w). The end of minuette wave (y) and minute wave ii has fallen short of support at the lower edge of the channel. A break above the upper edge of the channel would support this wave count, seeing minute wave iii moving price higher.
DAILY ALTERNATE
Click chart to enlarge.
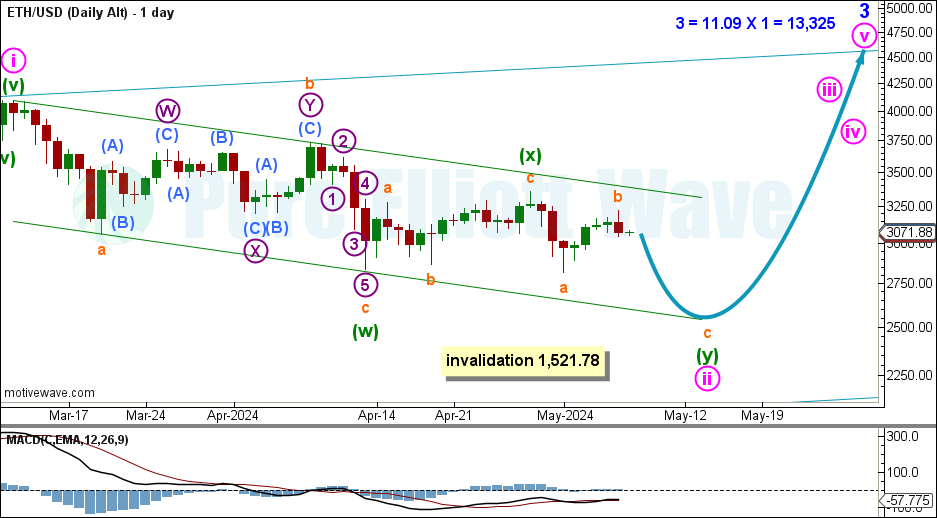
This alternate Elliott Wave count sees minute wave ii incomplete. Price is expected to move lower for minuette wave (y) within a double zigzag.
As minute wave ii moves price lower, it may break below the Elliott channel (copied over from the main daily chart).
At this point, we wait for a bullish or bearish signal from the Elliott channel.
TECHNICAL ANALYSIS
MONTHLY
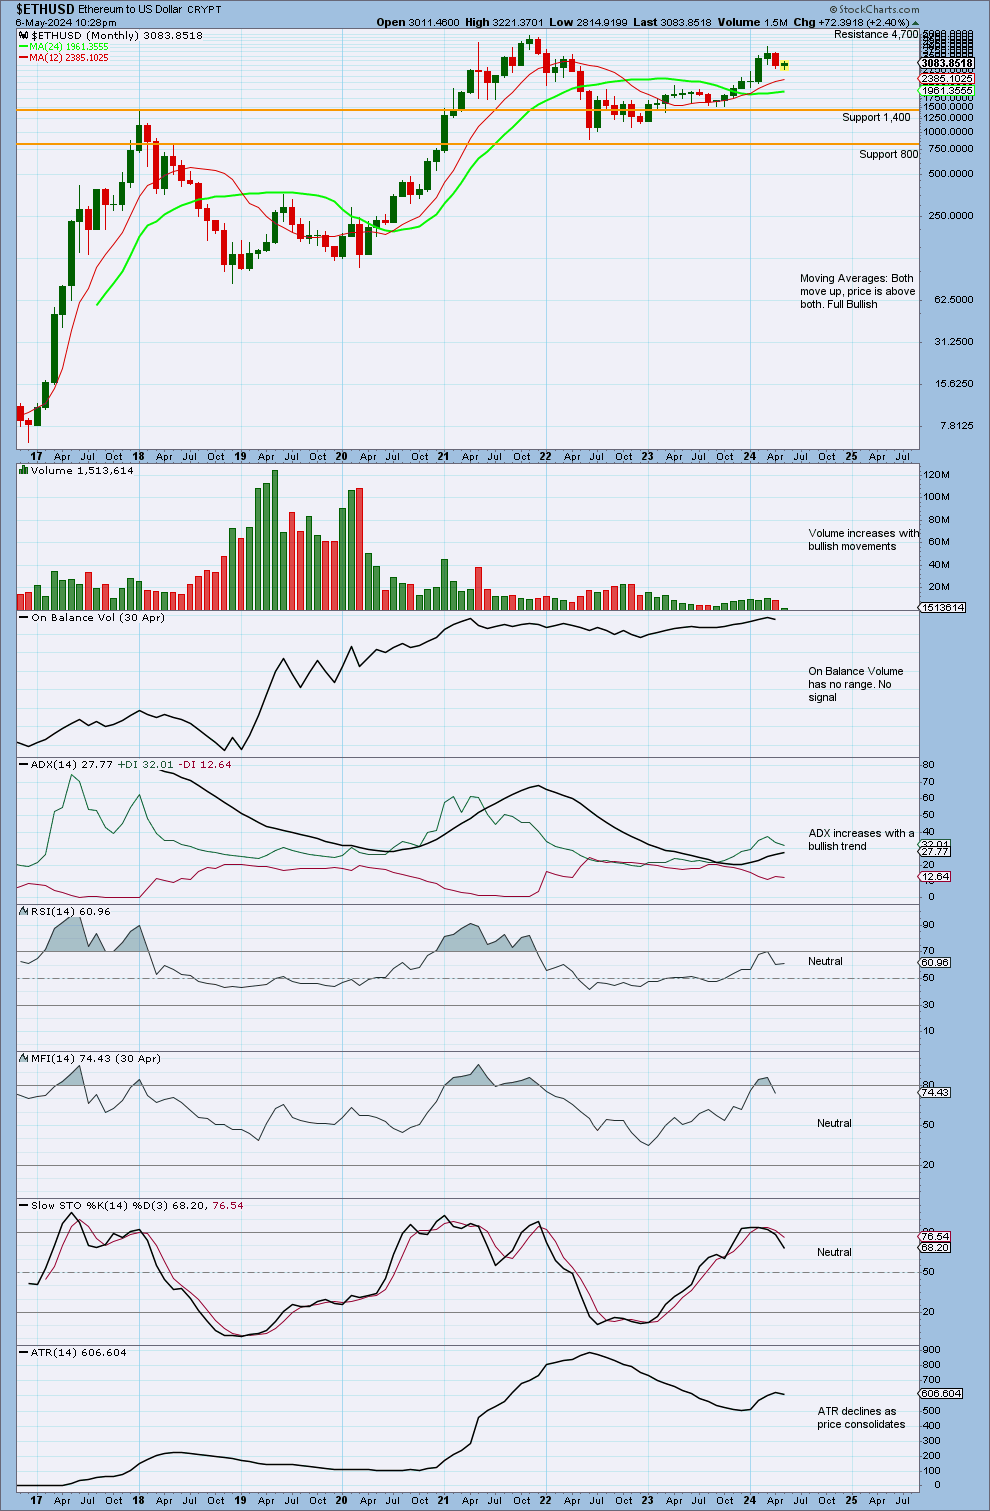
Click chart to enlarge.
Price currently consolidates within support at 1,400 and resistance at 4,700.
Recent increases in volume for green candlesticks gives support to upwards movements for the short term.
ADX increases with a bullish trend that is not extreme and not in danger of ending. RSI is neutral and nearing overbought, while Money Flow Index has just returned from overbought. This trend may continue to where ADX reaches extreme conditions, and RSI & Money Flow Index reach more deeply overbought and/or exhibit divergence.
WEEKLY
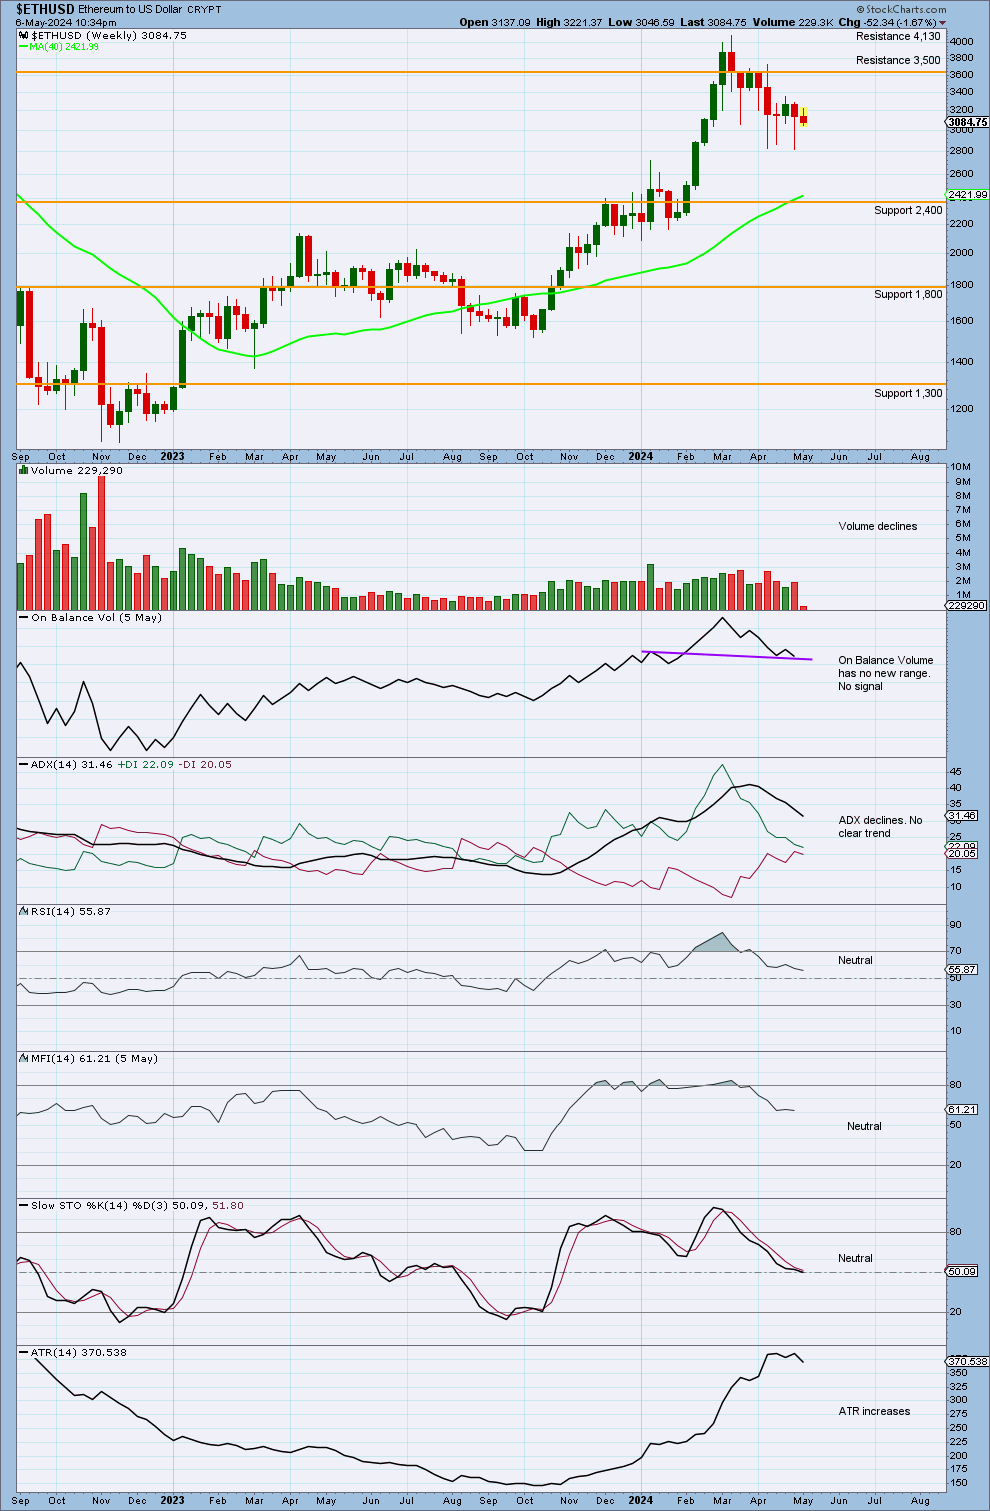
Click chart to enlarge.
Price declines after finding resistance at 3,500.
Some strength on red candlesticks leaves the volume profile bearish for the short term, though volume overall declines from the last high in March 2024.
ADX declines, showing no clear trend. The model of Stochastics and support and resistance suggests a downwards swing may continue towards support at 2,400. This supports the alternate Elliott Wave count for the short term.
DAILY
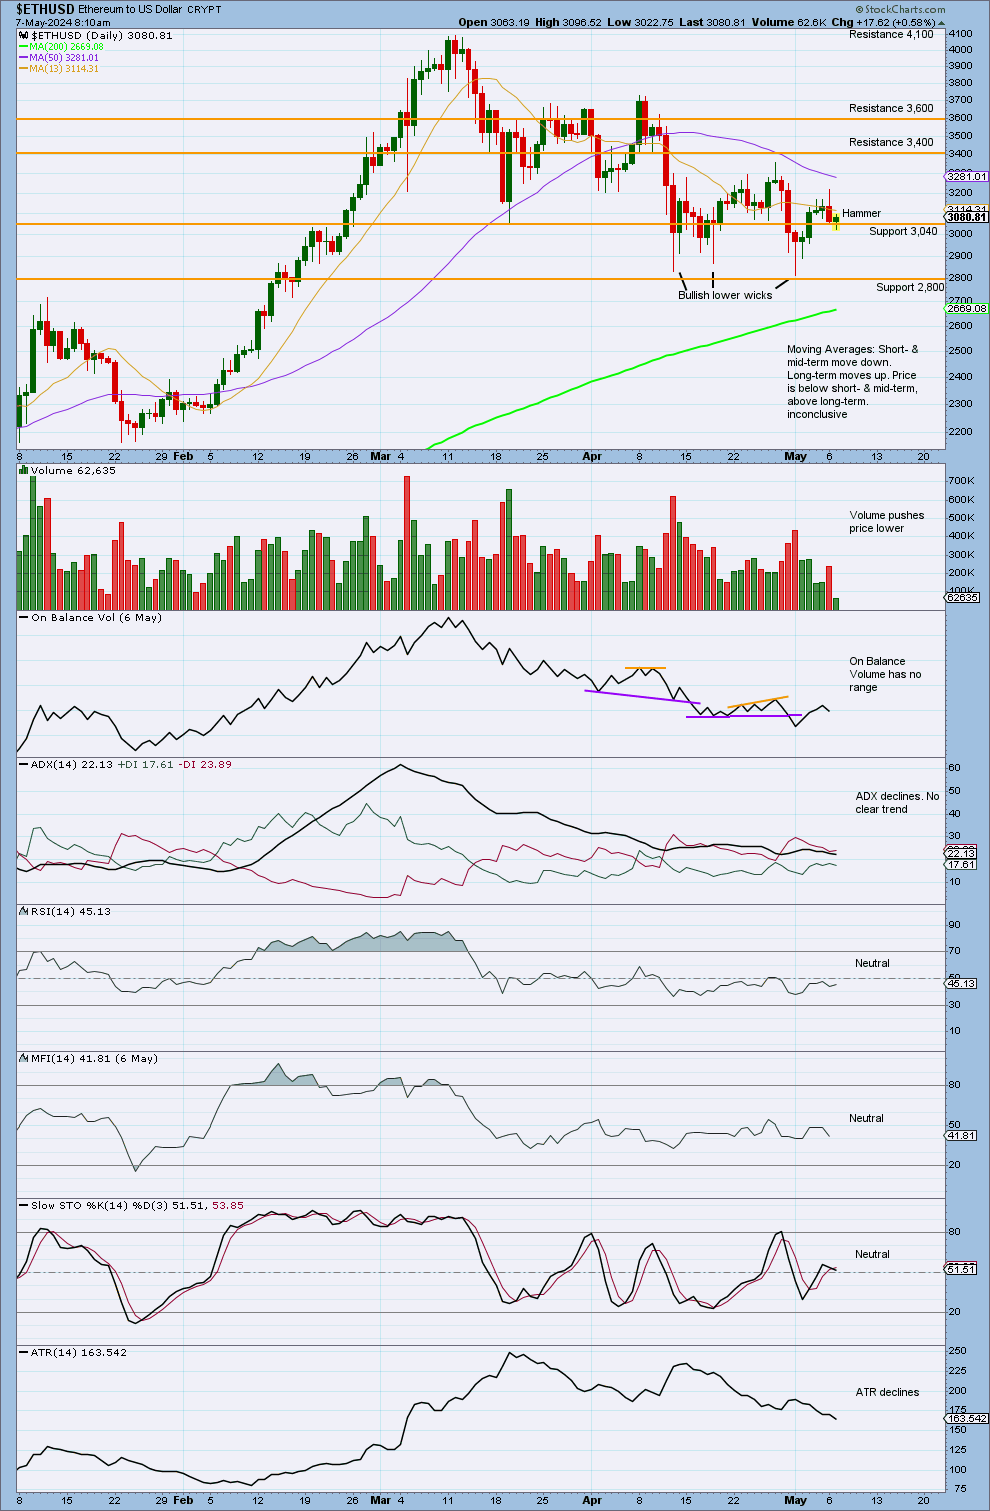
Click chart to enlarge.
At this time frame, ETHUSD’s price consolidates within resistance at 3,600 and support at 3,040.
ADX declines, showing no clear trend. The model of Stochastics and support and resistance suggests an upwards swing may occur at this point, towards resistance at 3,400 or 3,600.
Published @ 05:45 a.m. ET on May 7, 2024.
—
Careful risk management protects your investment account(s).
Follow Lara’s two Golden Rules:
1. Invest only funds you are prepared to lose entirely.
2. Always have an exit strategy for both directions: when or where to take profit on a winning investment, and when or where to close a losing investment.
—
New updates to this analysis are in bold.
—