S&P 500: Elliott Wave Analysis – January 18, 2022 – Charts – Grand Super Cycle
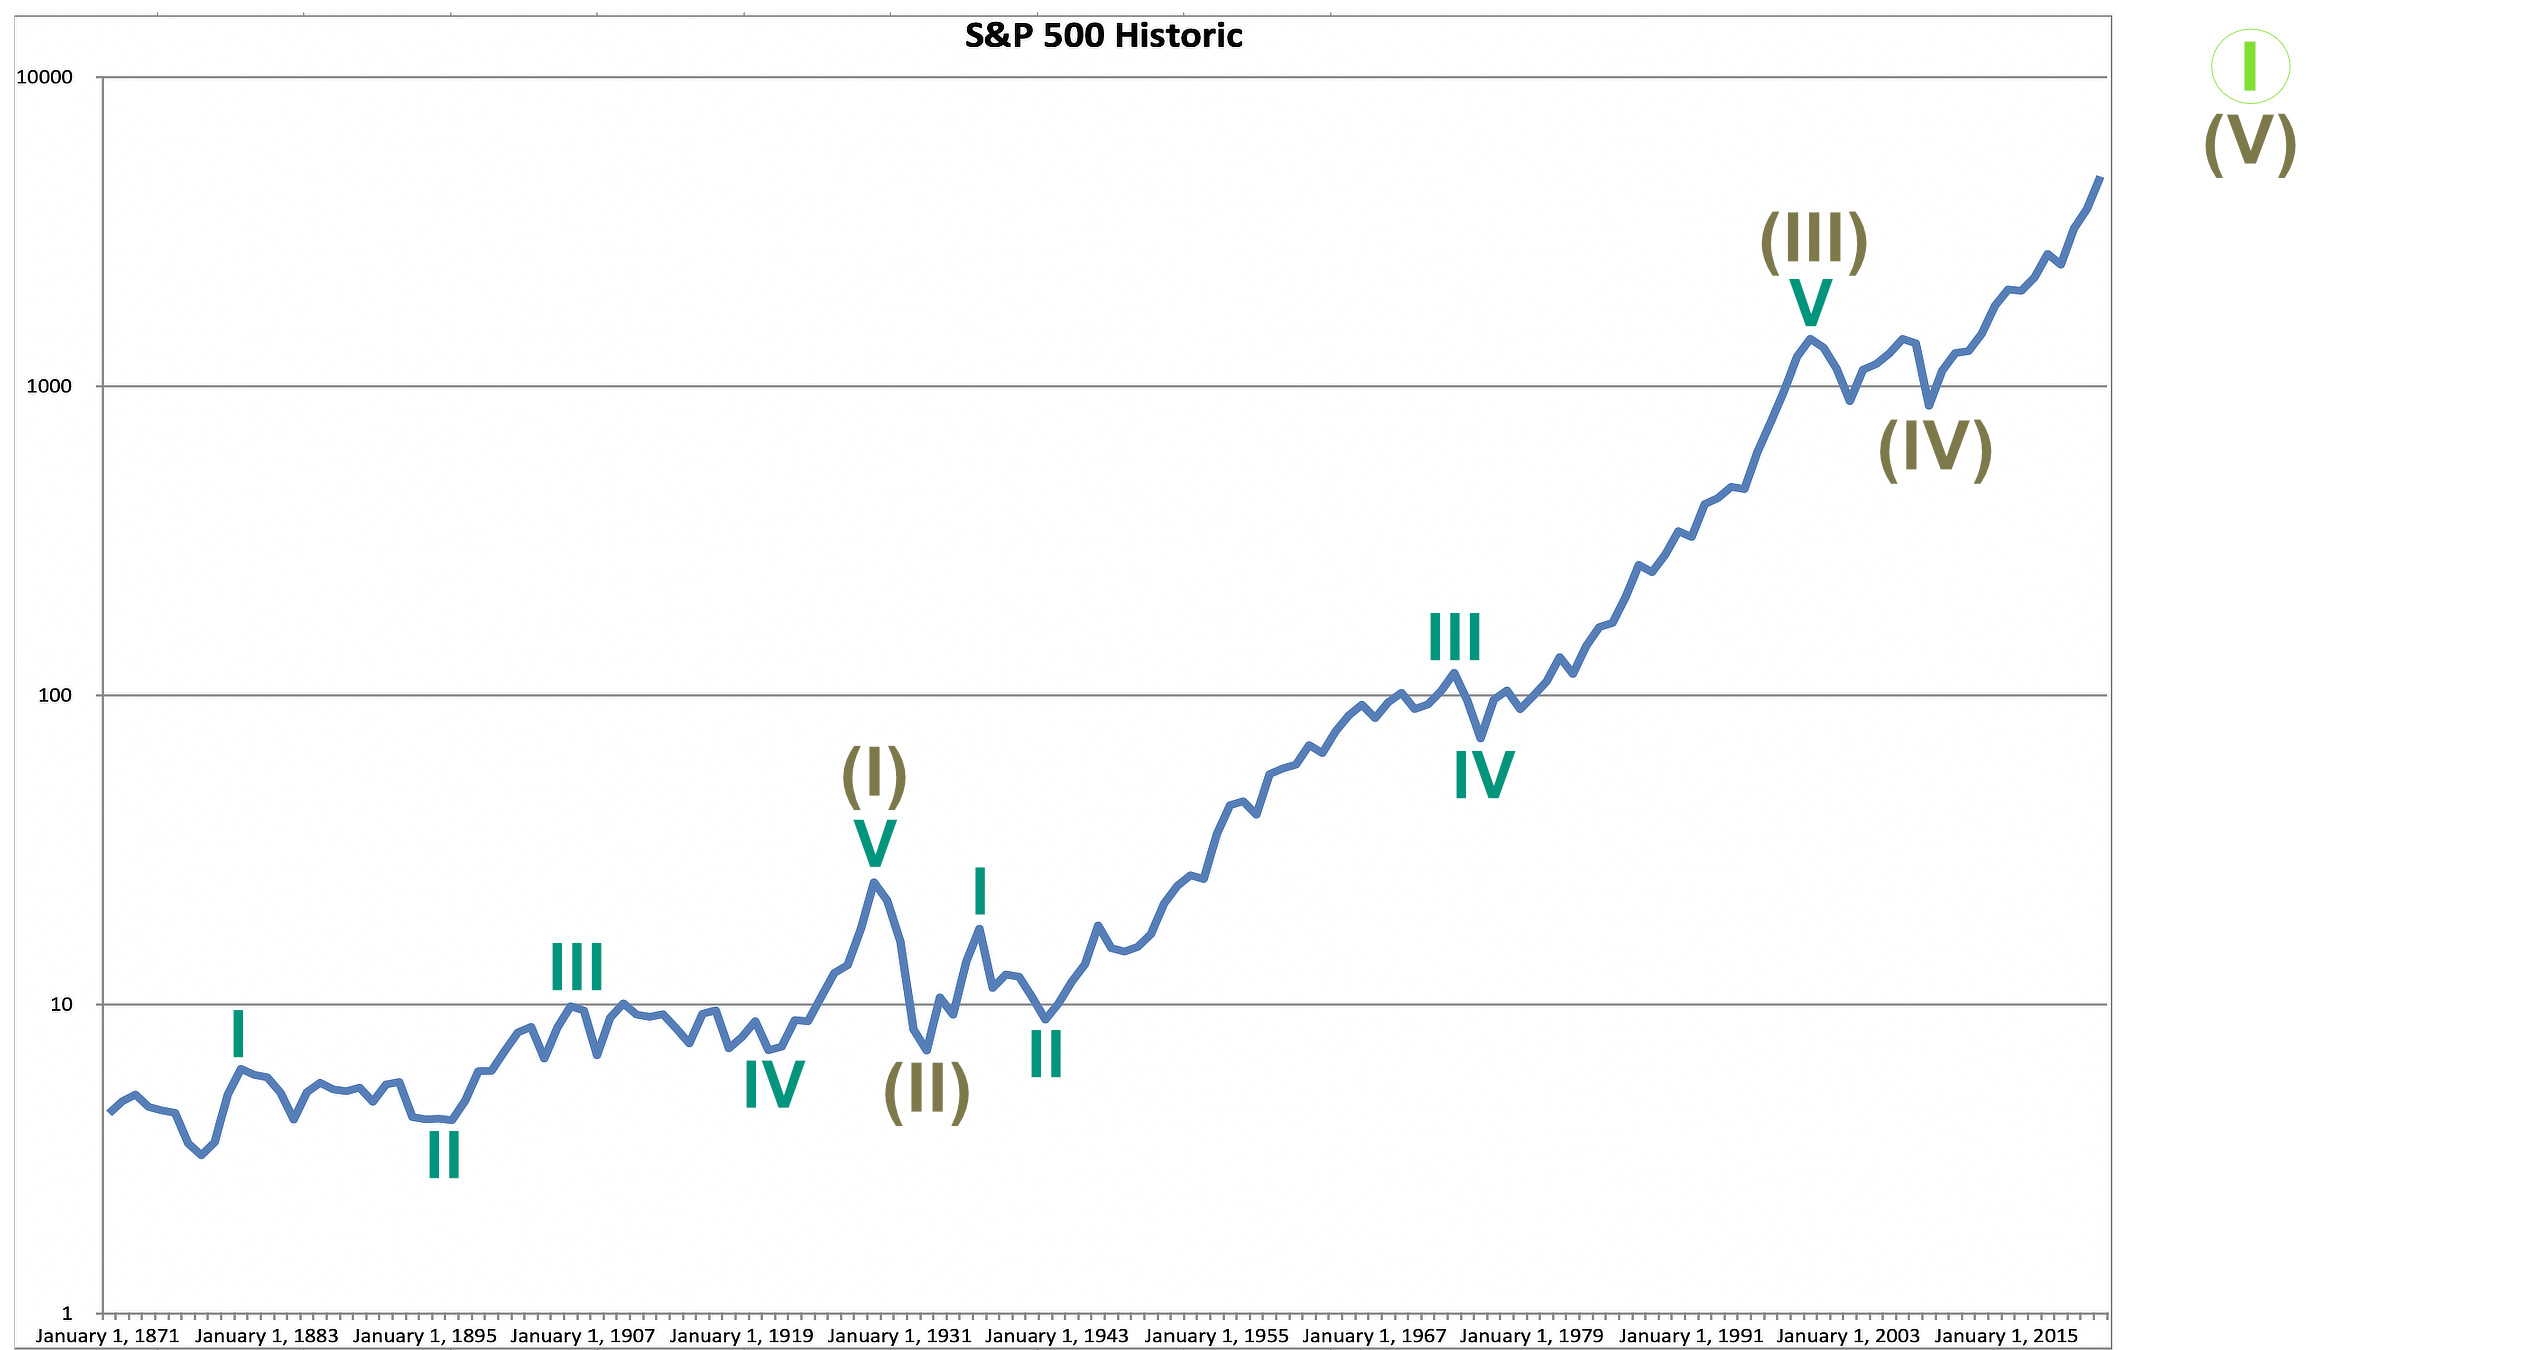
Grand Super Cycle wave I may be nearing an end in a few years; Super Cycle wave (V) may continue higher. When Grand Super Cycle wave I is complete, then a once in a multi-generations trend change may occur, and a once in a multi-generations bear market may unfold.
MAIN WAVE COUNT – BULLISH
YEARLY CHART
The data prior to the inception of the S&P500 index is an amalgamation of the US stock market back to that date.
There are two approaches to the S&P500 long term analysis: either look only at data since the inception of the S&P500 in 1957, or to include an amalgamation of the entire US stock market before that date as part of the analysis. I have chosen to look at the entire market.
The data I have only goes back to 1871. This bull wave count assumes up to the market peak of 1929 a five wave impulse can be counted. This may have been a Super Cycle wave (I), and the Great Depression a Super Cycle wave (II) correction. If this assumption is wrong, then the bull wave count would not work.
If Super Cycle wave (III) began at the end of the Great Depression in 1933, then it may have ended in 2000. Super Cycle wave (III) would have lasted 67 years and moved price 1,523 points.
Within Super Cycle wave (III), there are no adequate Fibonacci ratios between cycle waves I, III and V. Cycle wave II is a deep 0.82 zigzag lasting 5 years, and cycle wave IV is a shallow 0.42 zigzag lasting 2 years. There is alternation in depth cycle waves II and IV.
Super Cycle wave (II) lasted only four years (a relatively deep quick zigzag). Super Cycle wave (IV) may be over as a more shallow flat correction, lasting 8.5 years. There is perfect alternation between Super Cycle waves (II) and (IV).
This wave count expects that Super Cycle wave (V) is underway to finally end Grand Super Cycle wave I.
Both Super Cycle waves (I) and (III) look to be extended in this analysis. If this is correct, then Super Cycle wave (V) may not extend.
ALTERNATE WAVE COUNT – BEARISH – last published here.
This wave count is now discarded. It considered the possibility that the current upwards movement was wave B within a larger expanded flat. Wave B would now be over 3.5 times the length of wave A, so the idea should be discarded based upon a very low probability.
Published @ 07:30 p.m. ET.
—
Careful risk management protects your trading account(s).
Follow my two Golden Rules:
1. Always trade with stops.
2. Risk only 1-5% of equity on any one trade.
—
New updates to this analysis are in bold.
—

