April 23, 2022: RIOT Elliott Wave and Technical Analysis – Video and Charts
Summary: Downwards movement is expected to overall continue towards a target zone from 9.59 to 11.03. If this target zone is wrong, then it may be a little too low. A new low below 0.511 is not expected.
ELLIOTT WAVE COUNT
MONTHLY CHART
Click chart to enlarge.
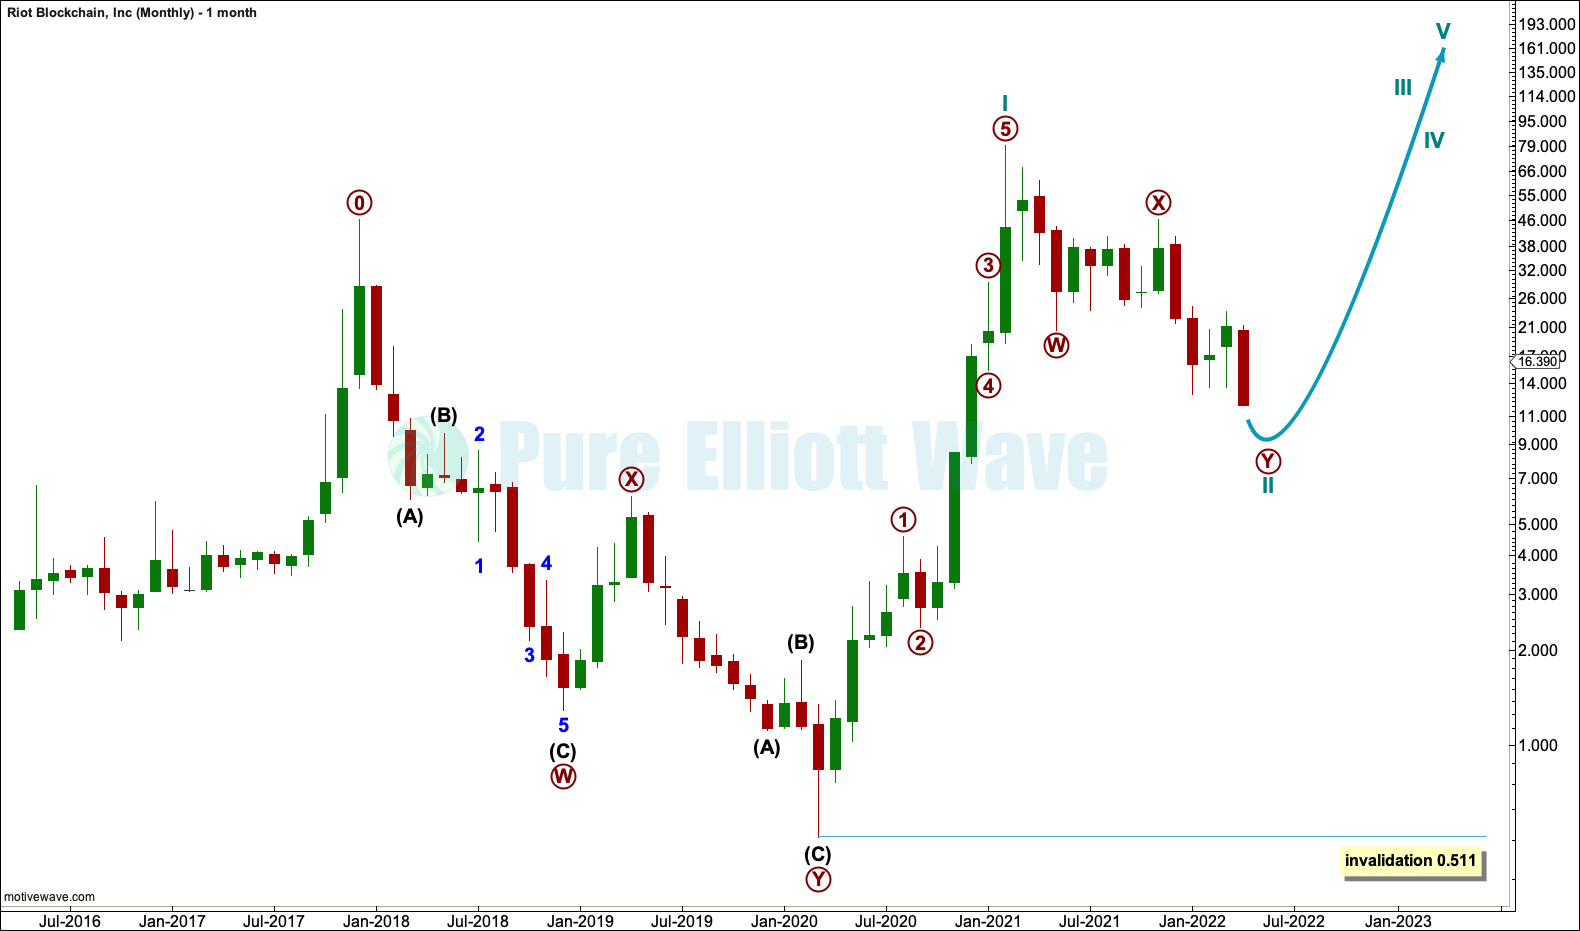
It is difficult to see where to begin the Elliott wave count for RIOT. I have analysed the structure of the bear market from December 2017 to March 2020 as a double zigzag, which is a counter trend structure, and I will see a first wave beginning at the end of it.
It is possible to see from the March 2020 low a completed five wave impulse up to the high in February 2021. This is labelled cycle wave I.
Cycle wave II may be continuing lower as a double zigzag. Cycle wave II may not move beyond the start of cycle wave I below 0.511.
WEEKLY CHART
Click chart to enlarge.
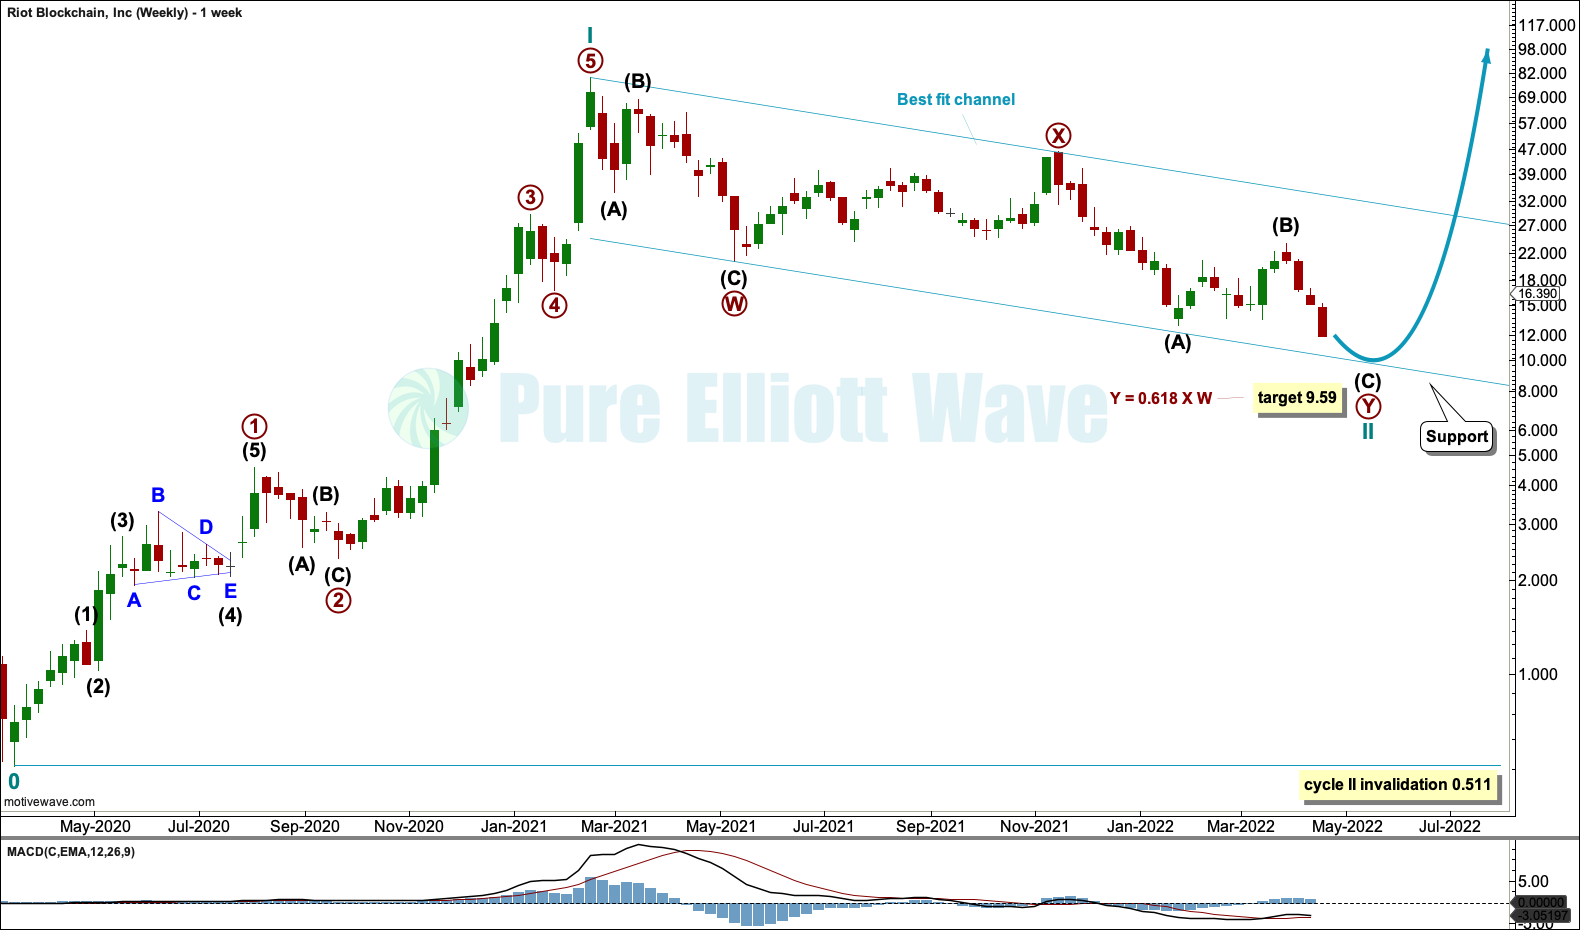
The weekly chart focuses on cycle waves I and II. Where I have found Fibonacci ratios between actionary waves within cycle wave I, these are noted on the chart. It is my judgement that a variation of less than 10% from a perfect ratio is sufficient to say the two waves exhibit a Fibonacci ratio to each other.
Where no Fibonacci ratios have been found then no notation has been made.
RIOT appears to exhibit Fibonacci ratios occasionally, but not regularly. These ratios are extreme compared to most equities but less extreme compared to most cryptocurrencies in my experience with these markets.
This may be useful in target calculation.
Cycle wave II may be very close to complete as a double zigzag. The channel about cycle wave II shows where intermediate wave (A) found support. The channel may be useful in coming weeks to show where cycle wave II may end as intermediate wave (C) may find support about the lower edge. The channel may be slightly overshot; this sometimes occurs at the end of C waves.
So far cycle wave II has lasted one year, 52 weeks. It may end now sooner rather than later; cycle degree waves normally last from one to several years, with bear markets normally more brief than bull markets.
DAILY CHART
Click chart to enlarge.
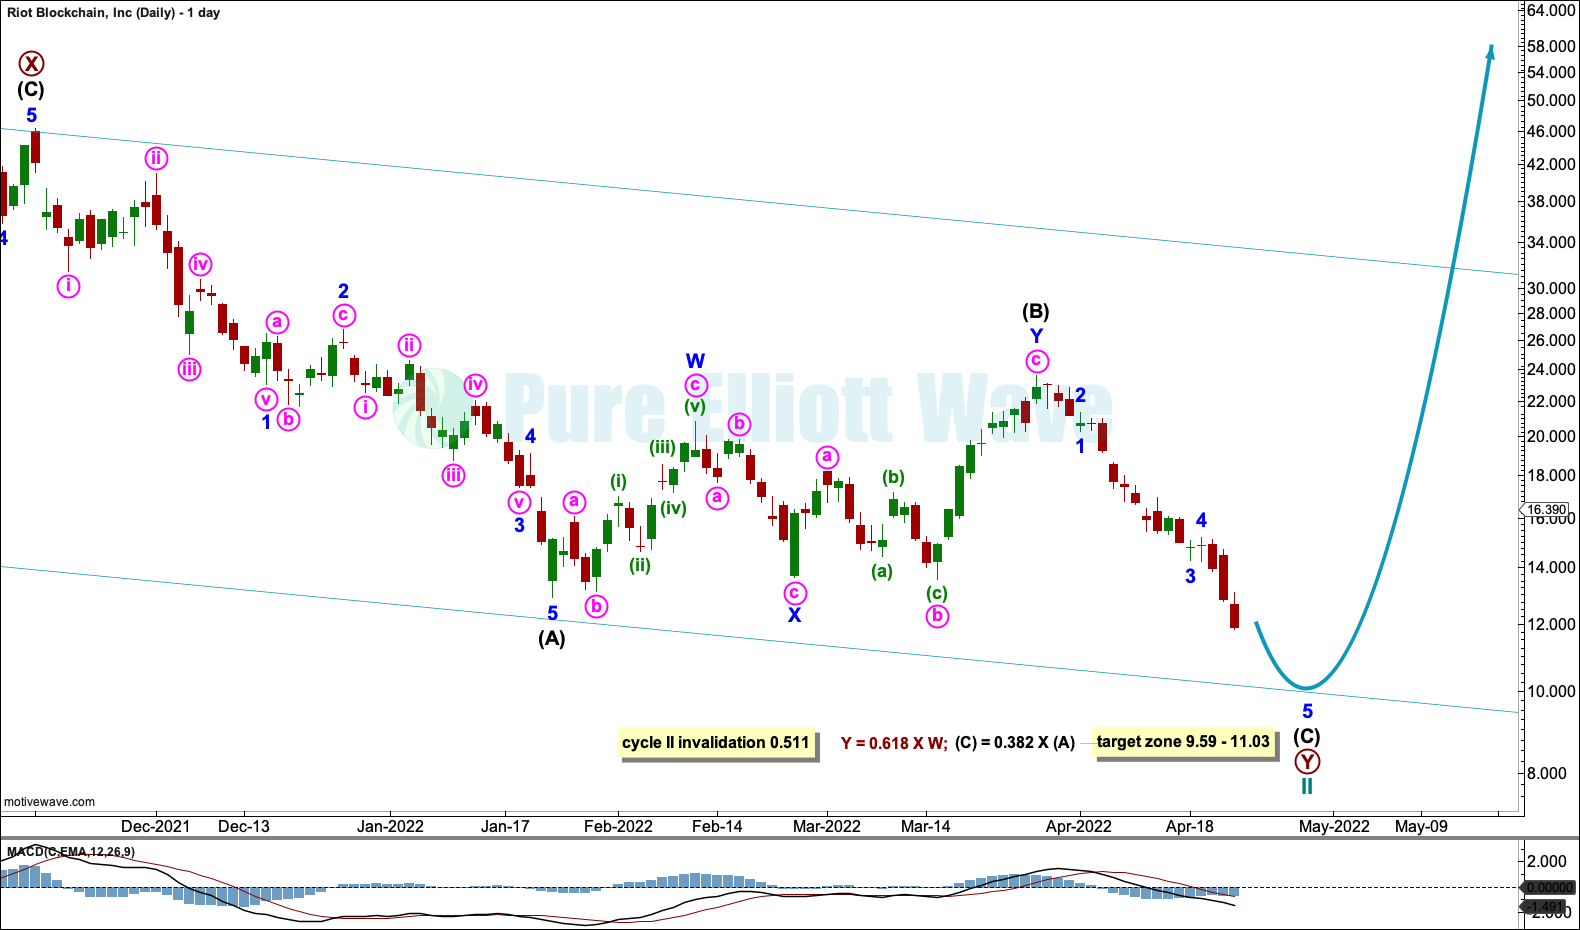
Primary wave Y may be a nearly complete zigzag. Within primary wave Y: Intermediate wave (B) continued higher as a double zigzag and now intermediate wave (C) is unfolding lower. Intermediate wave (C) may end either at support at the lower edge of the channel, or it may overshoot the channel if the target zone is met.
TECHNICAL ANALYSIS
WEEKLY CHART
Click chart to enlarge. Chart courtesy of StockCharts.com.
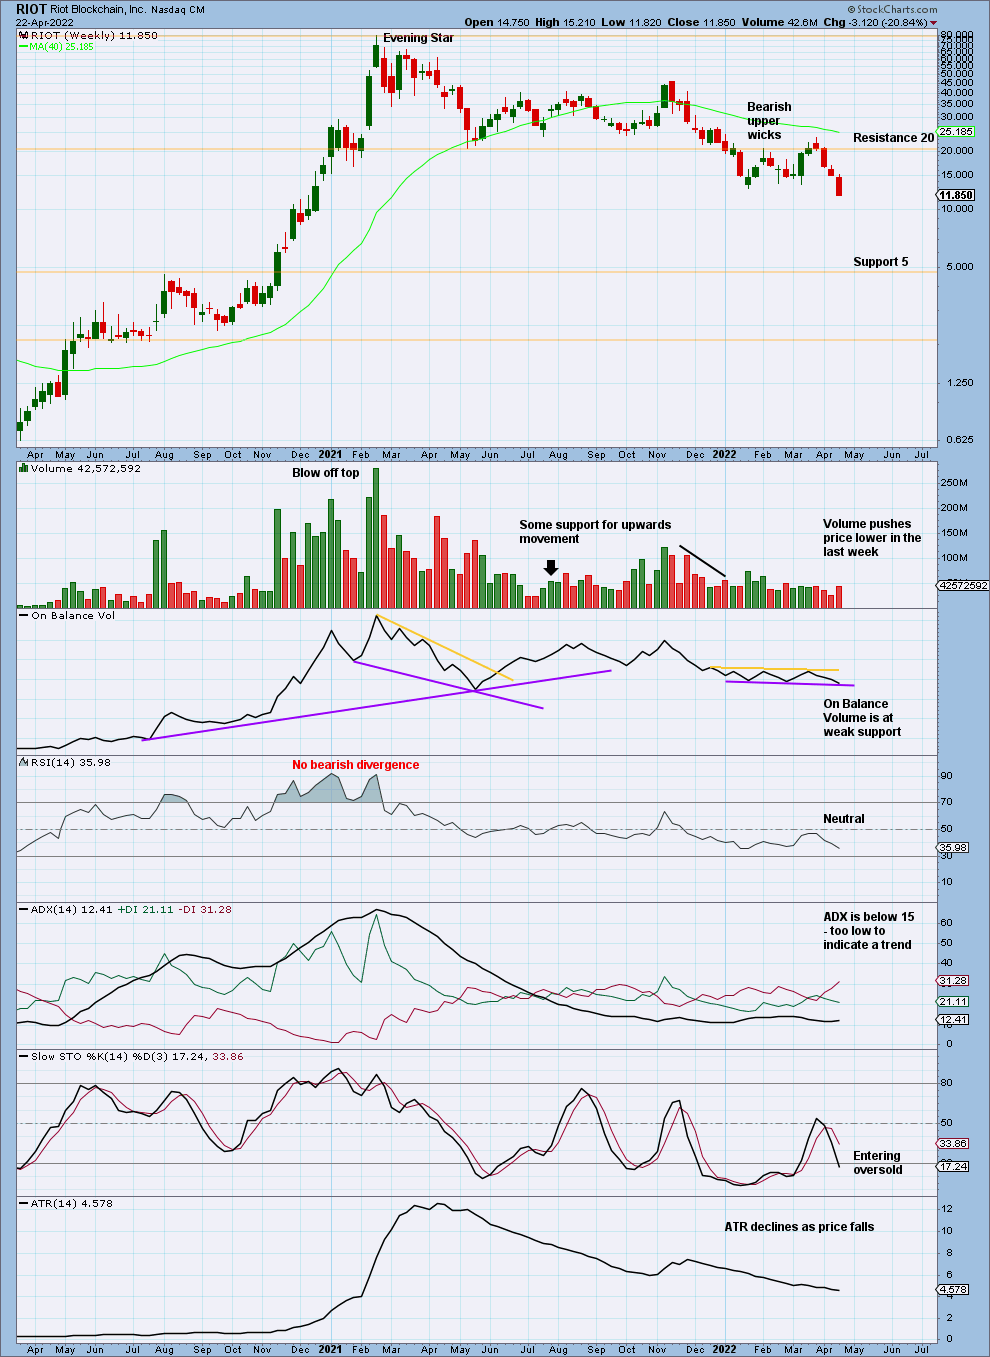
In last analysis it was noted that support at 20 was breached and it would be reasonable to expect price to continue lower to next support which is about 5. This is what is happening so far.
On Balance Volume is weak; the support line has only the minimum required two anchor points. A break below support here would be a very weak bearish signal.
If ADX reaches 15, then a very bearish signal would be given. At this time, ADX is too low to indicate a trend.
Stochastics is entering oversold, but it can move deeply oversold and remain there while price travels a considerable distance. If RSI reaches oversold, then downwards movement may reasonably be expected to end very shortly afterwards.
DAILY CHART
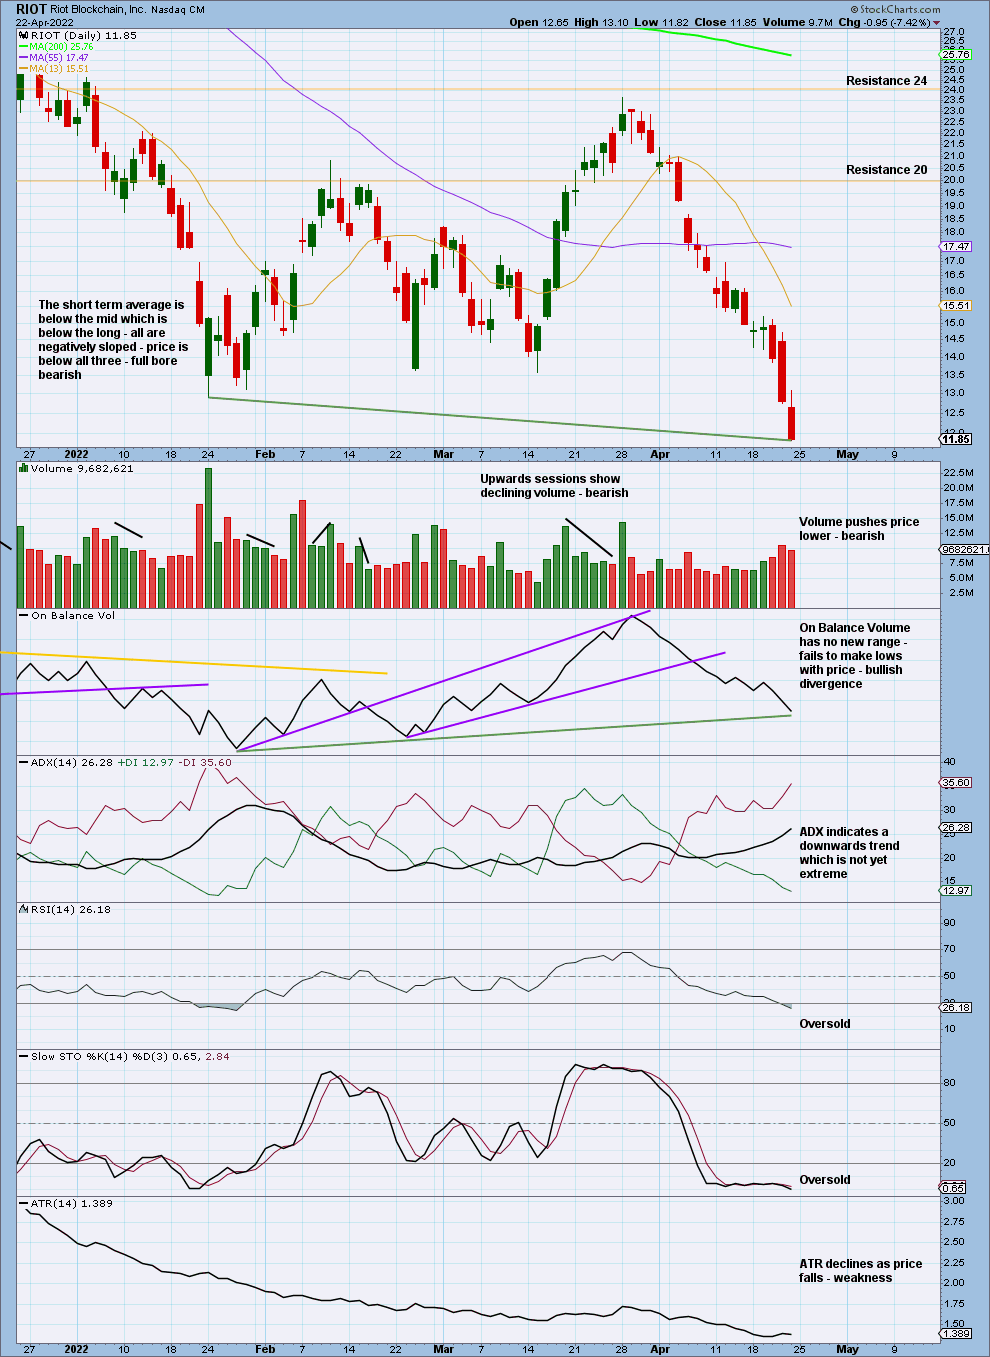
Click chart to enlarge. Chart courtesy of StockCharts.com.
Volume and ADX are bearish. RSI is oversold; it tends to not remain oversold for too long for this market, so the downwards trend may reasonably be expected to end sooner rather than later now. On Balance Volume indicates some weakness in downwards movement, reinforcing this view.
The Elliott wave target zone looks reasonable.
Published @ 12:17 p.m. ET.
—
Careful risk management protects your investment account(s).
Follow my two Golden Rules:
1. Invest only funds you are prepared to lose entirely.
2. Always have an exit strategy for both directions; when or where to take profit on a winning investment, and when or where to close a losing investment.
—
New updates to this analysis are in bold.
—
 Save as PDF